In the field of software engineering, understanding and mastering the different views of the Unified Modeling Language (UML) is essential for effective communication and clear design. Today we will explore the topic of UML activity diagrams.
We have previously shared sequence diagrams, deployment diagrams, use case diagrams, etc. in the UML family. As an important member of the UML family, we should also get to know the activity diagram well.
Next, we will start from the basic concepts and gradually unveil the UML activity diagram, and appreciate its unique charm in improving project efficiency and optimizing system design.
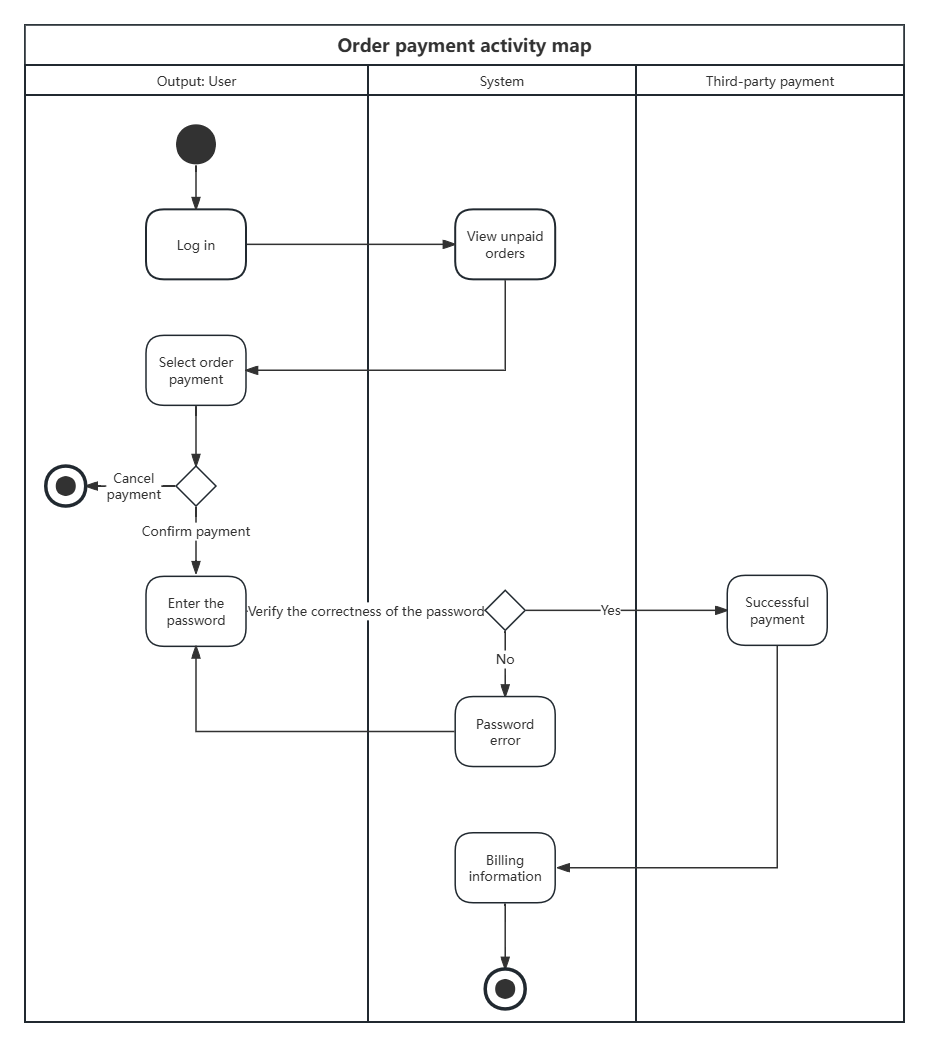
UML Activity Diagram - Order Payment
The activity diagram is one of the diagrams in UML that describes the dynamic behavior of the system. It is mainly used to show the activities or actions of the classes involved in the behavior and describe the execution flow of various activities in the system, including business processes, software operations, or interactions between objects.
In UML, the importance of activity diagrams is reflected in the following aspects:
1. Activity diagrams help to clearly show the dynamic behavior of the system. Through activity diagrams, developers can clearly see how the various activities in the system are executed in a specific order and how these activities are related to each other, which is crucial for understanding and analyzing the operation process of the system.
2. Activity diagrams are an important tool for understanding and optimizing business processes. Through activity diagrams, developers can gain an in-depth understanding of the operation of each link in the business process, identify possible bottlenecks or problems, and make optimizations and improvements.
3. Activity diagrams can be used for use case analysis and design. In use case analysis, activity diagrams can help developers describe the interaction process between users and systems in detail, thereby ensuring that the system can meet user needs. In the design phase, activity diagrams can be used to guide developers on how to design the system's operating procedures to ensure that the system's functions and performance meet design requirements.
4. Activity diagrams facilitate collaboration and communication between team members. By viewing activity diagrams, team members with different roles can more easily understand the functions and processes of the system, thereby collaborating and communicating more effectively.
Activity diagrams are similar to traditional flowcharts in nature, but they are different from flowcharts in the following aspects:
1. Flowcharts have a long history, a wide range of uses, many drawing elements, and different drawing standards. Activity diagrams have few elements, clear standards, and are clearly defined in the official UML documentation, making them easy to learn.
2. Flowcharts focus on describing the processing process. The main control structures are sequence, branching and looping. There is a strict sequence and time relationship in each processing process, while activity diagrams focus on expressing system behavior and describing the principles followed by the sequence relationship of object activities. 3. Activity diagrams focus more on describing the control flow between objects, especially emphasizing the representation of concurrent activities, while flowcharts cannot. Activity diagrams are object-oriented, while flowcharts are process-oriented.
The constituent elements of an activity diagram are initial nodes, terminal nodes, activities and action flows, judgment nodes, merge nodes, fork nodes and confluence nodes, objects and object flows, swimlanes, etc. Next, each element is explained with examples.
1. Initial and final nodes
The initial node indicates the beginning of the process. In the UML activity diagram, there is usually an initial node, which has no entrance but one or more exits pointing to the next activity or decision node. It is represented by a solid ball.
The termination node indicates the end of the process. The termination node has no exit, but has one or more entrances. When the process reaches the termination node, it means that the entire activity diagram has been executed. It is represented by a half-solid ball.

2. Activities and Action Flow
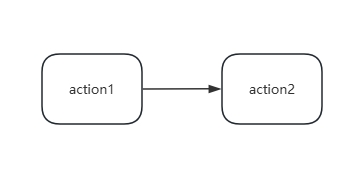
An activity is a process that performs a specific action and then transitions to another state after the action is completed. It is usually represented by a rounded box with the action being written inside the box. Action flows connect activities, usually represented by solid arrows.
3. Decision Node
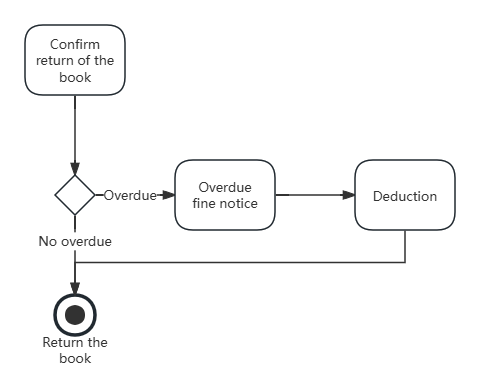
A decision node is also called a decision node or a conditional node. A decision node describes a trigger event that causes multiple different transfers under different trigger conditions. It has one entry and multiple exits, and each exit is associated with a condition. When the process reaches a decision node, these conditions are evaluated and the corresponding exit is selected based on the results. It is usually represented by a diamond.
4. Merge Nodes
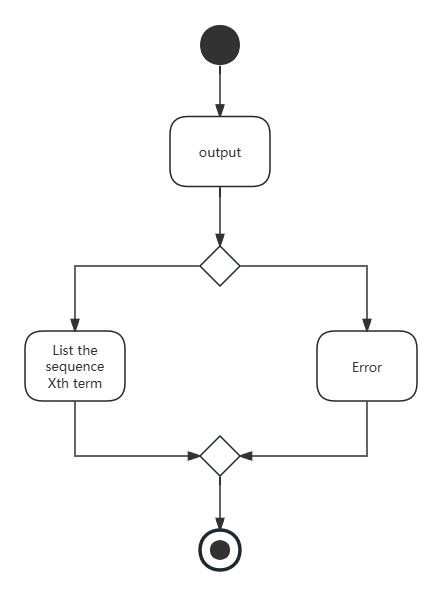
The merge node is mainly used to merge multiple control flows and export them to the same outgoing control flow. This node has no time and data significance, that is, it does not need to wait for all incoming control flows to complete, nor does it require data synchronization between them. The several incoming control flows of the merge node are in an "or" relationship, and only one needs to be satisfied, not all.
A merge node is usually represented by a diamond shape with at least two arrows pointing to it, but only one arrow emanating from it pointing to another action or activity node.
5. Fork and Join Nodes
A fork node is used to split a single path into multiple concurrent paths. A fork node has one entry and multiple exits. When a process reaches a fork node, it will be executed along all exits at the same time.
The confluence node is the opposite of the fork node and is used to merge multiple concurrent paths into a single path. The confluence node has multiple entrances and one exit, and the process will continue to the exit only when all entrances are activated.
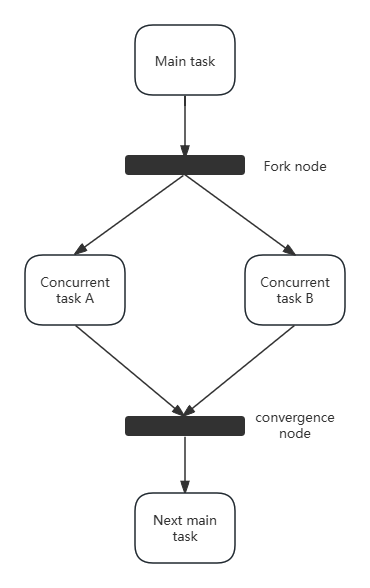
Note : The main difference between a merge node and a join node is that a merge node focuses more on merging multiple possible paths into one, while a join node emphasizes the synchronous completion of all concurrent paths.
6. Objects and object streams
Object flow represents the transfer of objects between activities. Object flow can represent data input to an activity or output data produced by an activity. It is optional or required, depending on its importance in the activity. Objects are usually represented by rectangles, and object flows connect objects and actions, usually represented by dashed arrows .

7. Lanes
Used to divide the activity diagram into different logical areas, each representing a participant or responsible party. Swimlanes can help clearly show the interactions and division of responsibilities between different participants.
For example: booking a paid venue
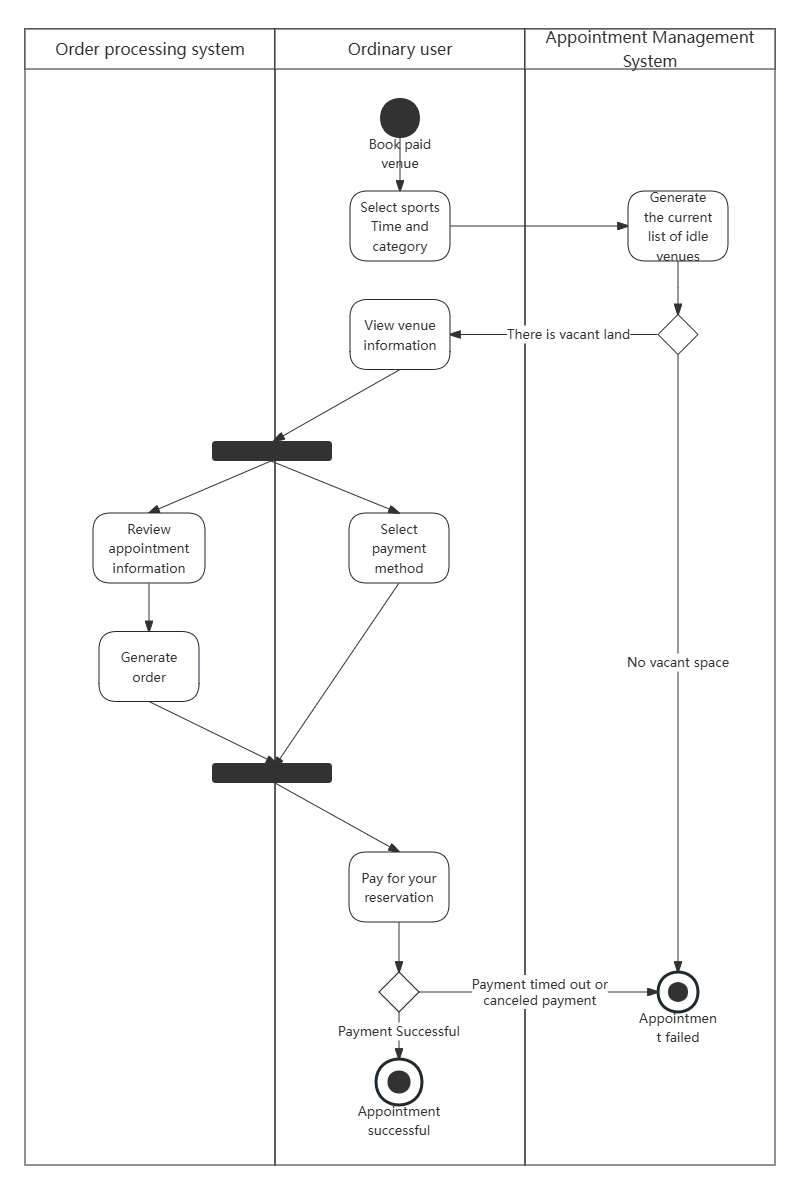
Booking and paying venue activity map
UML activity diagrams are widely used in various fields, including software development, business process modeling, system architecture design, etc. It is particularly suitable for describing scenarios such as concurrent activities, decision points, branches and merges in complex systems. Through activity diagrams, developers can intuitively understand the dynamic behavior of the system, so as to better design and develop the system.