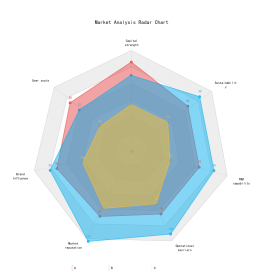
Academic performance radar chart
2025-02-12 18:25:39 86 0 Report 0
0

Login to view full content
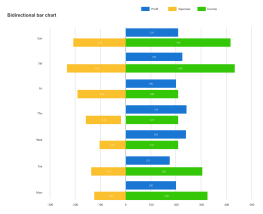
This is an academic performance radar chart, designed to visually represent a student's proficiency across various subjects. The chart highlights the student's scores in Biology, Politics, English, History, and Mathematics, with scores ranging from 60 to 100. Grades are represented with letters, showcasing an A in Politics and English, while other subjects like Biology, History, and Mathematics have varying performance levels. This radar chart serves as a comprehensive tool for analyzing academic strengths and identifying areas for improvement in a student's educational journey.
Other creations by the author
Outline/Content
60
Biology
90
70
Politics
100
80
A
English
B
History
Mathematics
Collect

0 Comments
Next page
Recommended for you
More