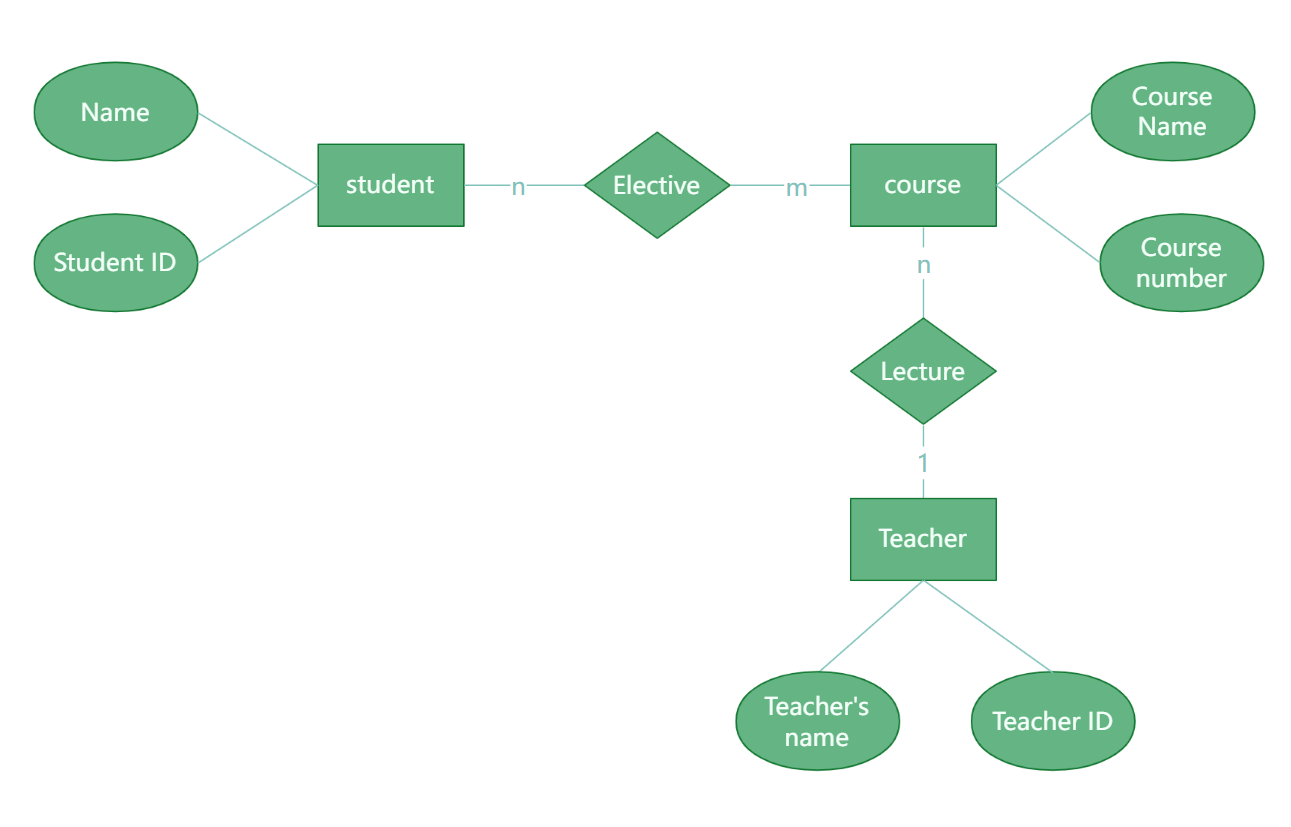
In the data-driven era, entity-relationship diagrams (ER diagrams) are the core tools for data modeling and are essential for understanding, designing, and optimizing database structures. However, traditional hand-drawn or complex software methods of drawing ER diagrams are often inefficient and difficult to collaborate with. Fortunately, ProcessOn, an online drawing tool, has become an ideal choice for drawing ER diagrams on a computer with its intuitive interface, rich feature set, and efficient collaboration capabilities. This article will show you the unique charm of ProcessOn in drawing ER diagrams through concise and easy-to-understand tutorials combined with ER diagram examples .
ProcessOn is an online collaboration platform that integrates multiple graphic drawing functions such as flowcharts, mind maps, UML diagrams, ER diagrams, etc. It does not require installation, you only need to register and log in to use it, which greatly reduces the threshold for use. At the same time, ProcessOn supports cloud storage to ensure that your work can be accessed and edited anytime and anywhere. More importantly, ProcessOn provides a rich template library and powerful customization functions, making it fast and professional to draw ER diagrams.
First, visit ProcessOn official website (https://www.processon.io/), register and log in. After logging in, you will see a simple and clear operation interface , and then enter the personal file page.

Creating ER diagrams using ProcessOn
logging into ProcessOn and entering the personal file page, click the "New" button on the left side of the interface and select the "ER Diagram" type to create a new ER diagram project. If you are not familiar with the structure of the ER diagram, you can first select an ER diagram template from the ER diagram templates provided in the ProcessOn template community as a starting point, and then modify and expand it based on this.

Creating ER diagrams using ProcessOn
In ER diagrams, entities are graphic symbols that represent objects or concepts in the real world. In ProcessOn , you can add entities by dragging the "Entity" icon from the graphic library onto the canvas. Double-click the entity box, enter the name of the entity, and set the entity's color, border and other styles as needed.
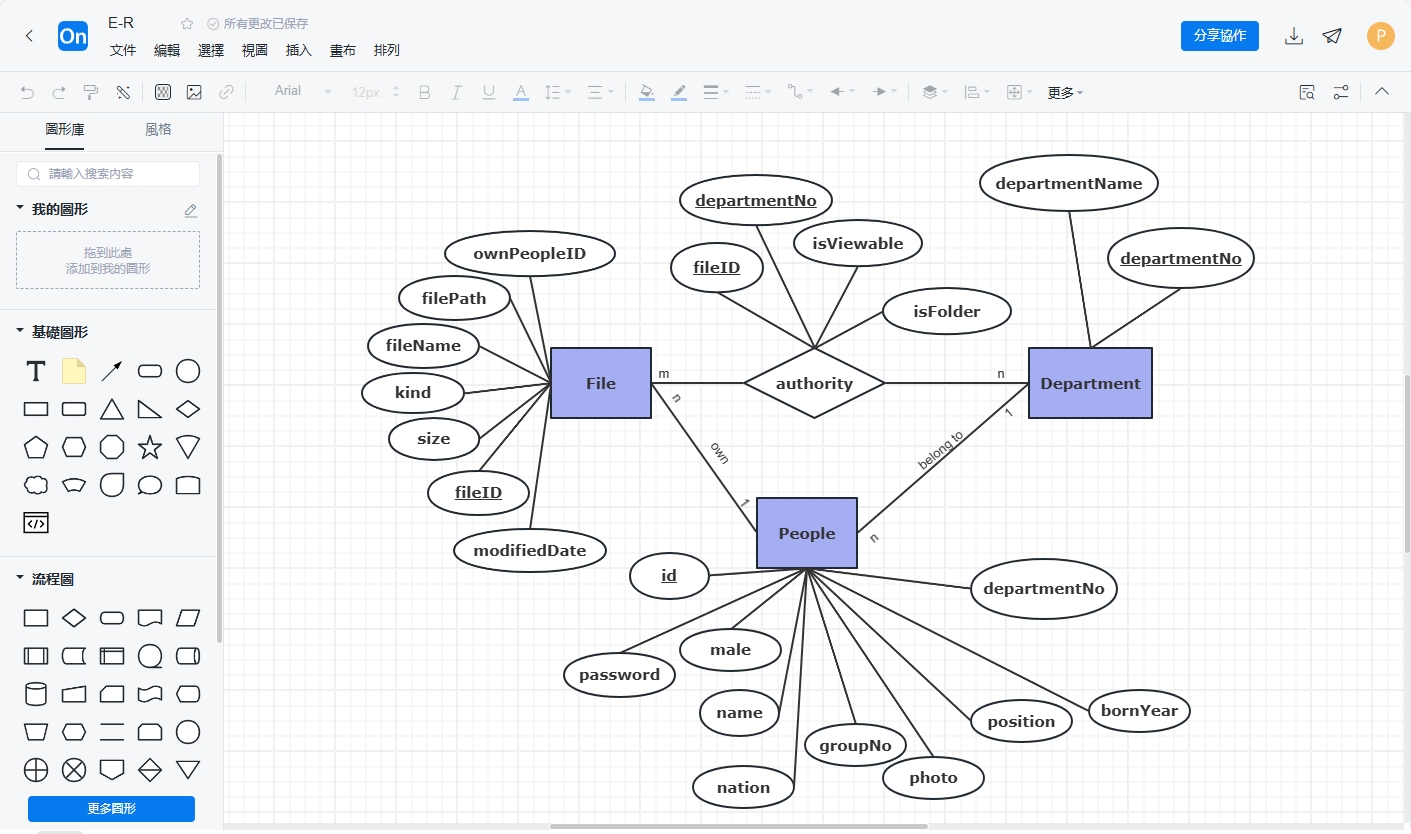
Creating ER diagrams using ProcessOn
Each entity has its own specific attributes, which are used to describe the characteristics of the entity . In drawings, ellipses are usually used to represent attributes . In ProcessOn , you can drag and drop ellipse elements in the graphics library to add attributes to the entity. Select the attribute element and click "Data Attributes" in the upper toolbar to enter the attribute name and type (such as integer, string, etc.), and you can optionally set the default value of the attribute, whether it can be empty, and other attributes.
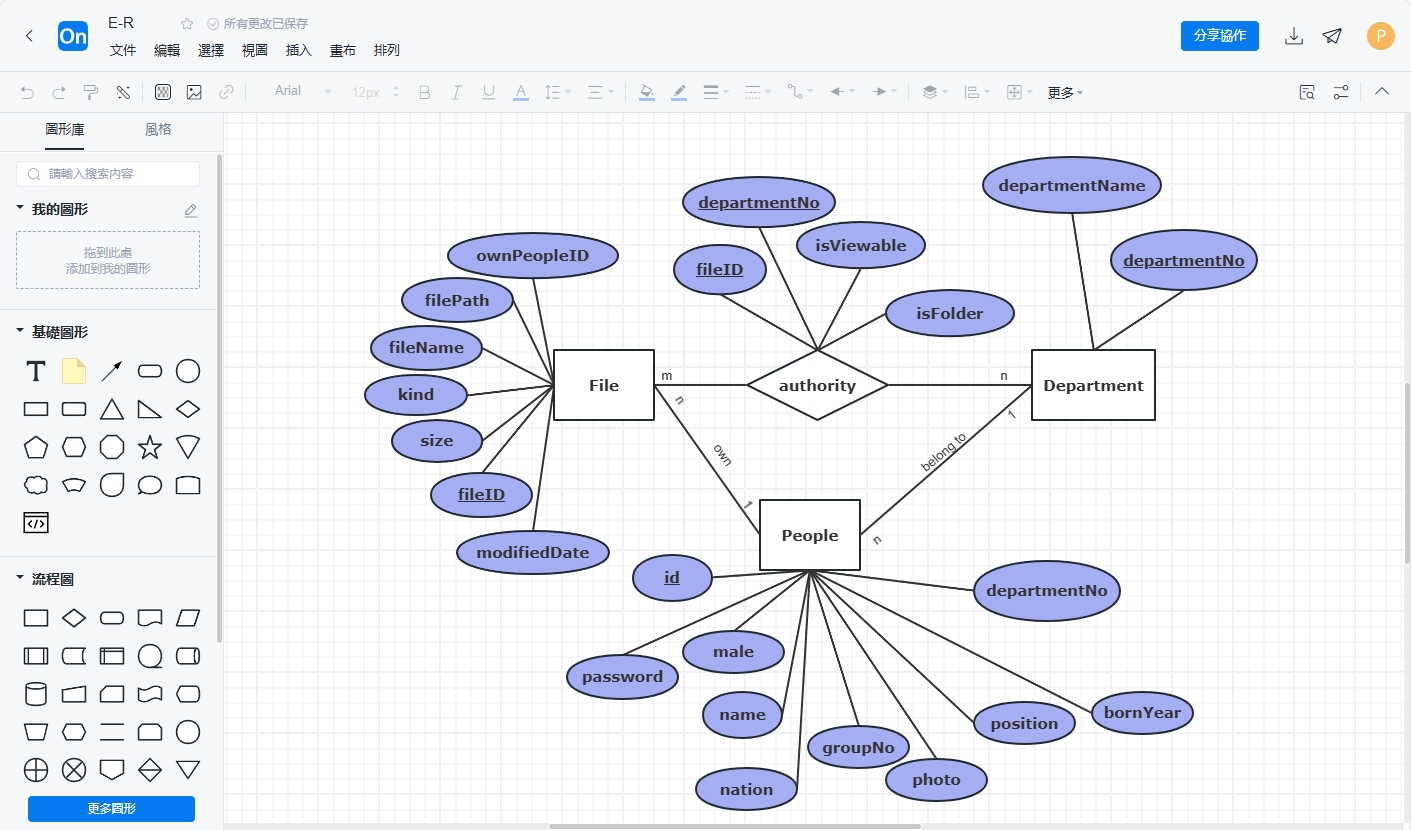
Creating ER diagrams using ProcessOn
Relationships in ER diagrams are used to represent connections between entities. ProcessOn supports multiple relationship types, such as one-to-one (1:1), one-to-many (1:N), many-to-many (M:N), etc. You can draw a relationship by dragging the relationship icon in the toolbar between two entities and adjust the direction of the arrow to indicate the direction of the relationship. Double-click the relationship line to enter a description of the relationship.
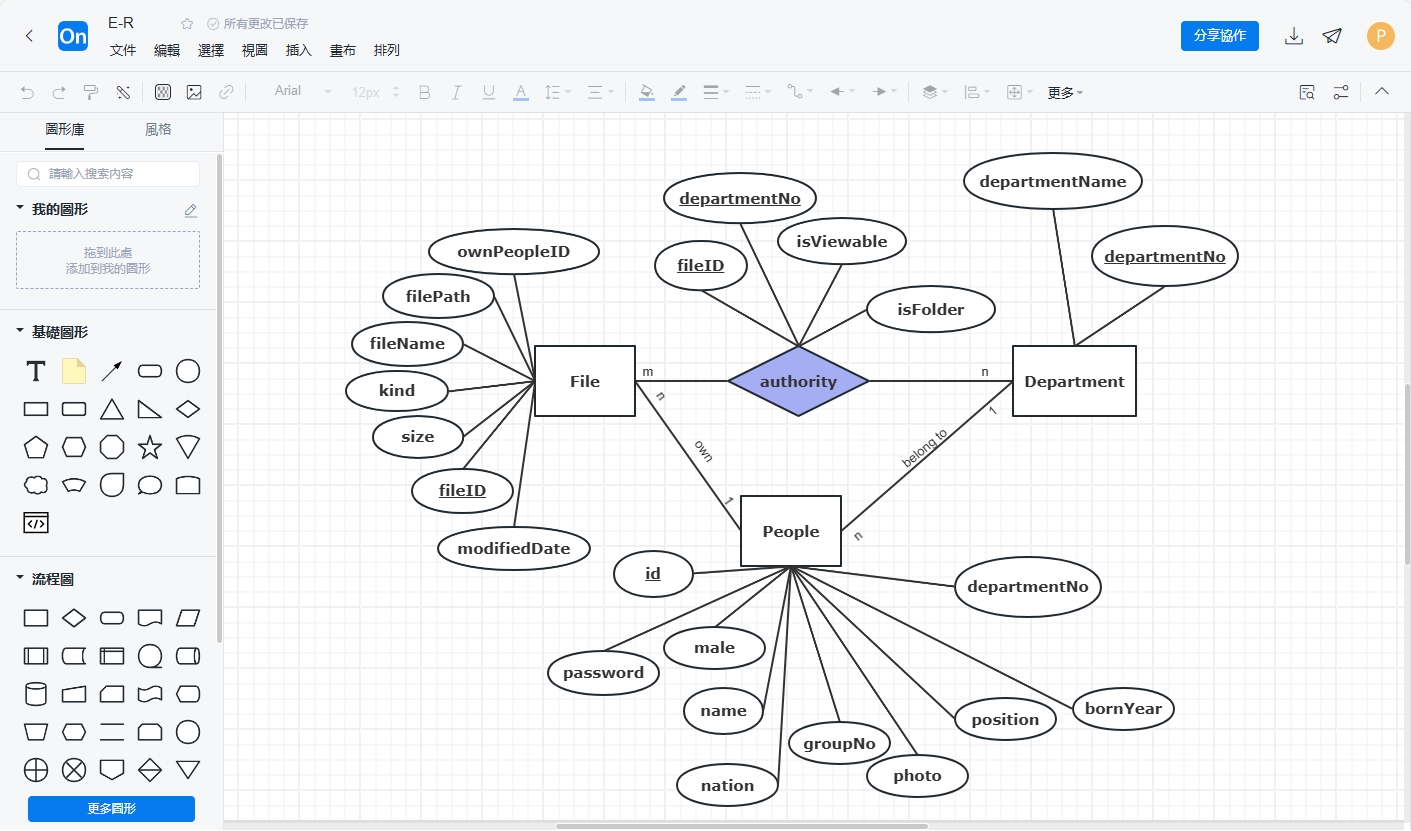
Creating ER diagrams using ProcessOn
Next, we will use a practical case - drawing an ER diagram of a library management system to demonstrate the practical application of ProcessOn in ER diagram drawing.
In a library management system, common entities include "books", "readers" and "borrowing records". Each entity has its own specific attributes, such as "book number", "title" and "author" of books, "reader number", "name" and "gender" of readers, and "record number", "borrowing date" and "return date" of borrowing records.
After determining the entities and attributes, we need to define the relationship between these entities. In the library management system, there is a one-to-many relationship between "books" and "borrowing records" (a book can be borrowed by multiple readers), and there is also a one-to-many relationship between "readers" and "borrowing records" (a reader can borrow multiple books). At the same time, "books" and "readers" are indirectly related through "borrowing records", forming a many-to-many relationship.
Based on the above analysis, we can draw the ER diagram of the library management system in ProcessOn . First, add three entities, "Books", "Readers" and "Borrowing Records", and set corresponding properties for them. Then, draw relationship lines to represent the connection between entities, and set the type and description information of the relationship. Finally, further improve and optimize the ER diagram as needed, such as adjusting the layout, setting the color and style, adding comments and instructions, etc.
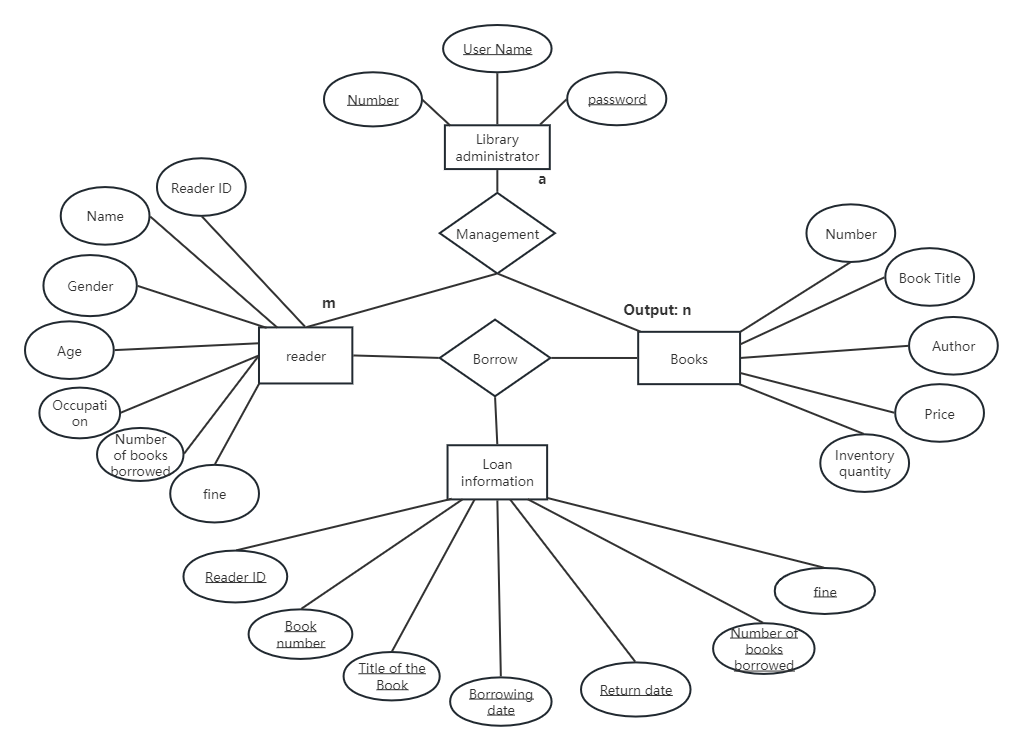
Library Management System ER Diagram
Through the tutorials and examples in this article, I believe you have a deeper understanding of the efficient use of ProcessOn in ER diagram drawing. ProcessOn not only simplifies the process of drawing ER diagrams, but also provides rich functions and powerful collaboration capabilities, making data modeling easier and more efficient. In future work, whether it is database design, system analysis or data visualization, ProcessOn will become your indispensable assistant.
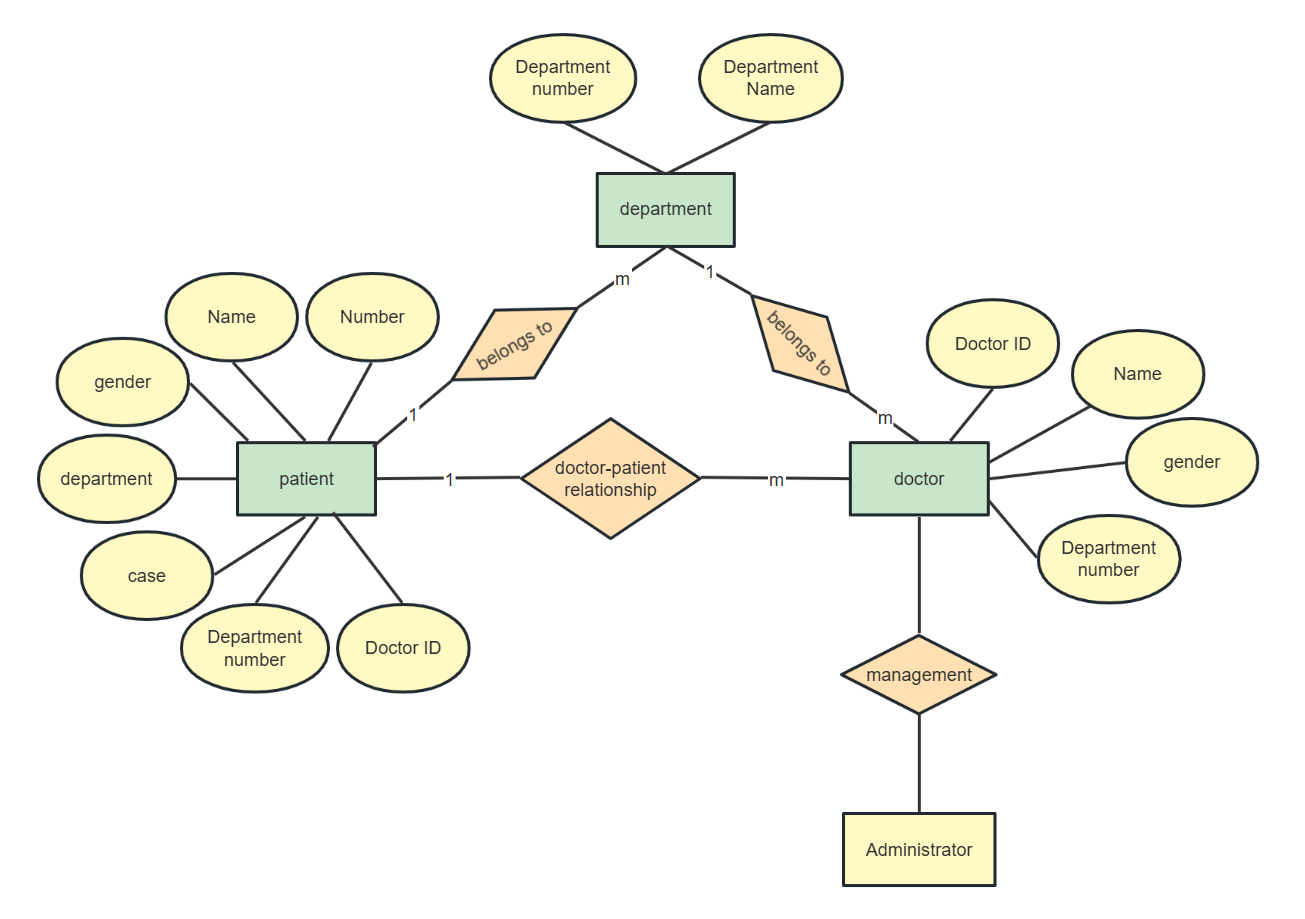
Hospital Information Management System ER Diagram
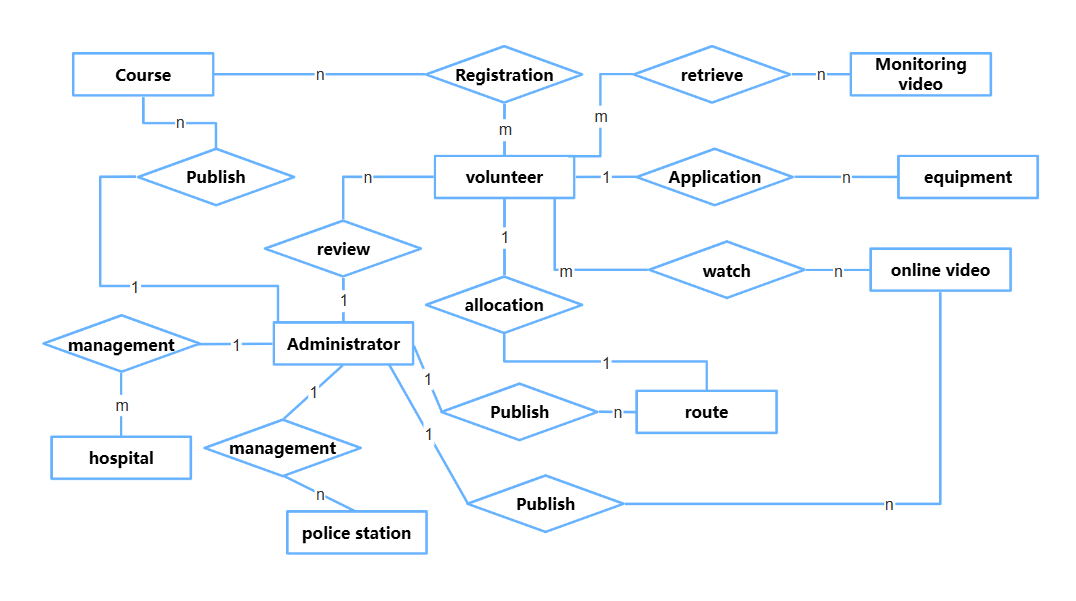
Volunteer Rescue System E-R Diagram
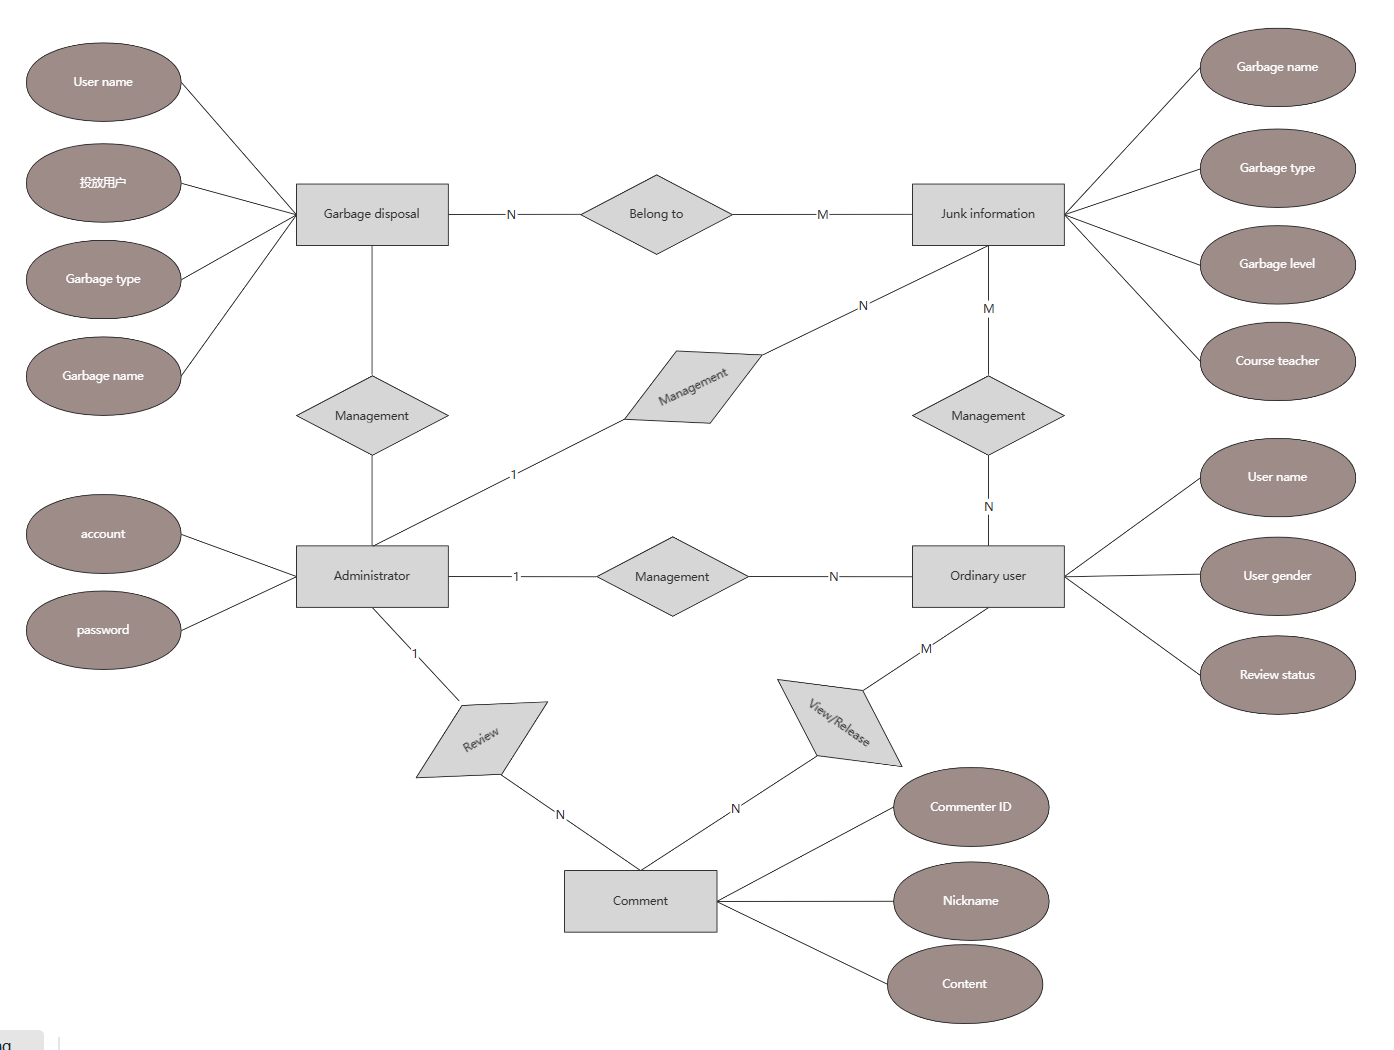
Waste sorting system ER diagram
