In modern enterprise management, Standard Operating Procedure (SOP) has become the cornerstone to ensure efficient and accurate execution of work. As a graphical representation of SOP, SOP flowchart simplifies complex processes into an intuitive and easy-to-understand visual language, greatly improving the transparency and efficiency of operations. This article will combine ProcessOn to deeply explore the concept, function, application scenarios, drawing process and tutorials of SOP flowchart to help everyone better understand and apply this important tool.
SOP flowchart, as the name implies, is a flowchart drawn based on the content of SOP. It clearly shows each step of the operation process, decision points and the logical relationship between them through a series of graphic symbols and lines. These graphic symbols usually include rectangles (indicating steps or operations), diamonds (indicating decisions or judgments), circles (indicating start or end) and arrow lines (indicating process direction and data flow). SOP flowchart aims to transform the SOP described in text into an intuitive visual image for easy understanding and execution.
SOP flowcharts are widely used in various industries, including but not limited to:
In the IT industry, SOP flowcharts are widely used to help companies achieve standardization and regularization of various tasks such as software development, system maintenance, and data management. Team members can clearly understand the process, task allocation, and completion standards of each stage to ensure the orderly progress of work.
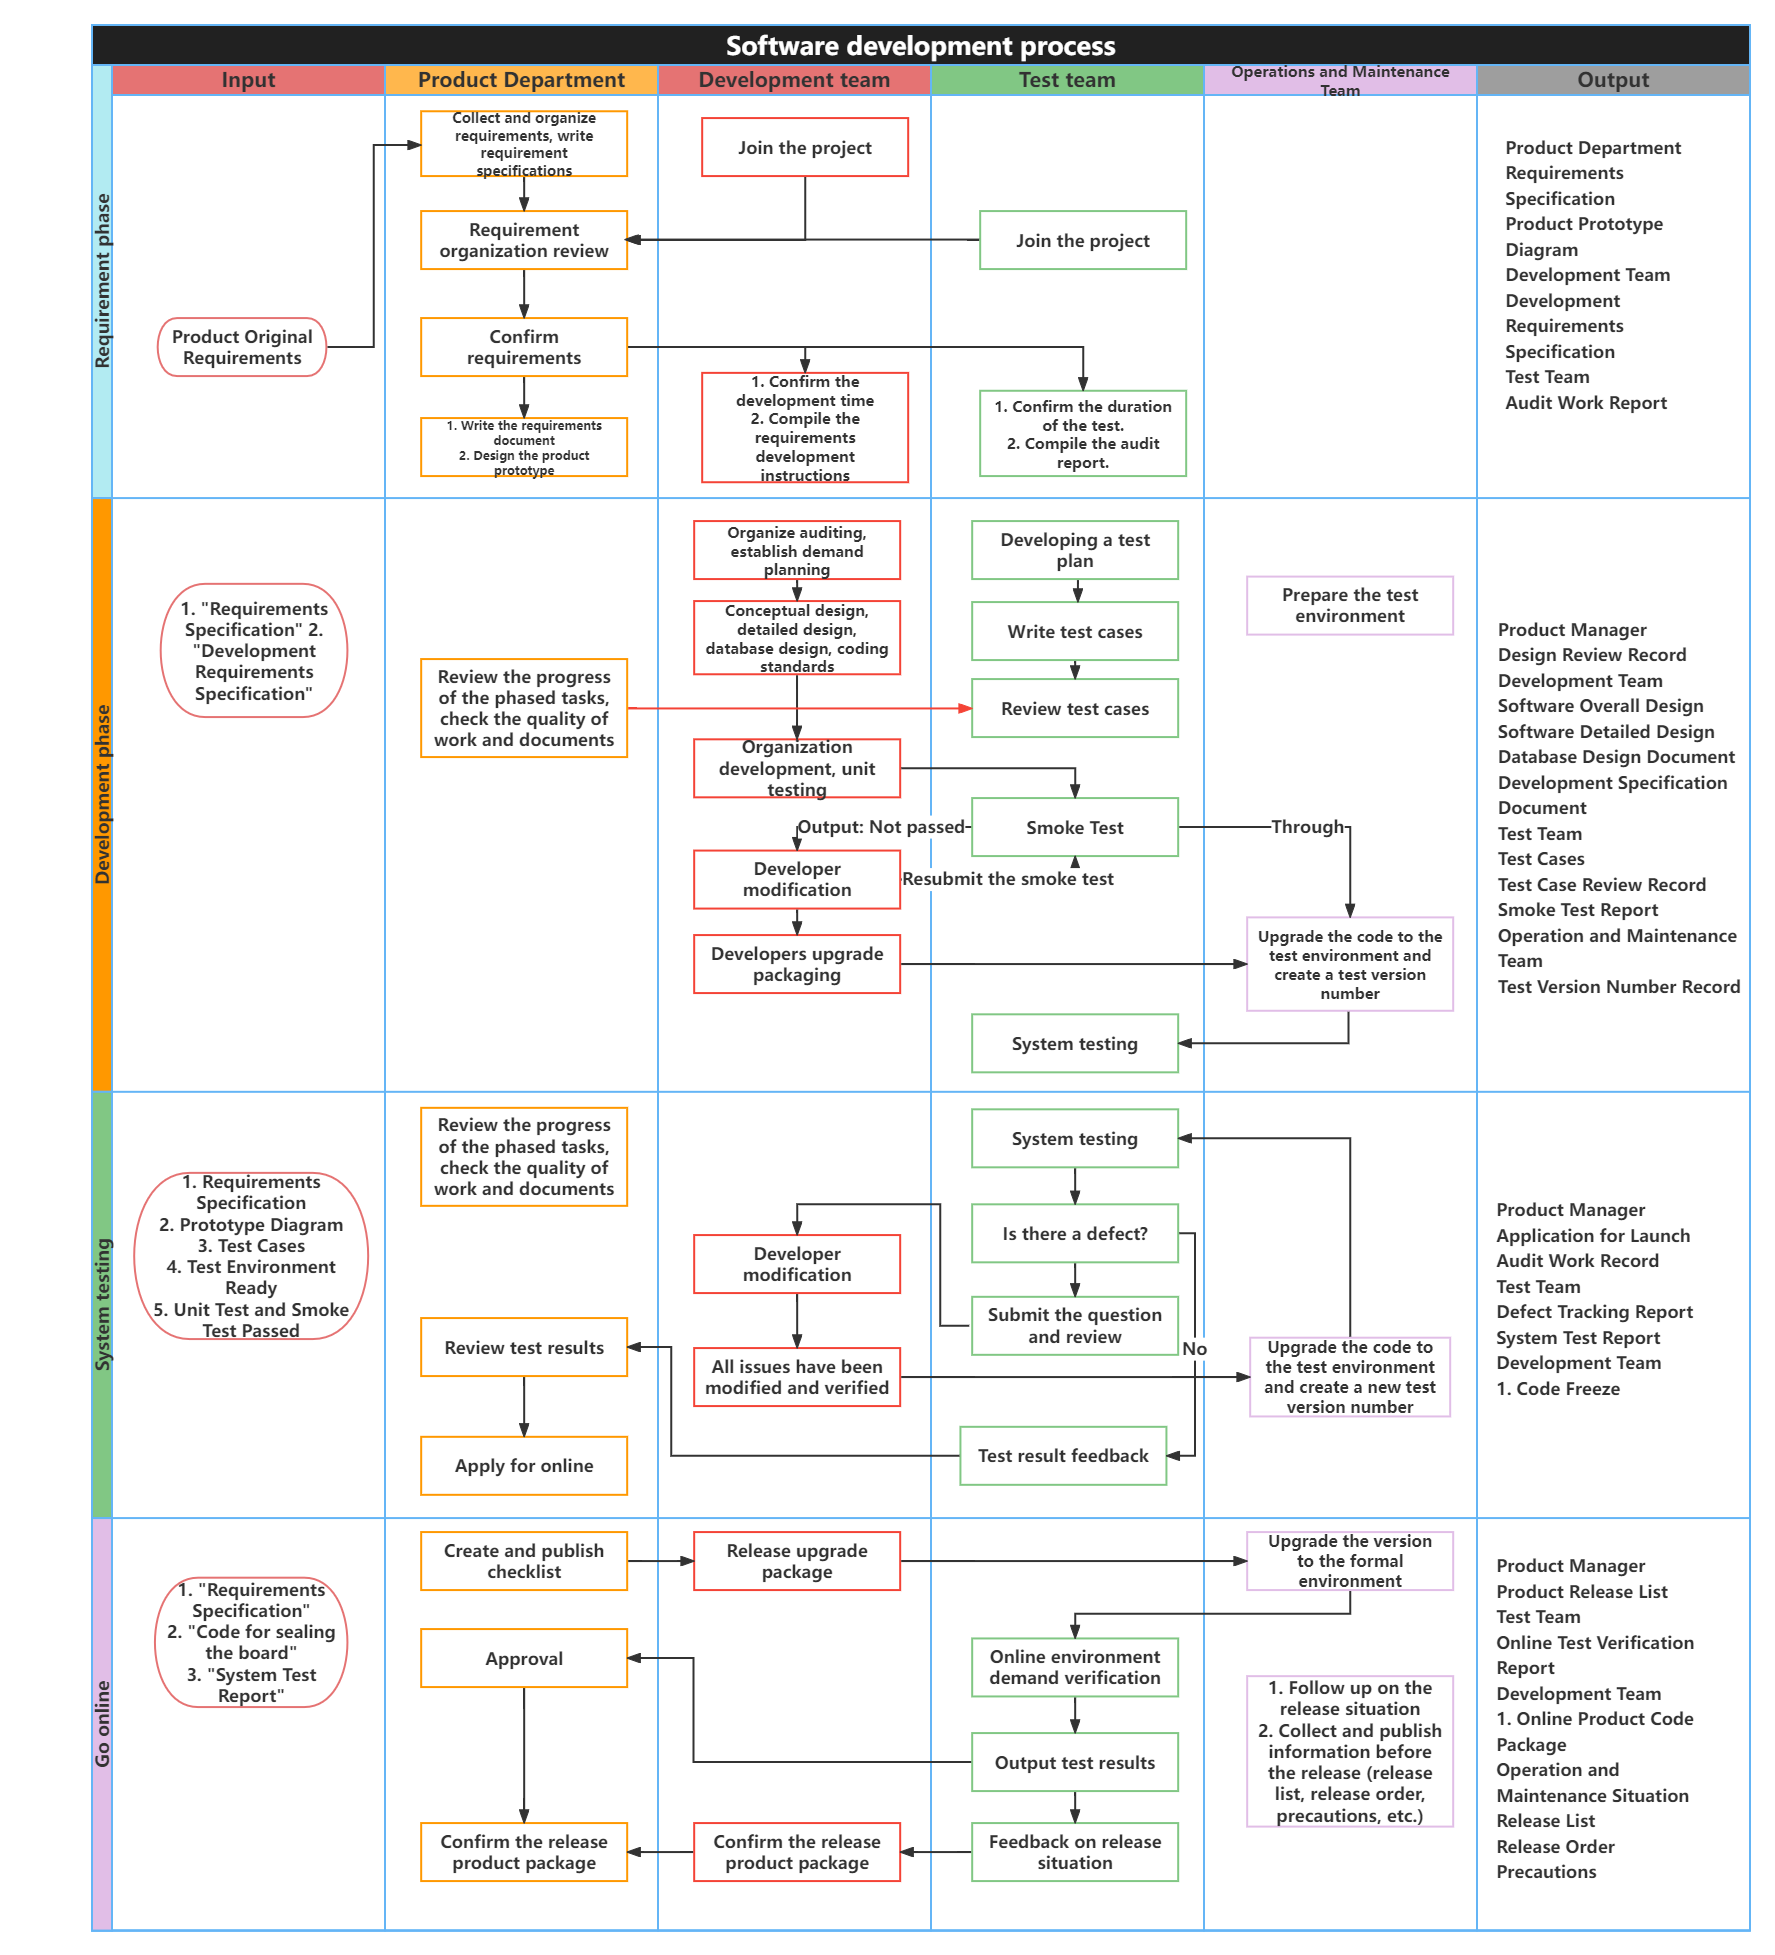
Software Development Process SOP
In the manufacturing industry, SOP flowcharts are used to standardize production processes and clarify the operating requirements, quality control points, and safety specifications of each step. Through flowcharts, employees can clearly understand every link in the production process to ensure product quality and production efficiency. In addition, SOP flowcharts can also help reduce production costs, reduce waste and errors in the production process, and enhance the overall competitiveness of the enterprise.
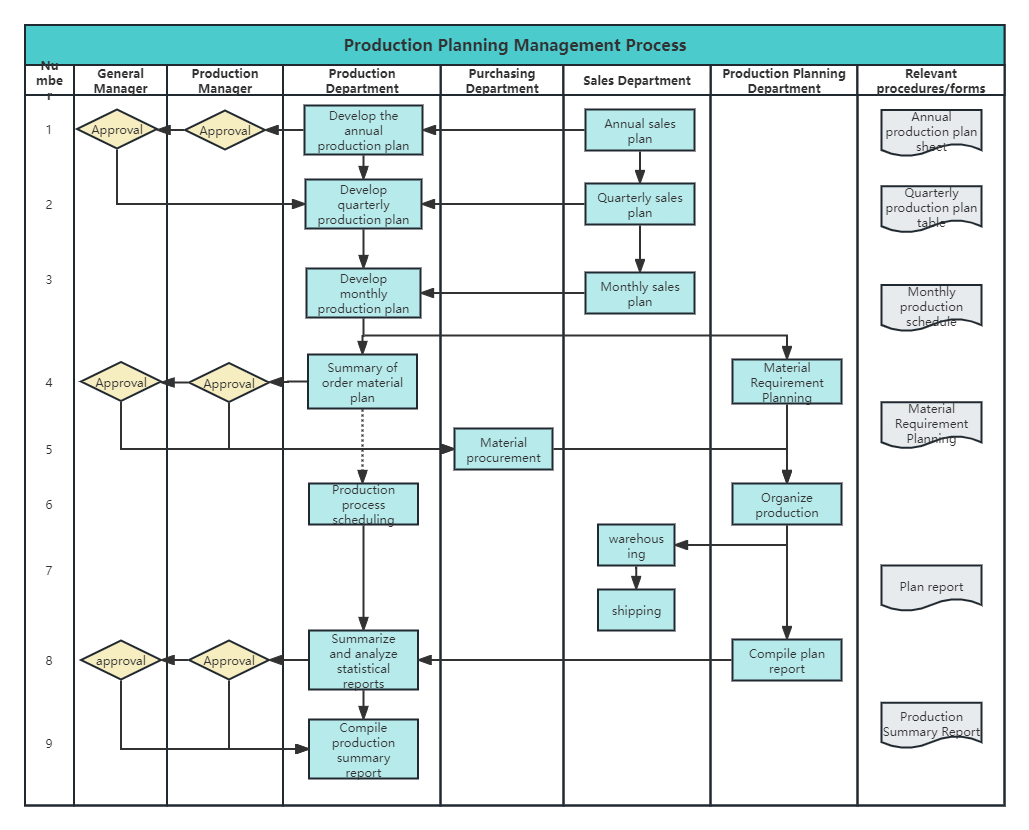
Production planning management process
In the medical and health field, SOP flowcharts are widely used to standardize medical processes, including surgical operations, patient care, and drug management. Through flowcharts, medical staff can clearly understand the operating requirements and precautions for each step to ensure medical quality and patient safety. At the same time, SOP flowcharts can also help improve the professional quality and emergency response capabilities of medical staff.
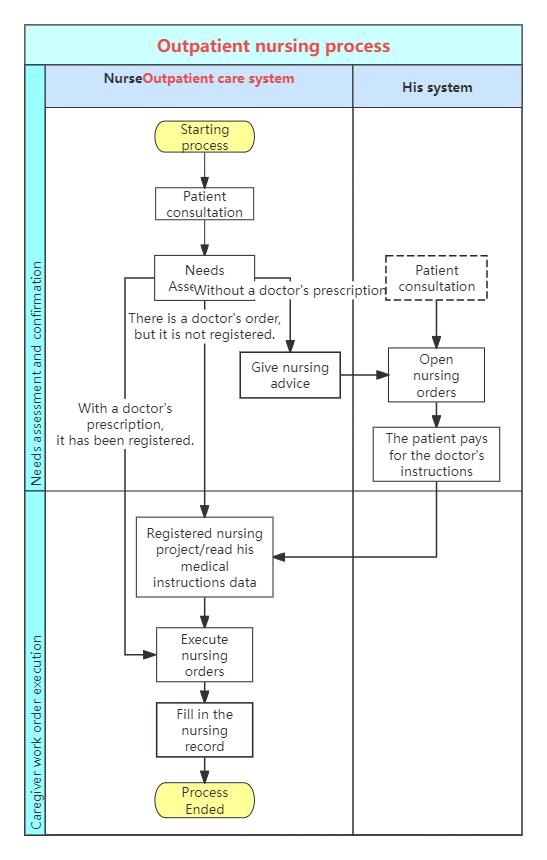
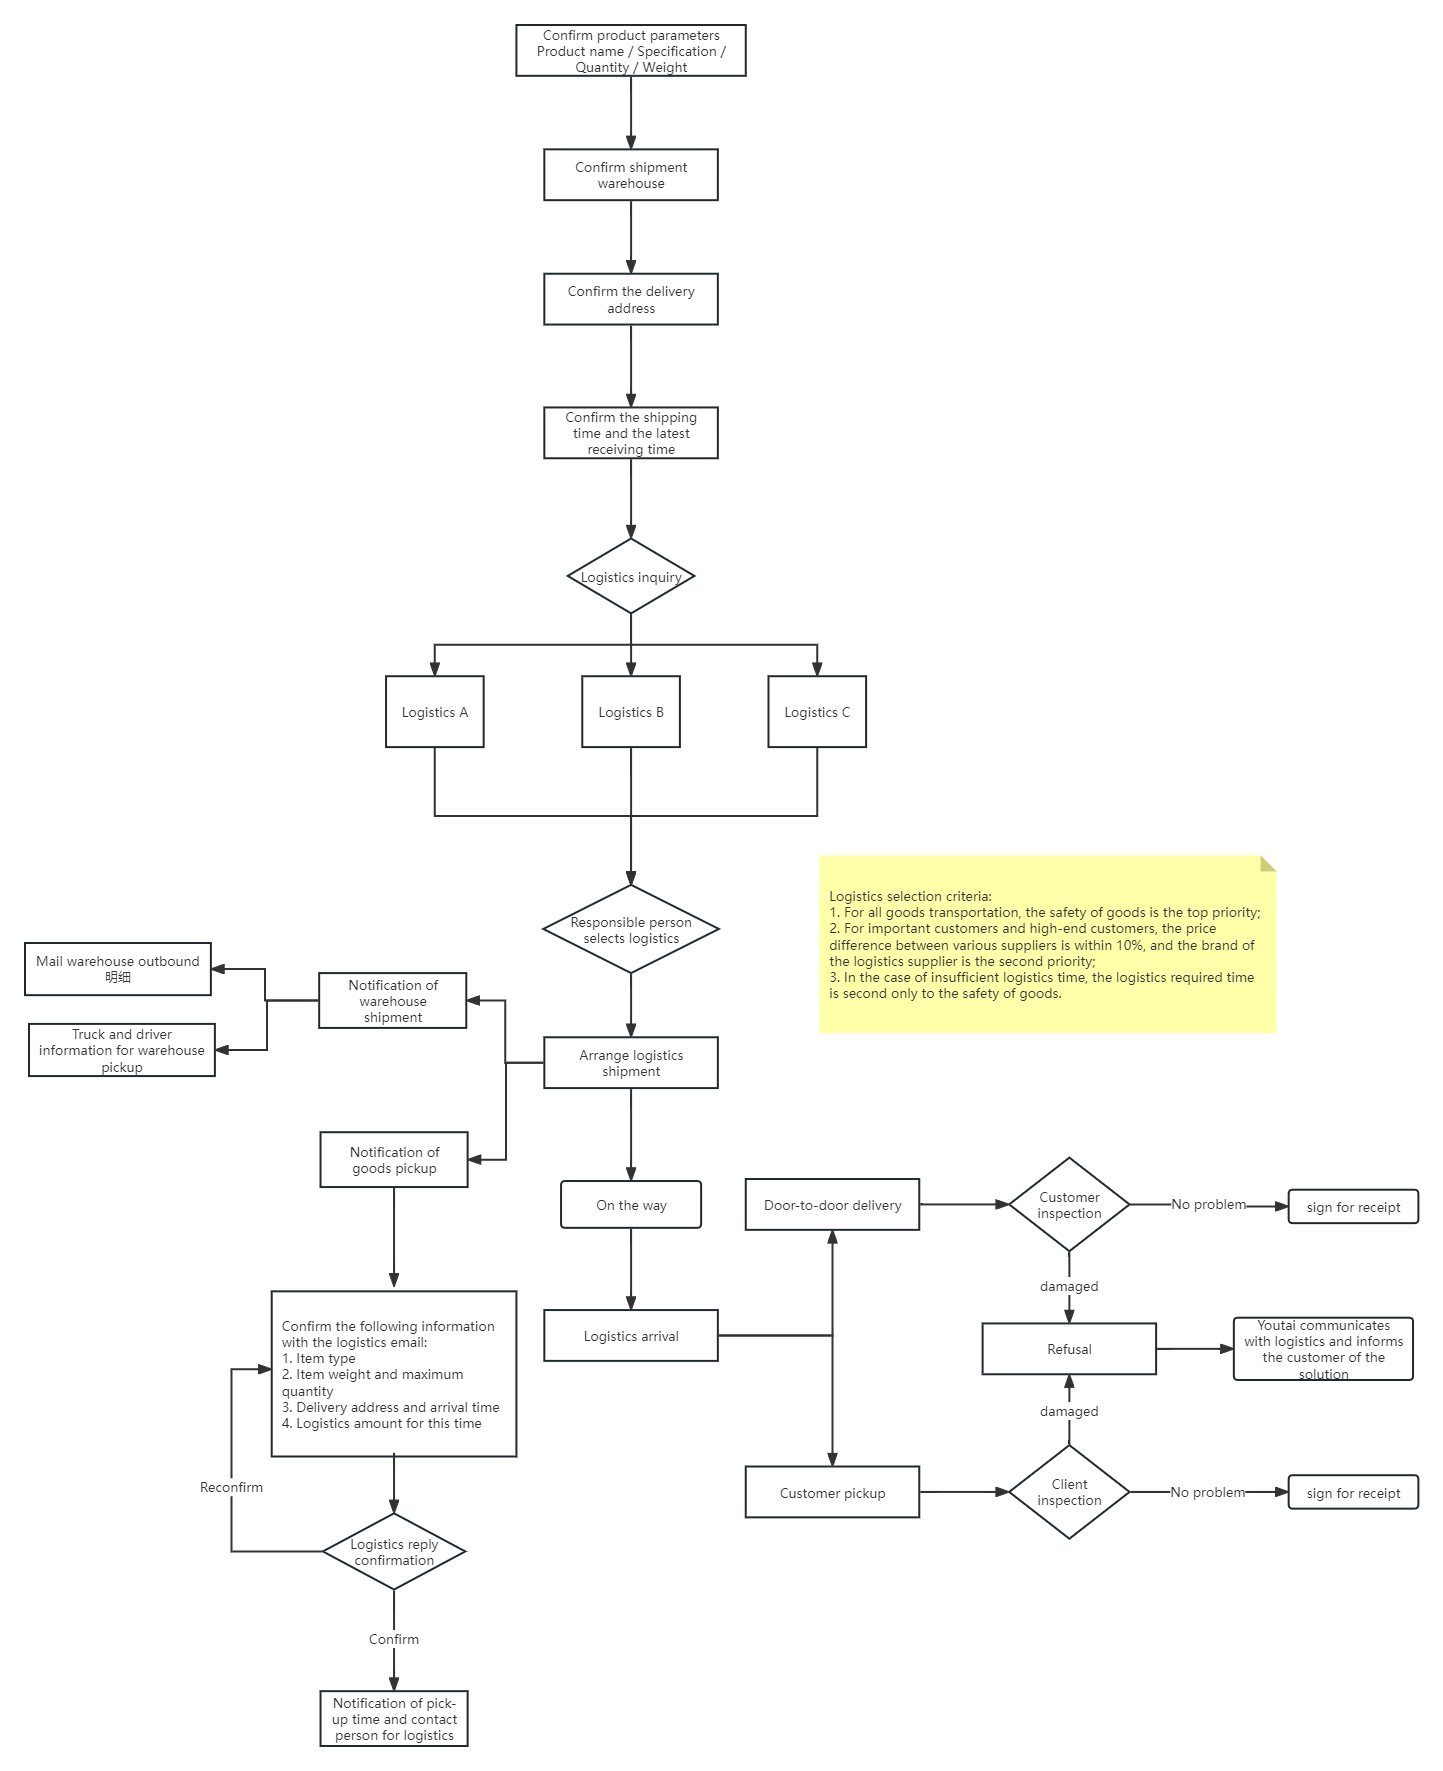
In the field of logistics and distribution, SOP flowcharts are used to standardize the logistics and distribution process, including order processing, picking, packaging, and distribution. Through the flowchart, distribution personnel can clearly understand the operation requirements and time nodes of each step to ensure the accuracy and timeliness of distribution. At the same time, SOP flowcharts can also help reduce errors and delays in the distribution process and improve logistics efficiency.
In the field of human resource management, SOP flowcharts are used to standardize recruitment, training, performance appraisal and other processes. Through flowcharts, the human resources department can clearly understand the operational requirements and standards of each step to ensure the fairness and effectiveness of recruitment and training. At the same time, SOP flowcharts can also help improve employee satisfaction and reduce internal disputes.
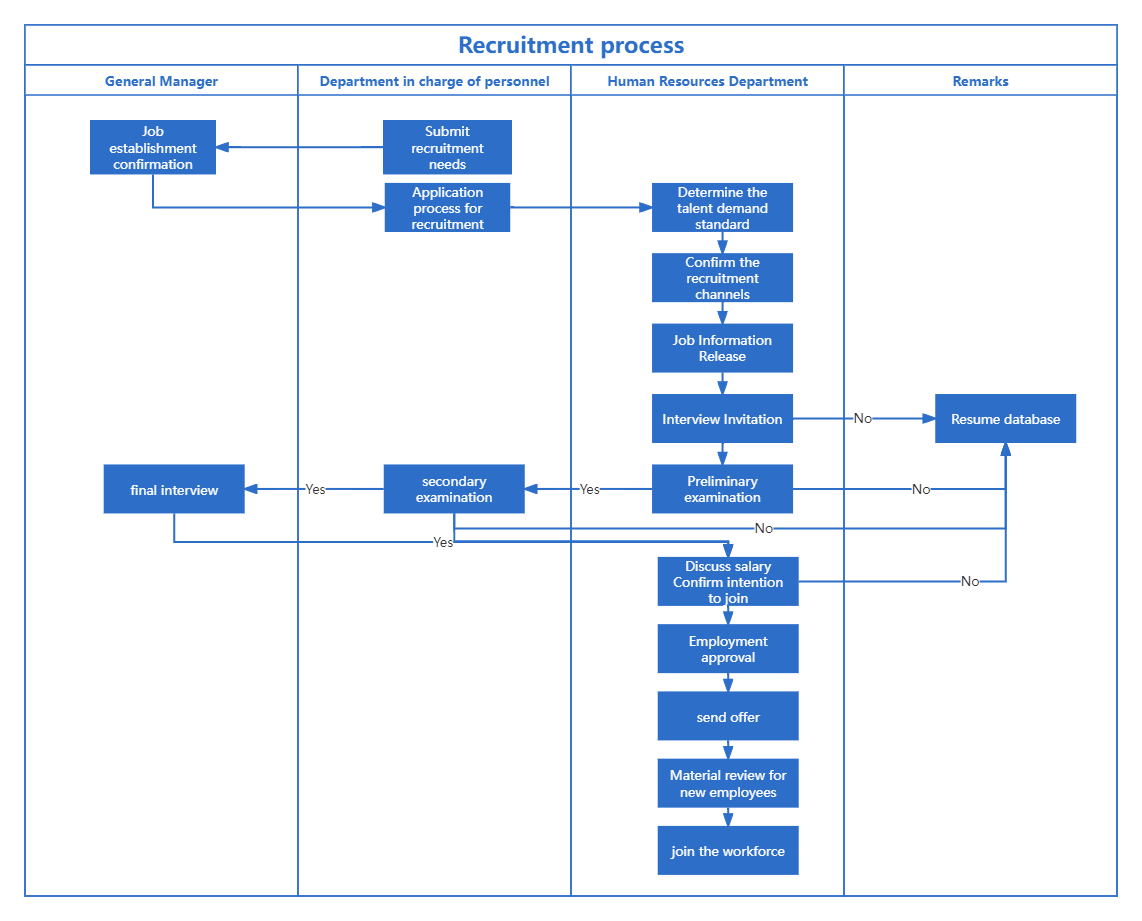
Recruitment process swimlane diagram
Although there is no strict classification standard for flowcharts themselves, a basic consensus has been formed on their graphical expression.
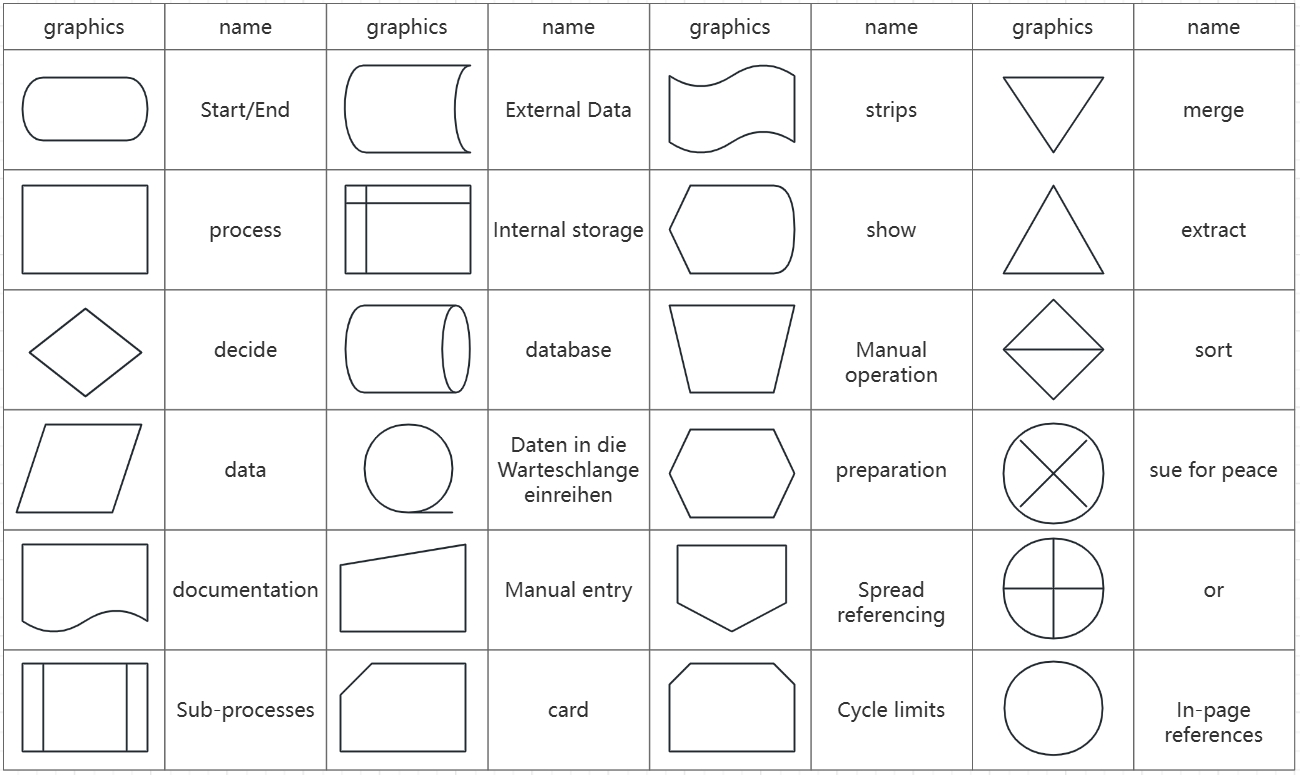
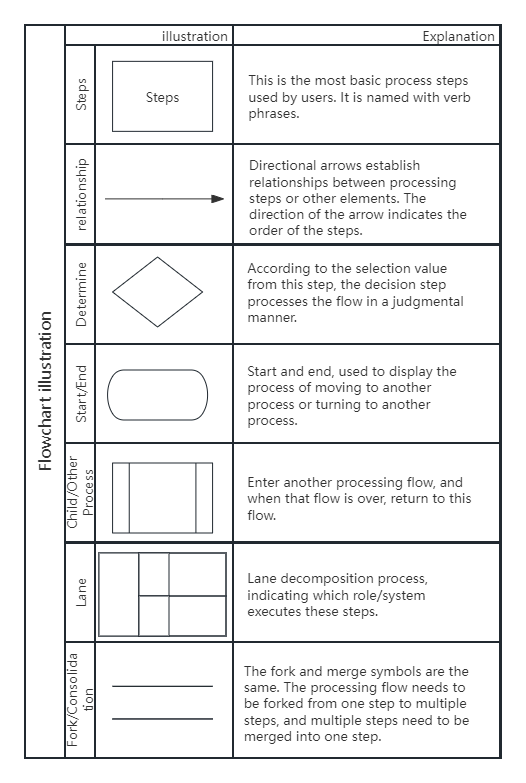
Here we recommend using ProcessOn to draw SOP flowcharts. ProcessOn supports drawing flowcharts, swimlane diagrams, UML diagrams and other professional graphics. It contains rich graphic elements and supports downloading in multiple formats such as pictures, PDF, and Visio. At the same time, there are SOP flowchart templates for multiple scenarios in the ProcessOn template community for reference.
A structure in which multiple processes are performed sequentially, with each process being performed in a top-down order.
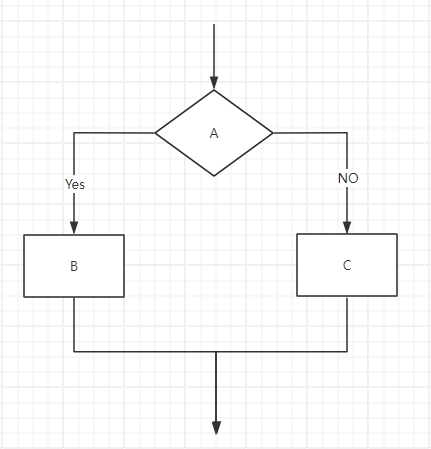
The selection structure is also called the conditional structure. It refers to a structure that judges the conditions in the process and selects different flow directions based on whether they are true or not. The selection structure includes binary selection structure and multiple selection structure.
1) Binary Choice Structure
This structure is suitable for situations where a selection or decision-making process is required, and then different processing flows are selected based on the selection or decision results. The judgment result can be described by [yes, no] [pass, fail] or other relative words to explain the processing process of different paths.
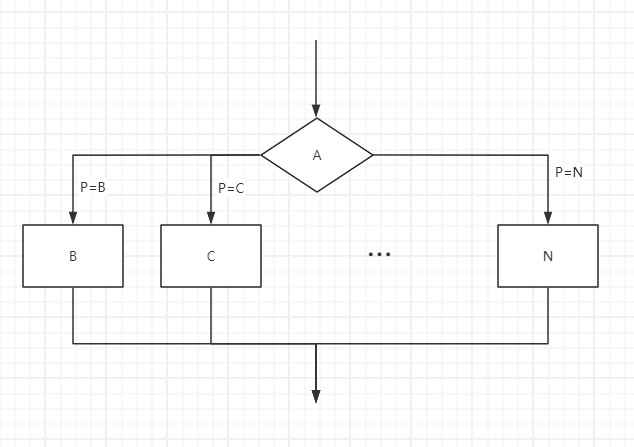
2) Multiple choice structure
This structure is a variation of the binary selection structure. The process selects a different processing flow based on the selection or decision result. The path name of the judgment result can use different words to explain the processing process of different paths.
The loop structure, also known as the repetition structure, is a structure that repeatedly executes a certain operation process under certain conditions; the loop structure includes the until type loop structure and the while type loop structure.
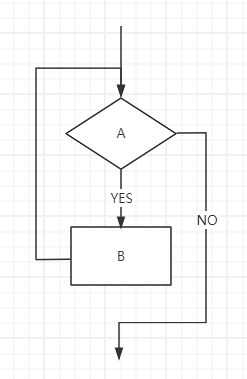
1) When loop structure
First determine whether the given condition A is met. If the condition is met, execute process B , and then determine whether the condition is met; if condition A is still met , execute process B again , and repeat this process until the condition is not met. This loop structure is called a while loop structure.
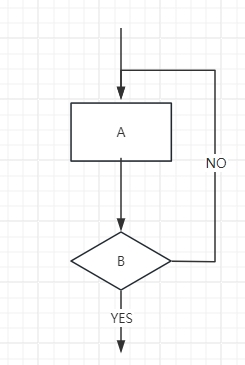
2) Until loop structure
First execute process B, and then determine whether the given condition A meets the conditions. If not, execute the loop body again, and repeat this process until the conditions are met. The loop process ends. This loop structure is called an until-type loop structure.
1. When drawing a flowchart, in order to ensure that the process is clear and logical, it should be arranged from left to right and from top to bottom;
2. When drawing a flowchart, use uniform and accurate graphic symbols, use concise and easy-to-understand text in the graphics, and write complex information in the notes;
3. When drawing a flowchart, use the start symbol as the starting point and the end symbol as the end point; the start symbol can only appear once in the flowchart, and the end symbol is unlimited;
4. Flow lines should not cross as much as possible. If they do cross, use crossover lines to distinguish the flow directions;
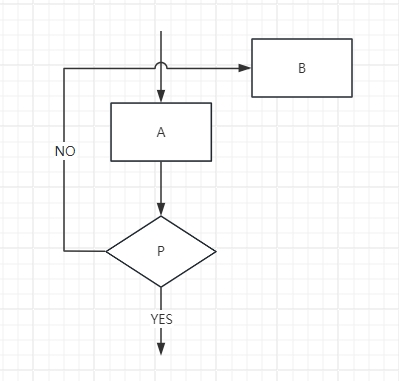
5. The processing element has a single inlet and a single outlet, and the judgment element has a single inlet and multiple outlets;
6. There is only one arrow pointing to the same path symbol.
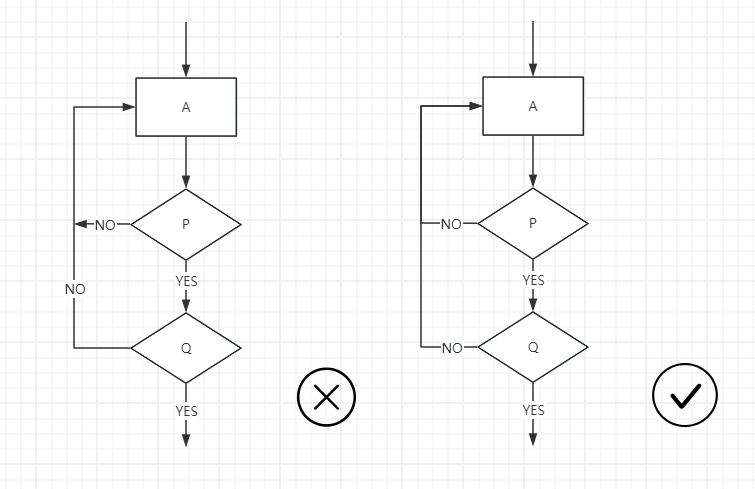
The application scenarios of SOP flow charts are very wide, covering almost all fields and industries that require standardized and standardized operations. Through the application of SOP flow charts, work efficiency and quality can be significantly improved, human errors and risks can be reduced, thereby promoting sustainable development in various fields. When drawing an SOP flow chart, a series of drawing specifications need to be followed to ensure that the flow chart is clear, accurate and easy to understand. I believe that after reading the above content, you have mastered how to draw a standard SOP flow chart.