In modern enterprise management, process optimization and management play a vital role. As a powerful visualization tool, the Process Flow Diagram (PFD) helps enterprises fully understand their production or service processes. Through the process flow diagram, enterprises can identify bottlenecks, optimize resource allocation, and improve overall efficiency. This article will introduce in detail how to use ProcessOn to sort out process flows and draw process flow diagrams, providing practical steps and tips to help enterprises maintain efficient operations in complex production processes.
What is a Process Flow Diagram?
A process flow diagram is a schematic diagram used to describe an industrial or business process. It graphically displays the various steps in the process, material flows, equipment usage, operating conditions, and the relationships between process units. Process flow diagrams can help engineers and managers design and optimize industrial processes and be used for employee training and operational guidance.
The Main Functions of a Process Flow Chart
- Visualization: Helps team members intuitively understand and track the entire process through graphical methods, thereby reducing communication errors.
- Analysis: By analyzing the flowchart, identify bottlenecks, redundant steps, and potential improvement points in the process.
- Optimization: Provides basic data and suggestions for process improvement to help companies improve efficiency and reduce costs.
Components of a Process Flow Diagram
- Step (Step Symbol): Represents each step in the process, usually represented by a rectangular box.
- Decision Point (Decision Symbol): Used to indicate a choice or judgment in a process, usually represented by a diamond symbol.
- Input/Output (Input-Output Symbol): Indicates the input or output of a process, usually represented by a parallelogram symbol.
- Connecting Lines (Arrows): Indicate the relationship between steps and the direction of the process.
- Document (Document Symbol): Represents the documents or records involved in the process, usually represented by a file-shaped symbol.
Key Points of Process Flow Chart Drawing - Determine the Overall Framework of the Process
The most important aspect of sorting out the production process is determining the overall framework. The overall framework includes the following aspects:
- Process Start and End Points: Determine the start and end points of the process, for example, from raw materials entering the warehouse to finished products leaving the warehouse.
- Main Process Links: Clarify the main links in the process flow, such as raw material inspection, processing, assembly, inspection, packaging, etc.
- Process Route: Determine the sequence and connection of each link in the process flow to form a complete process route map.
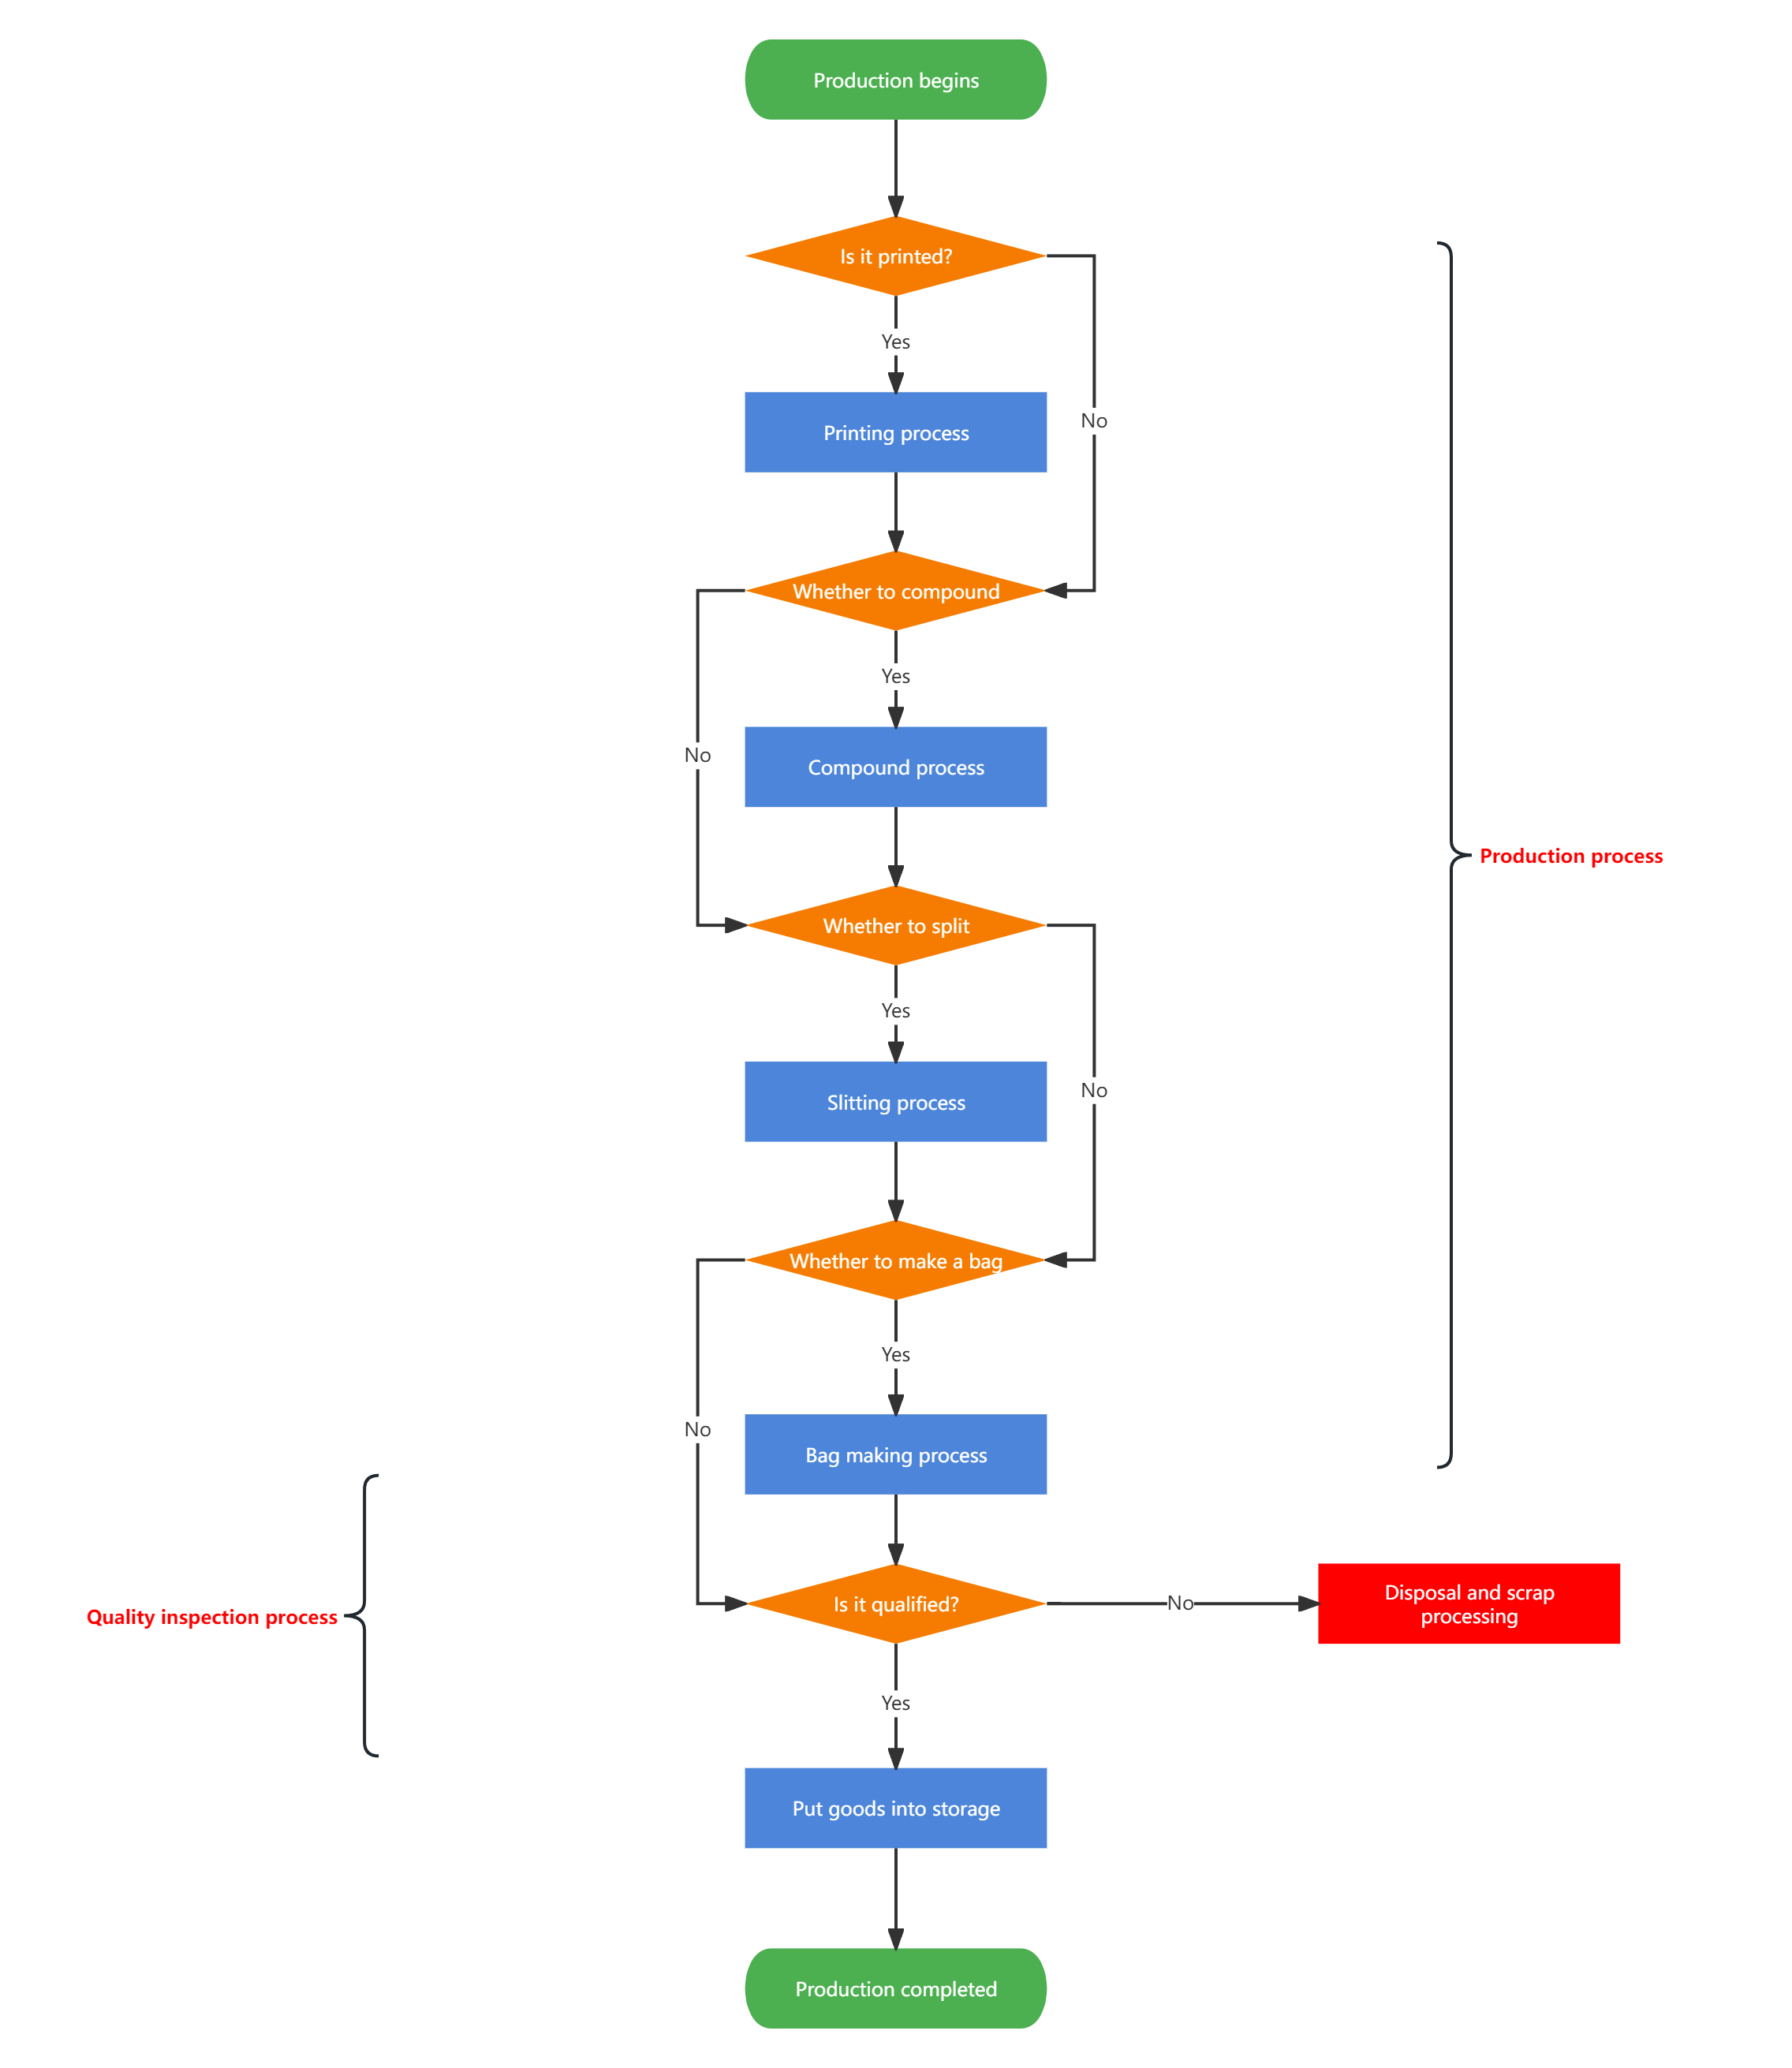
Production process flow chart
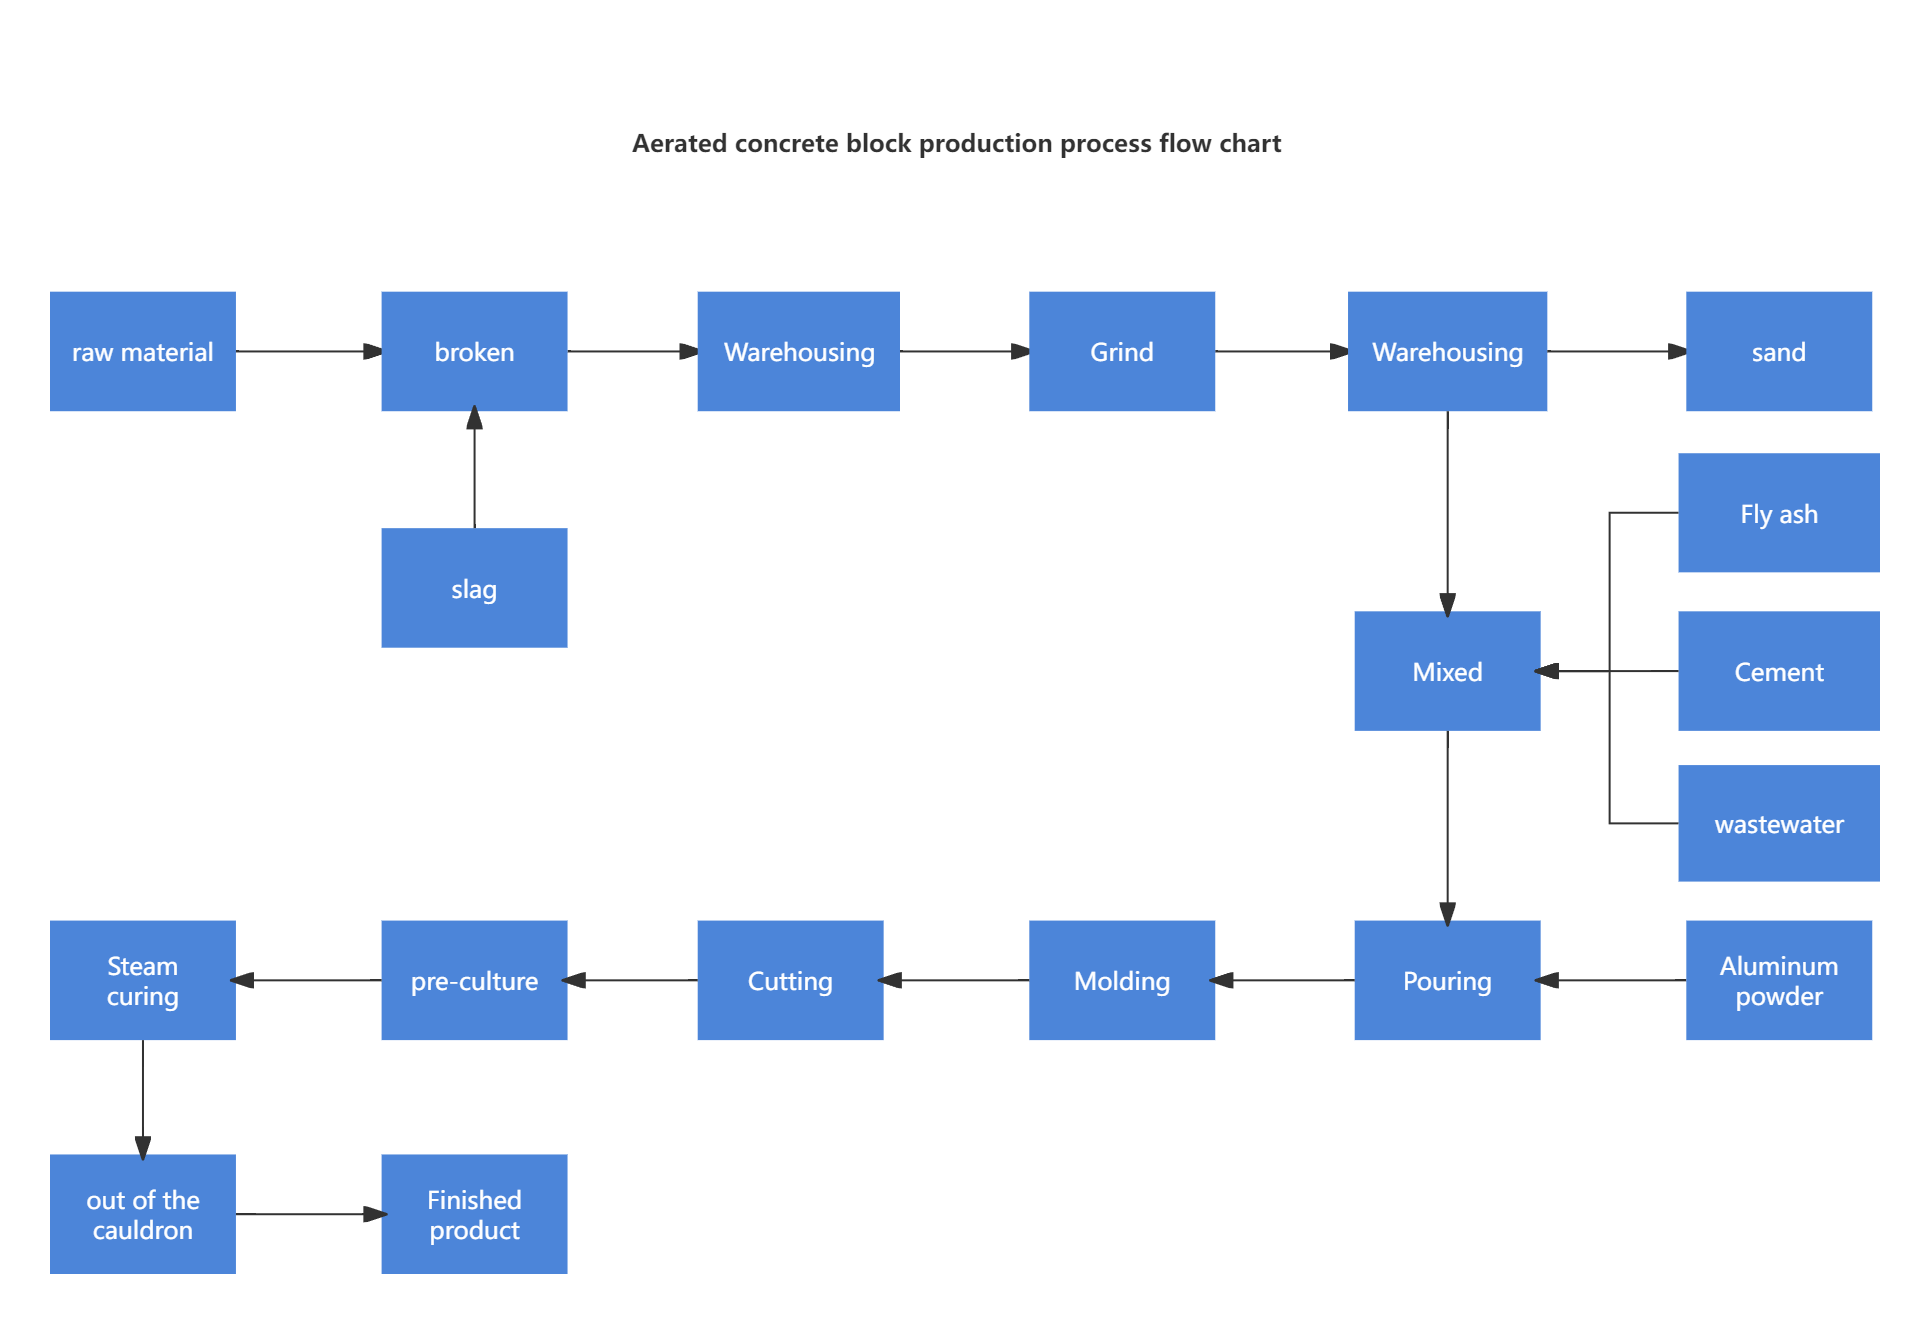
Aerated concrete block production process flow chart
Use ProcessOn to Sort Out Process Flows and Draw Process Flow Diagrams
The following are detailed steps to help you effectively use ProcessOn to draw process flow diagrams:
Step 1: Create an Account and Log In
1. Visit the ProcessOn official website and create an account. After completing the registration, log in with your account.

ProcessOn official website homepage
2. After logging in, click "Enter My Files" to enter your personal files page. Familiarize yourself with the various functions on the main interface to help you get started faster.

ProcessOn official website homepage
Step 2: Create a New Flowchart File
Method 1: On the personal file page, click the "New" button on the left and select "Flowchart."
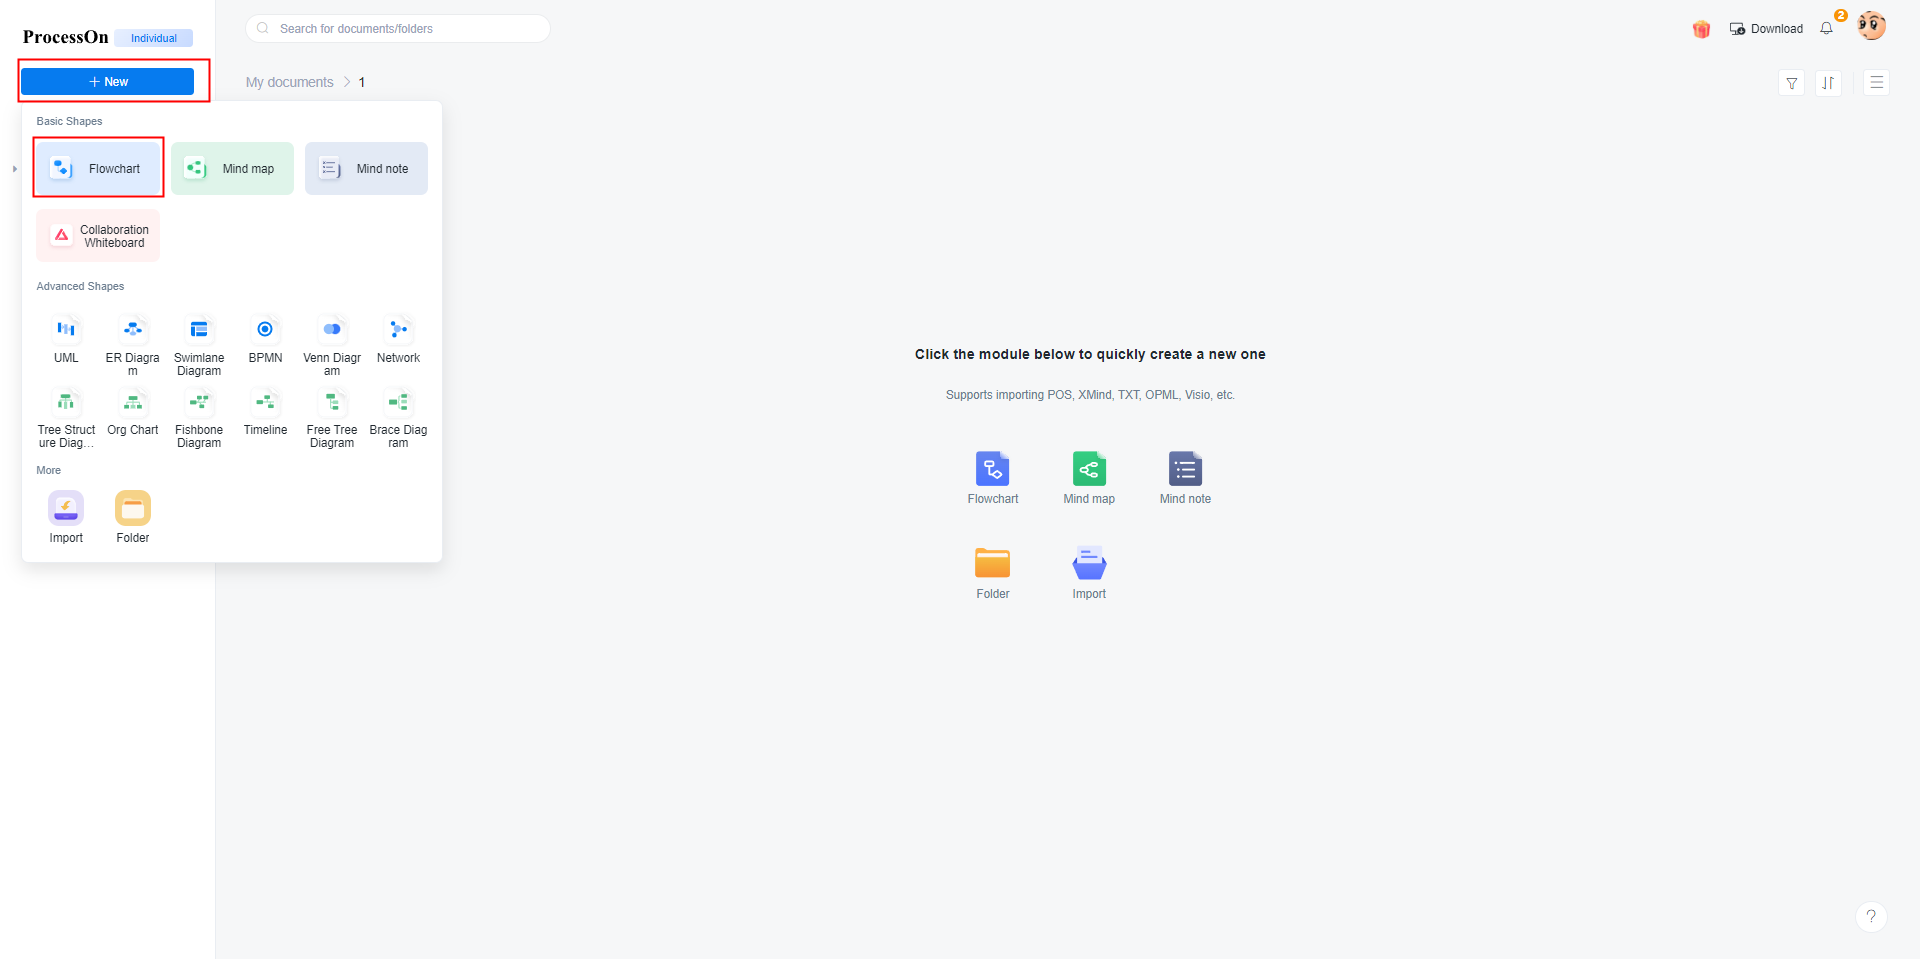
ProcessOn personal file page
Method 2: On the ProcessOn official website homepage, point your mouse to "Products" in the top navigation bar and select "Basic Flowchart" in the drop-down menu.
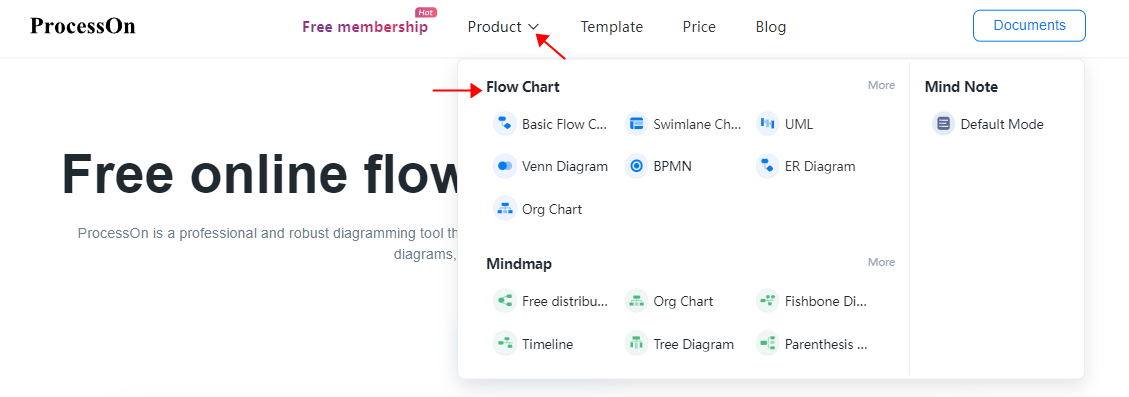
ProcessOn official website homepage
Method 3: Enter the ProcessOn template community and select a template that suits your needs. This will help you quickly start drawing process flow diagrams and ensure that best practices are followed.
Step 3: Add and Edit Flowchart Elements
1. Add Steps: Use the graphic elements (such as rectangles, circles, etc.) in the left toolbar to represent each step. Drag and drop these symbols into the drawing area and adjust the positions according to the actual process. Additionally, you can add more graphic elements by clicking the [More Graphics] button.
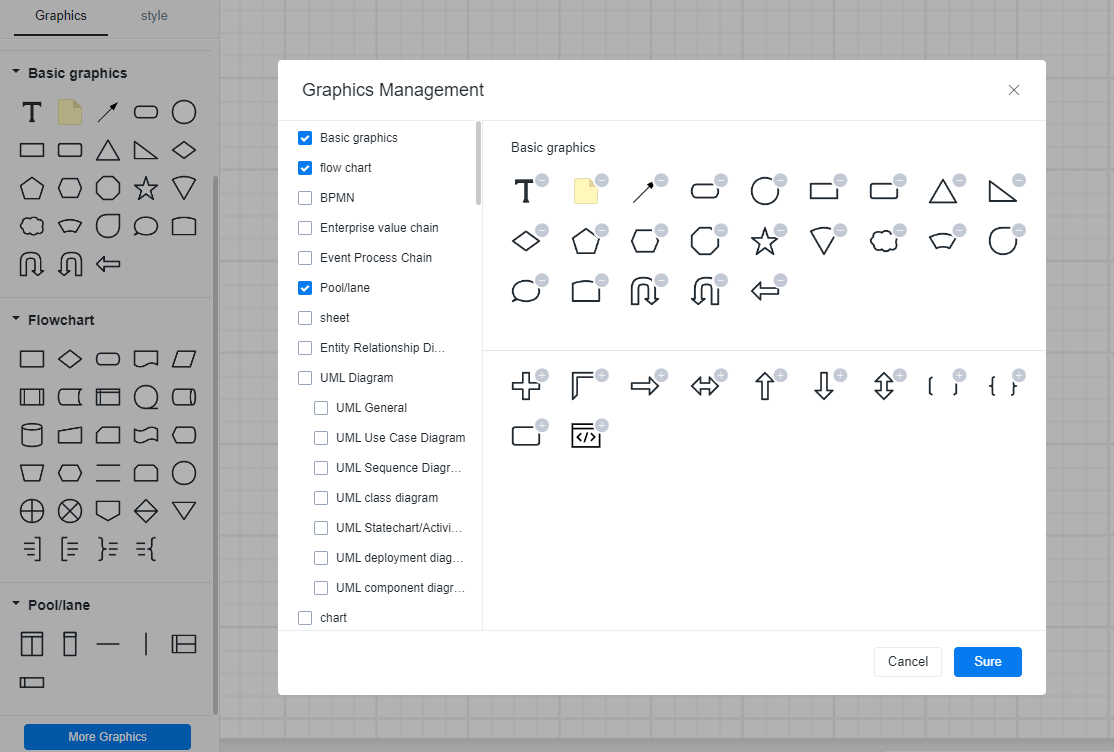
ProcessOn official graphic elements
2. Connect Steps: Use arrows or line tools to connect the steps to indicate the order and relationship of the process. ProcessOn's smart alignment feature can help you place and align graphics more accurately to keep the flowchart neat.
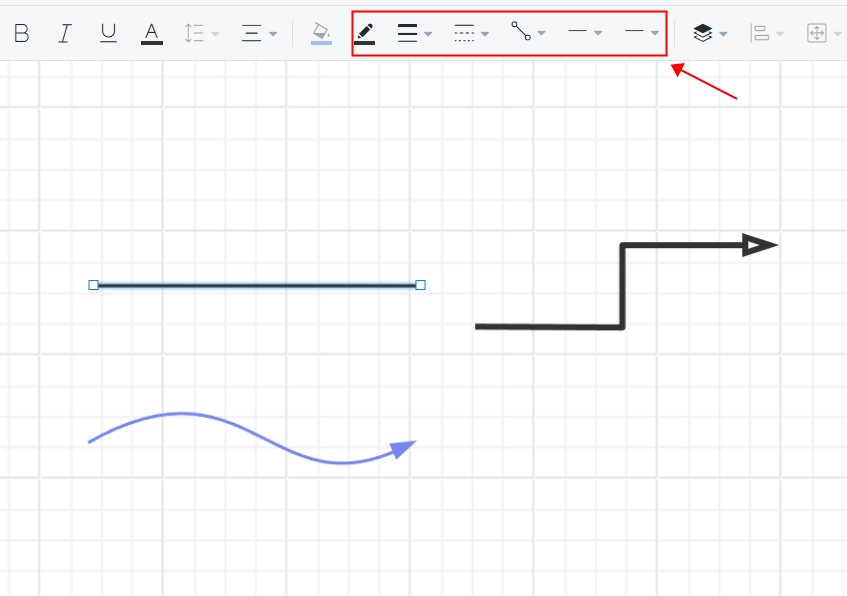
Set line style area in flow chart
3. Add Instructions: Add detailed text instructions for each step to explain the content and purpose of the step. Double-click the graphic symbol to directly enter text and modify the font, size, and color to make the information clearer.
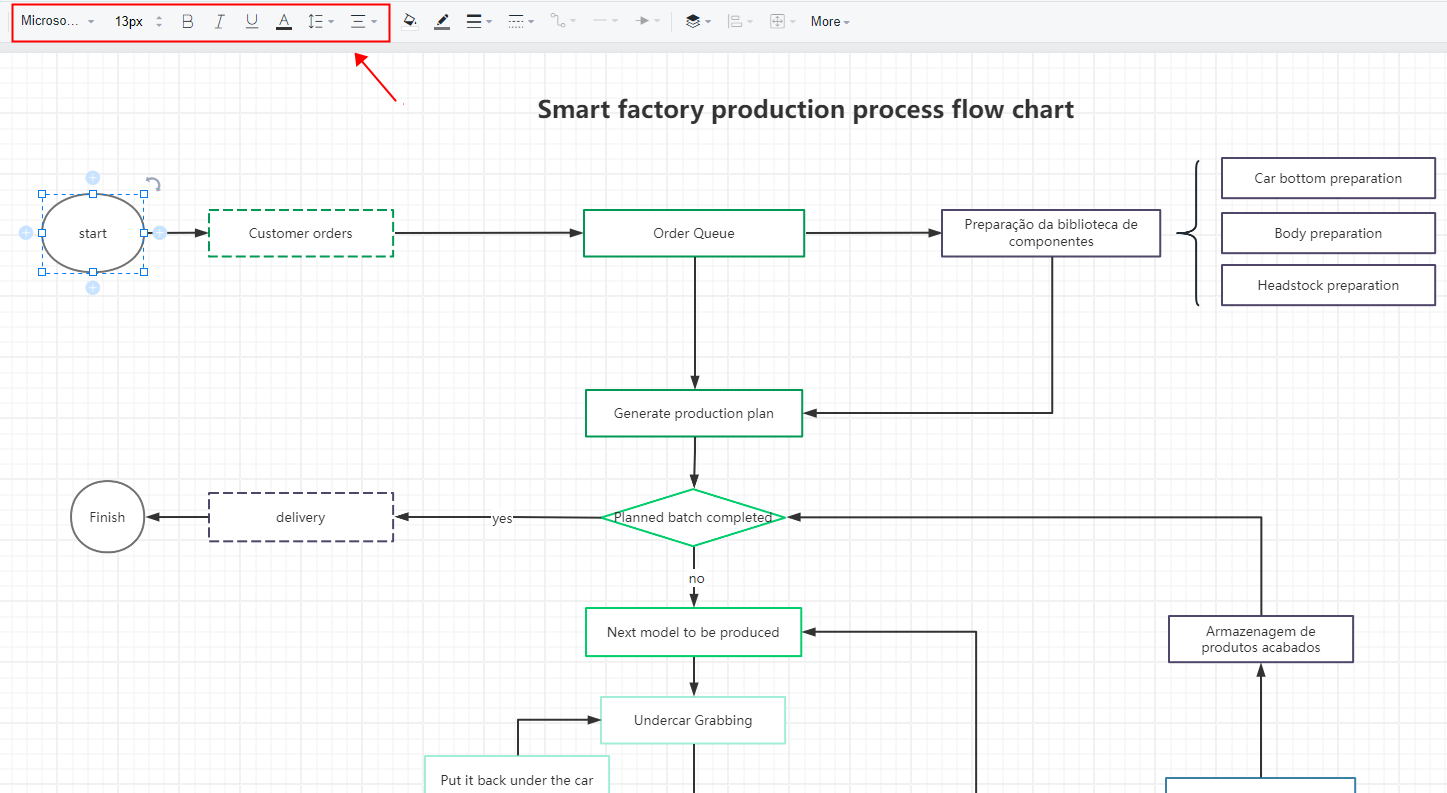
Set text style area in flow chart
Step 4: Set Up and Optimize the Flow Chart
- Adjust the Layout: Adjust the position and size of the graphics as needed to ensure that the flowchart is clear and easy to read. ProcessOn supports drag-and-drop operations, allowing you to quickly adjust the layout.
- Use Styles and Colors: To improve the readability of the diagram, you can use different colors and styles to distinguish different types of steps or links. Click the graphic symbol and select the style option to adjust it to enhance the visual effect of the diagram.
- Insert Additional Information: If needed, you can insert images, links, or attachments to provide more context or data support. This additional information can help you describe each aspect of the process more fully.
Step 5: Save and Share the Flowchart
- Save Flowcharts: During the drawing process, the flowchart will be automatically saved in your ProcessOn cloud account. You can access, modify, and update the saved flowcharts at any time to ensure that the diagram is always up to date.
- Export and Share: If you need to share the flowchart with team members or embed it in a report, you can select the "Export" function to export the graphic as a PDF, image, or other formats. You can also generate a sharing link to allow others to view or edit your flowchart, which is convenient for teamwork. Additionally, you can publish the flowchart to the template community to gain additional benefits.
Practical advice
- Keep It Simple: Avoid making your flowchart too complicated. Keeping the diagram simple helps improve readability and makes it easier for team members to understand the steps of the process.
- Regular Updates: As business processes change, update the flowchart in a timely manner to ensure that it reflects the latest operational processes. Regularly review and modify the flowchart to maintain the accuracy and effectiveness of the information.
- Teamwork: Make full use of the collaborative features of ProcessOn to edit and optimize flowcharts with team members. Through teamwork, you can get different perspectives and suggestions to improve the quality of flowcharts.
Conclusion
By learning how to use ProcessOn to draw process flow diagrams, companies can significantly improve process transparency and efficiency. Process flow diagrams not only help team members better understand and track production processes, but also provide basic data and suggestions for process optimization. Practicing these steps will help you better understand the production process and make effective optimization decisions. I hope these steps and suggestions can help you effectively use ProcessOn to achieve comprehensive optimization of your process.
Supplementary Knowledge: Process Flow Diagram (PFD) and Piping and Instrumentation Diagram (PID)
Process Flow Diagram (PFD) and Piping and Instrumentation Diagram (PID) are two different types of process flow diagrams. PFD is mainly used to represent the flow of the entire production process, while PID focuses more on showing the detailed layout and connection of the piping system and instruments. Although the two differ in details, they are both important visual graphics used to represent the process of industrial products from raw materials to final products.
- PFD (Process Flow Diagram): Focuses on the flow of the entire production process and expresses the work completed by the product through some or all stages of the process in the form of diagram symbols. It provides an overview to help understand the general direction and main steps of the entire production process.
- PID (Piping and Instrumentation Diagram): Shows the layout of the piping system and instruments and the connections between them in more detail. It includes details such as pipe number, pipe diameter, medium name, and connection details inside and outside the device, such as the location and specifications of valves and other pipe fittings. PID is usually used to specifically guide and regulate actual operations to ensure the accuracy of production and installation.
Therefore, the choice of using PFD or PID depends on specific needs and purposes: if a comprehensive overview of the production process is required, PFD may be chosen; while if detailed planning and guidance of specific piping and instrument installation is required, PID may be chosen.
ProcessOn supports online editing of flowcharts, mind maps, prototypes, UML, network topology diagrams, etc. Users can create new content from scratch or easily edit and modify existing drawing frameworks and case templates. The operation is simple and easy to use.


