Mind maps can restore the brain's thinking process and are conducive to divergent expression and thinking. There are many types of mind maps. Choose the appropriate structure type according to the level of thinking to express complex knowledge points or ideas. Different mind maps are suitable for different scenarios.
Today, taking ProcessOn mind mapping as an example, I will introduce to you the 14 most common structures of mind mapping!
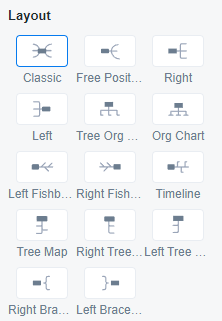
ProcessOn mind map structure classification
A balance diagram is a special mind map structure. The difference is that the themes of a balance diagram are evenly distributed from right to left, and the distribution of themes at both ends reaches a symmetrical state.
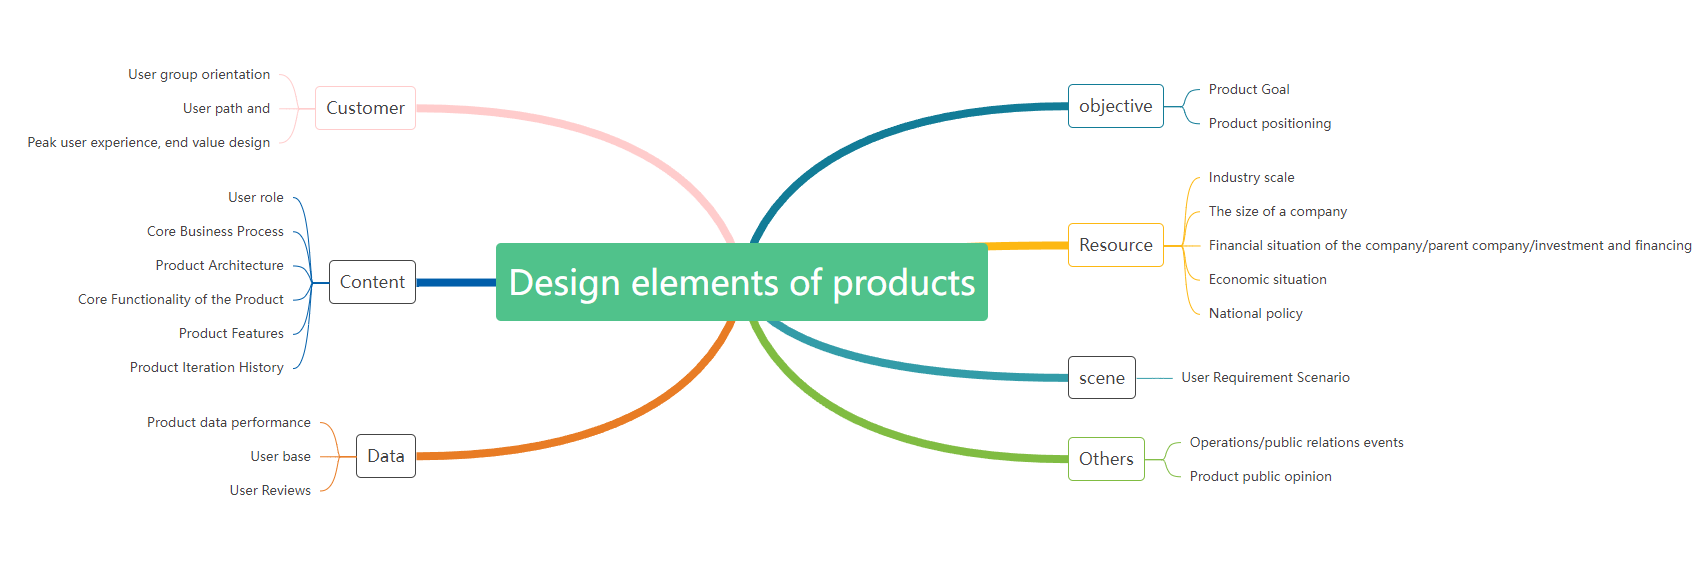
Product design elements (left and right distribution) mind map
At first glance, the free distribution mind map looks very similar to the left and right distribution mind map. The difference is that in the free distribution structure, topics and nodes can be dragged at will.
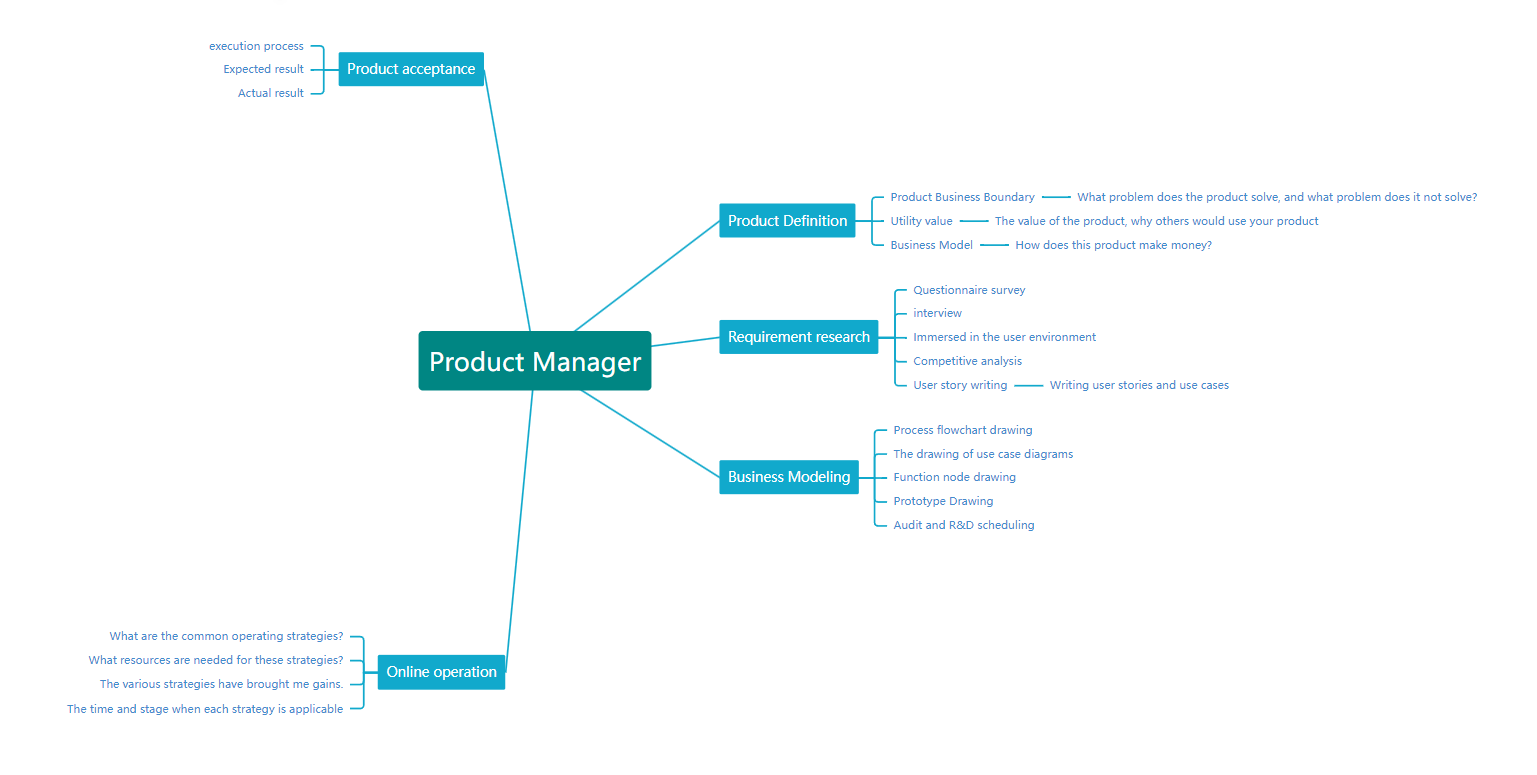
The branches of the right-side distributed mind map are all uniformly directed to the right, which is a very common form of mind map.

The branches of the left-side distribution mind map are all uniformly directed to the left, which is also a very common form of mind map.
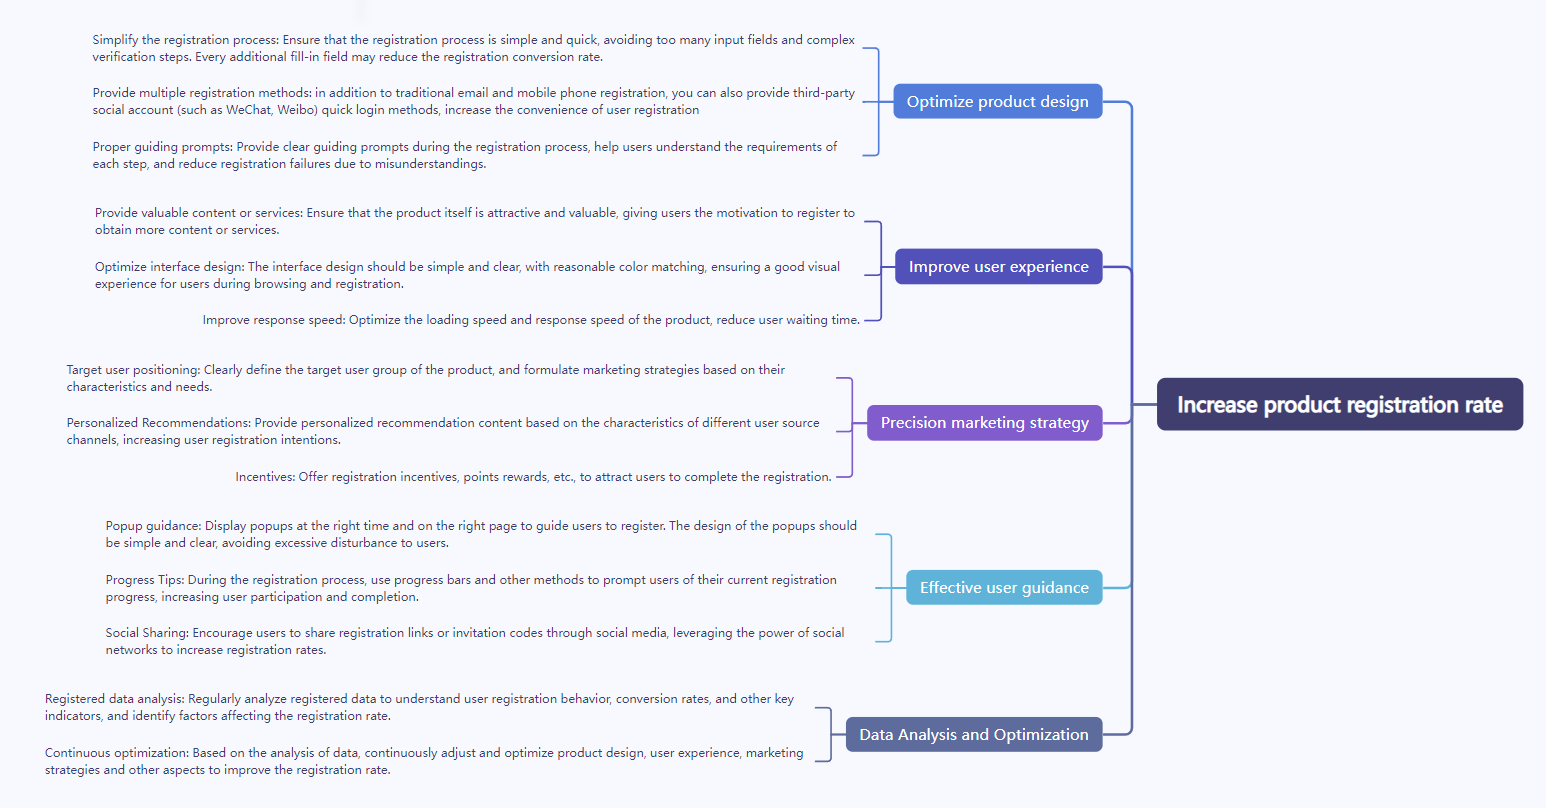
Increase product registration rate
The appearance of a tree structure diagram is similar to that of a tree branch, and its structure is an upper and lower layer organization of objects.

The organizational chart is a direct reflection of the organizational structure, and its most common use scenario is to sort out the company's organizational structure system.
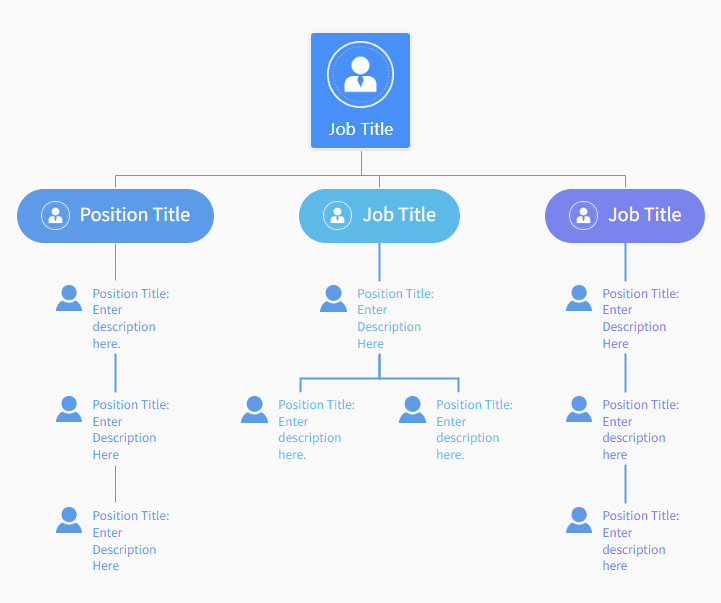
ProcessOn supports online editing of flowcharts, mind maps, Gantt charts, prototypes, UML, network topology diagrams, and other graphics. Users can create new content from scratch, or easily edit and modify existing drawing frameworks and case templates. The operation is simple and easy to use.
The fishbone diagram was invented by Japanese management guru Kaoru Ishikawa as a method to find the "root cause" of a problem. It is also called a cause-and-effect analysis diagram or an Ishikawa diagram. It is simple, practical, in-depth and intuitive. The left-side fishbone diagram is also called a countermeasure fishbone diagram (the fish head is on the left), which is mainly used to solve problems.
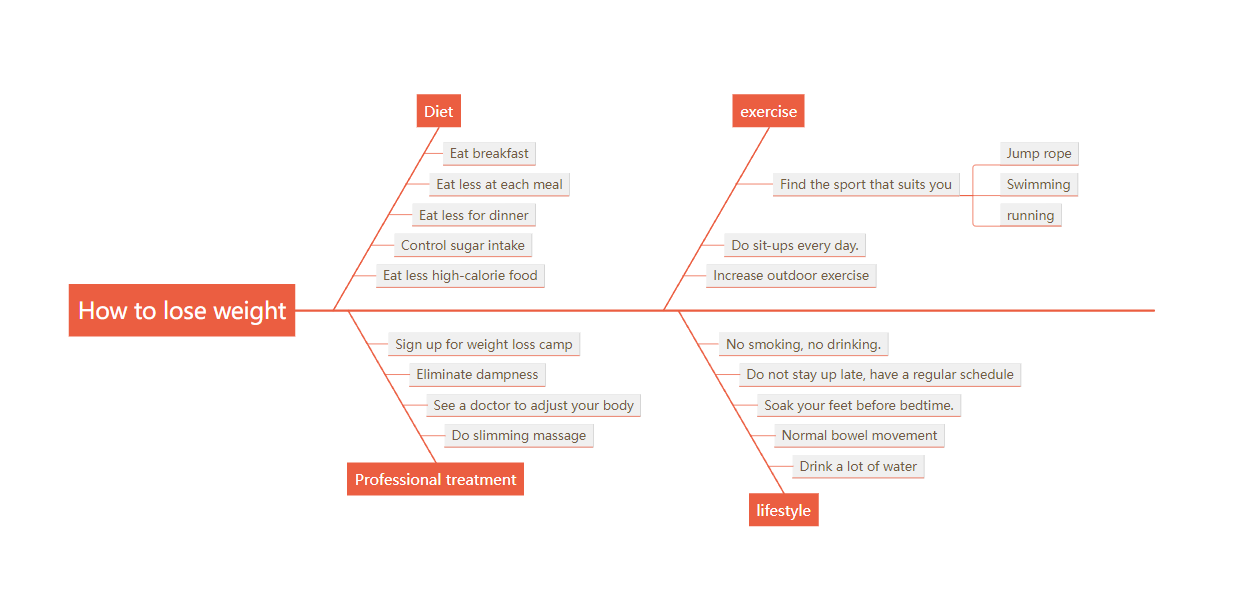
How to lose weight (left side) fishbone diagram
The fishbone diagram on the right is also called the causal fishbone diagram (the fish head is on the left), which is mainly used to analyze problems.

Enterprise development analysis (right side) fishbone diagram
A timeline diagram is a diagram that sorts events in chronological order, connects one or more aspects of the event together, and records them together in a straight line.

Pre-job training process timeline
A tree diagram is a way to represent a hierarchy through a tree-like structure. As the name suggests, it is like a tree. The theme is the trunk, the categories are the branches, and the categories are the leaves. Every branch theme from the trunk to the upper right or lower right affects the subsequent result formation.
If all topics are distributed on the left and right, it is a normal tree diagram. If all topics are on the right, it is called a right-side tree diagram, otherwise it is called a left-side tree diagram.
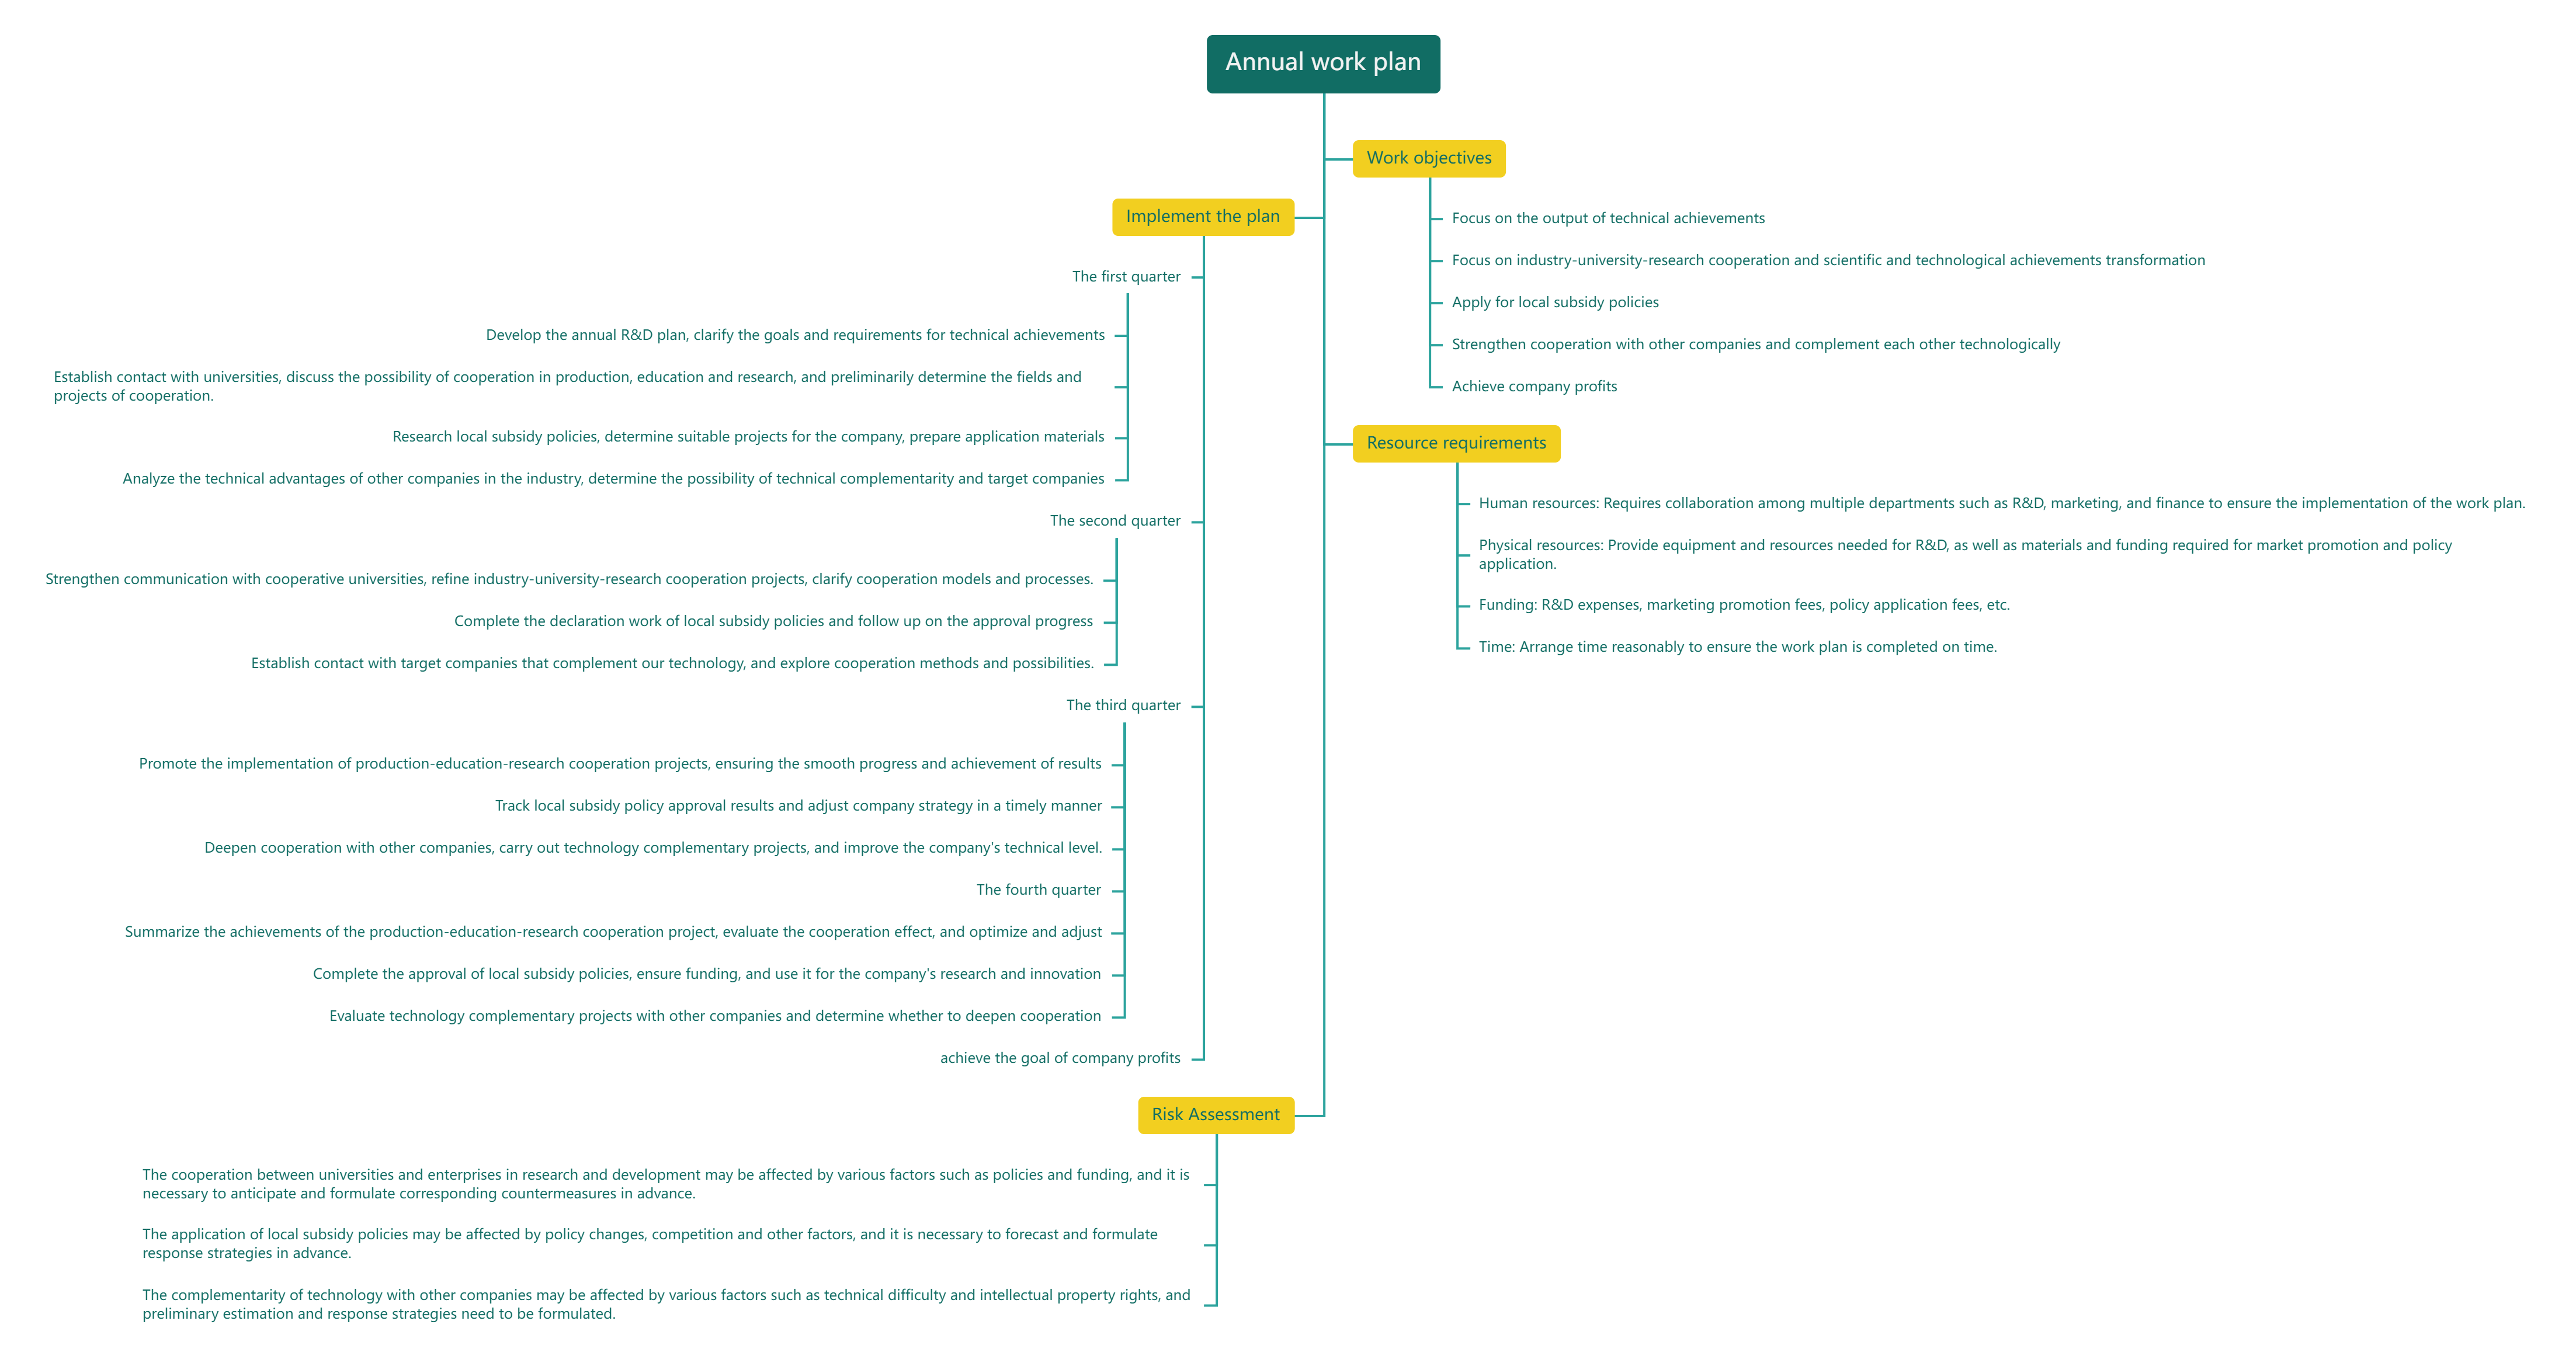
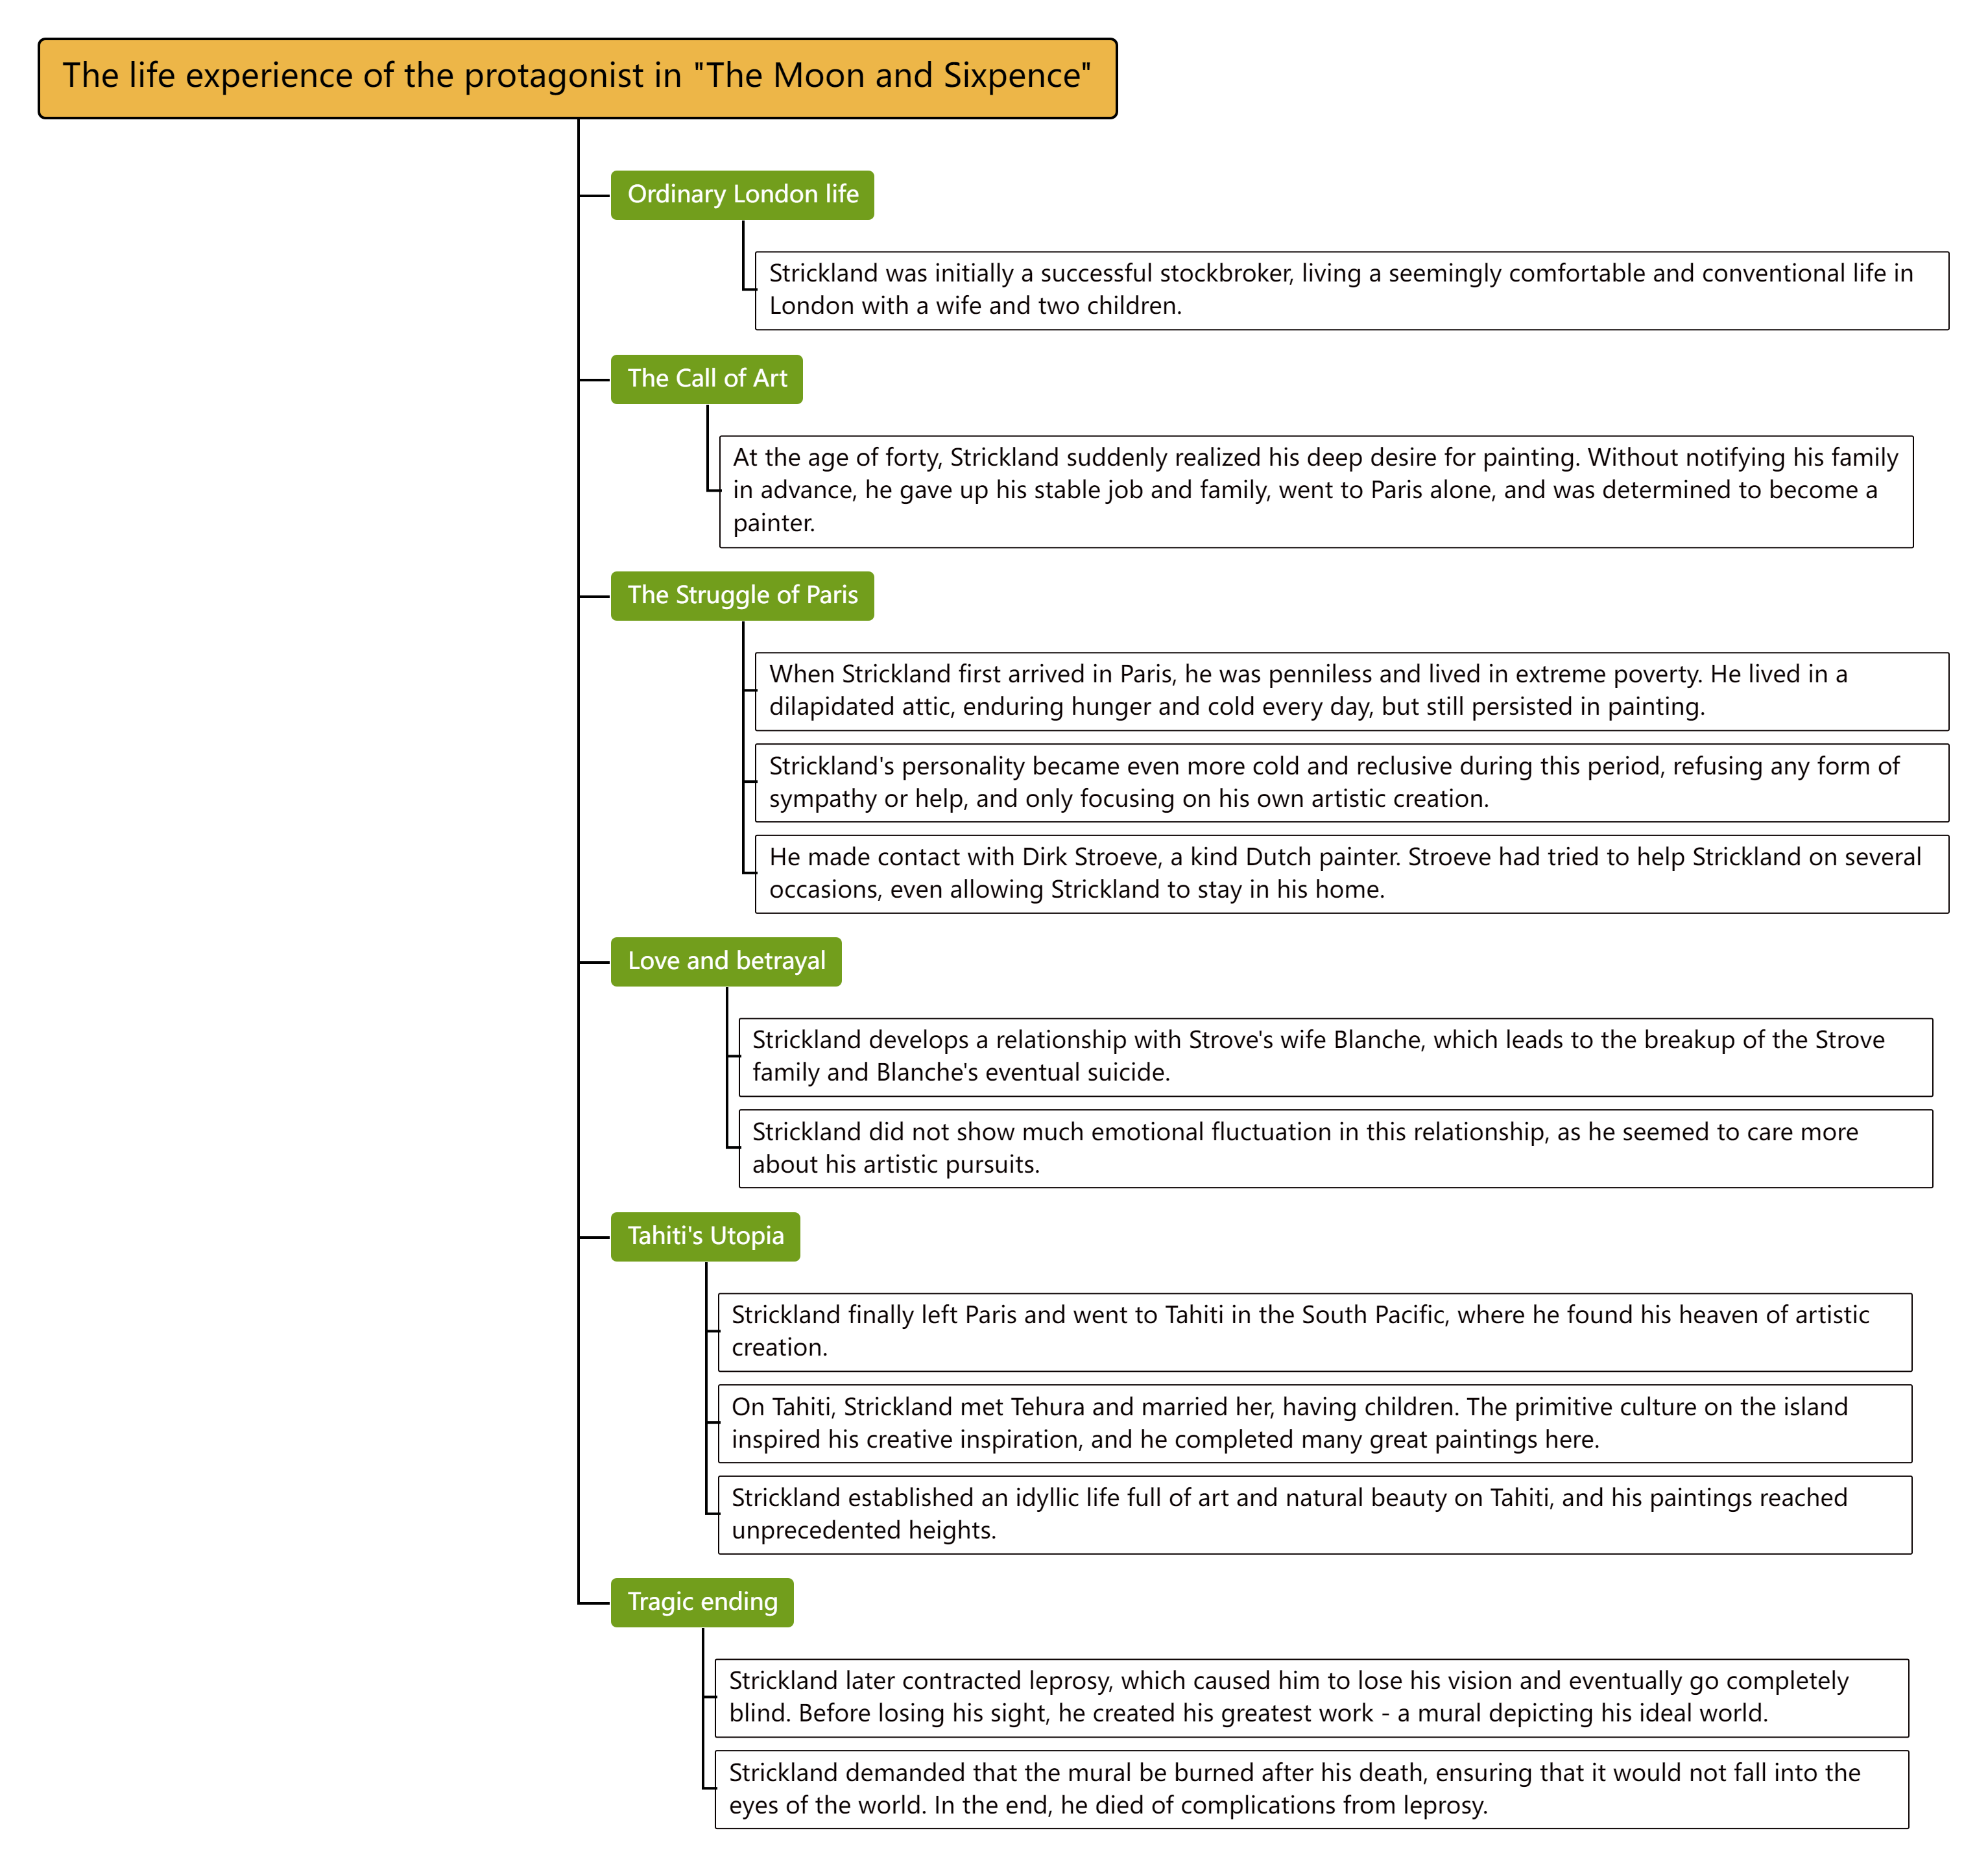
The life experience of the protagonist of "The Moon and Sixpence"
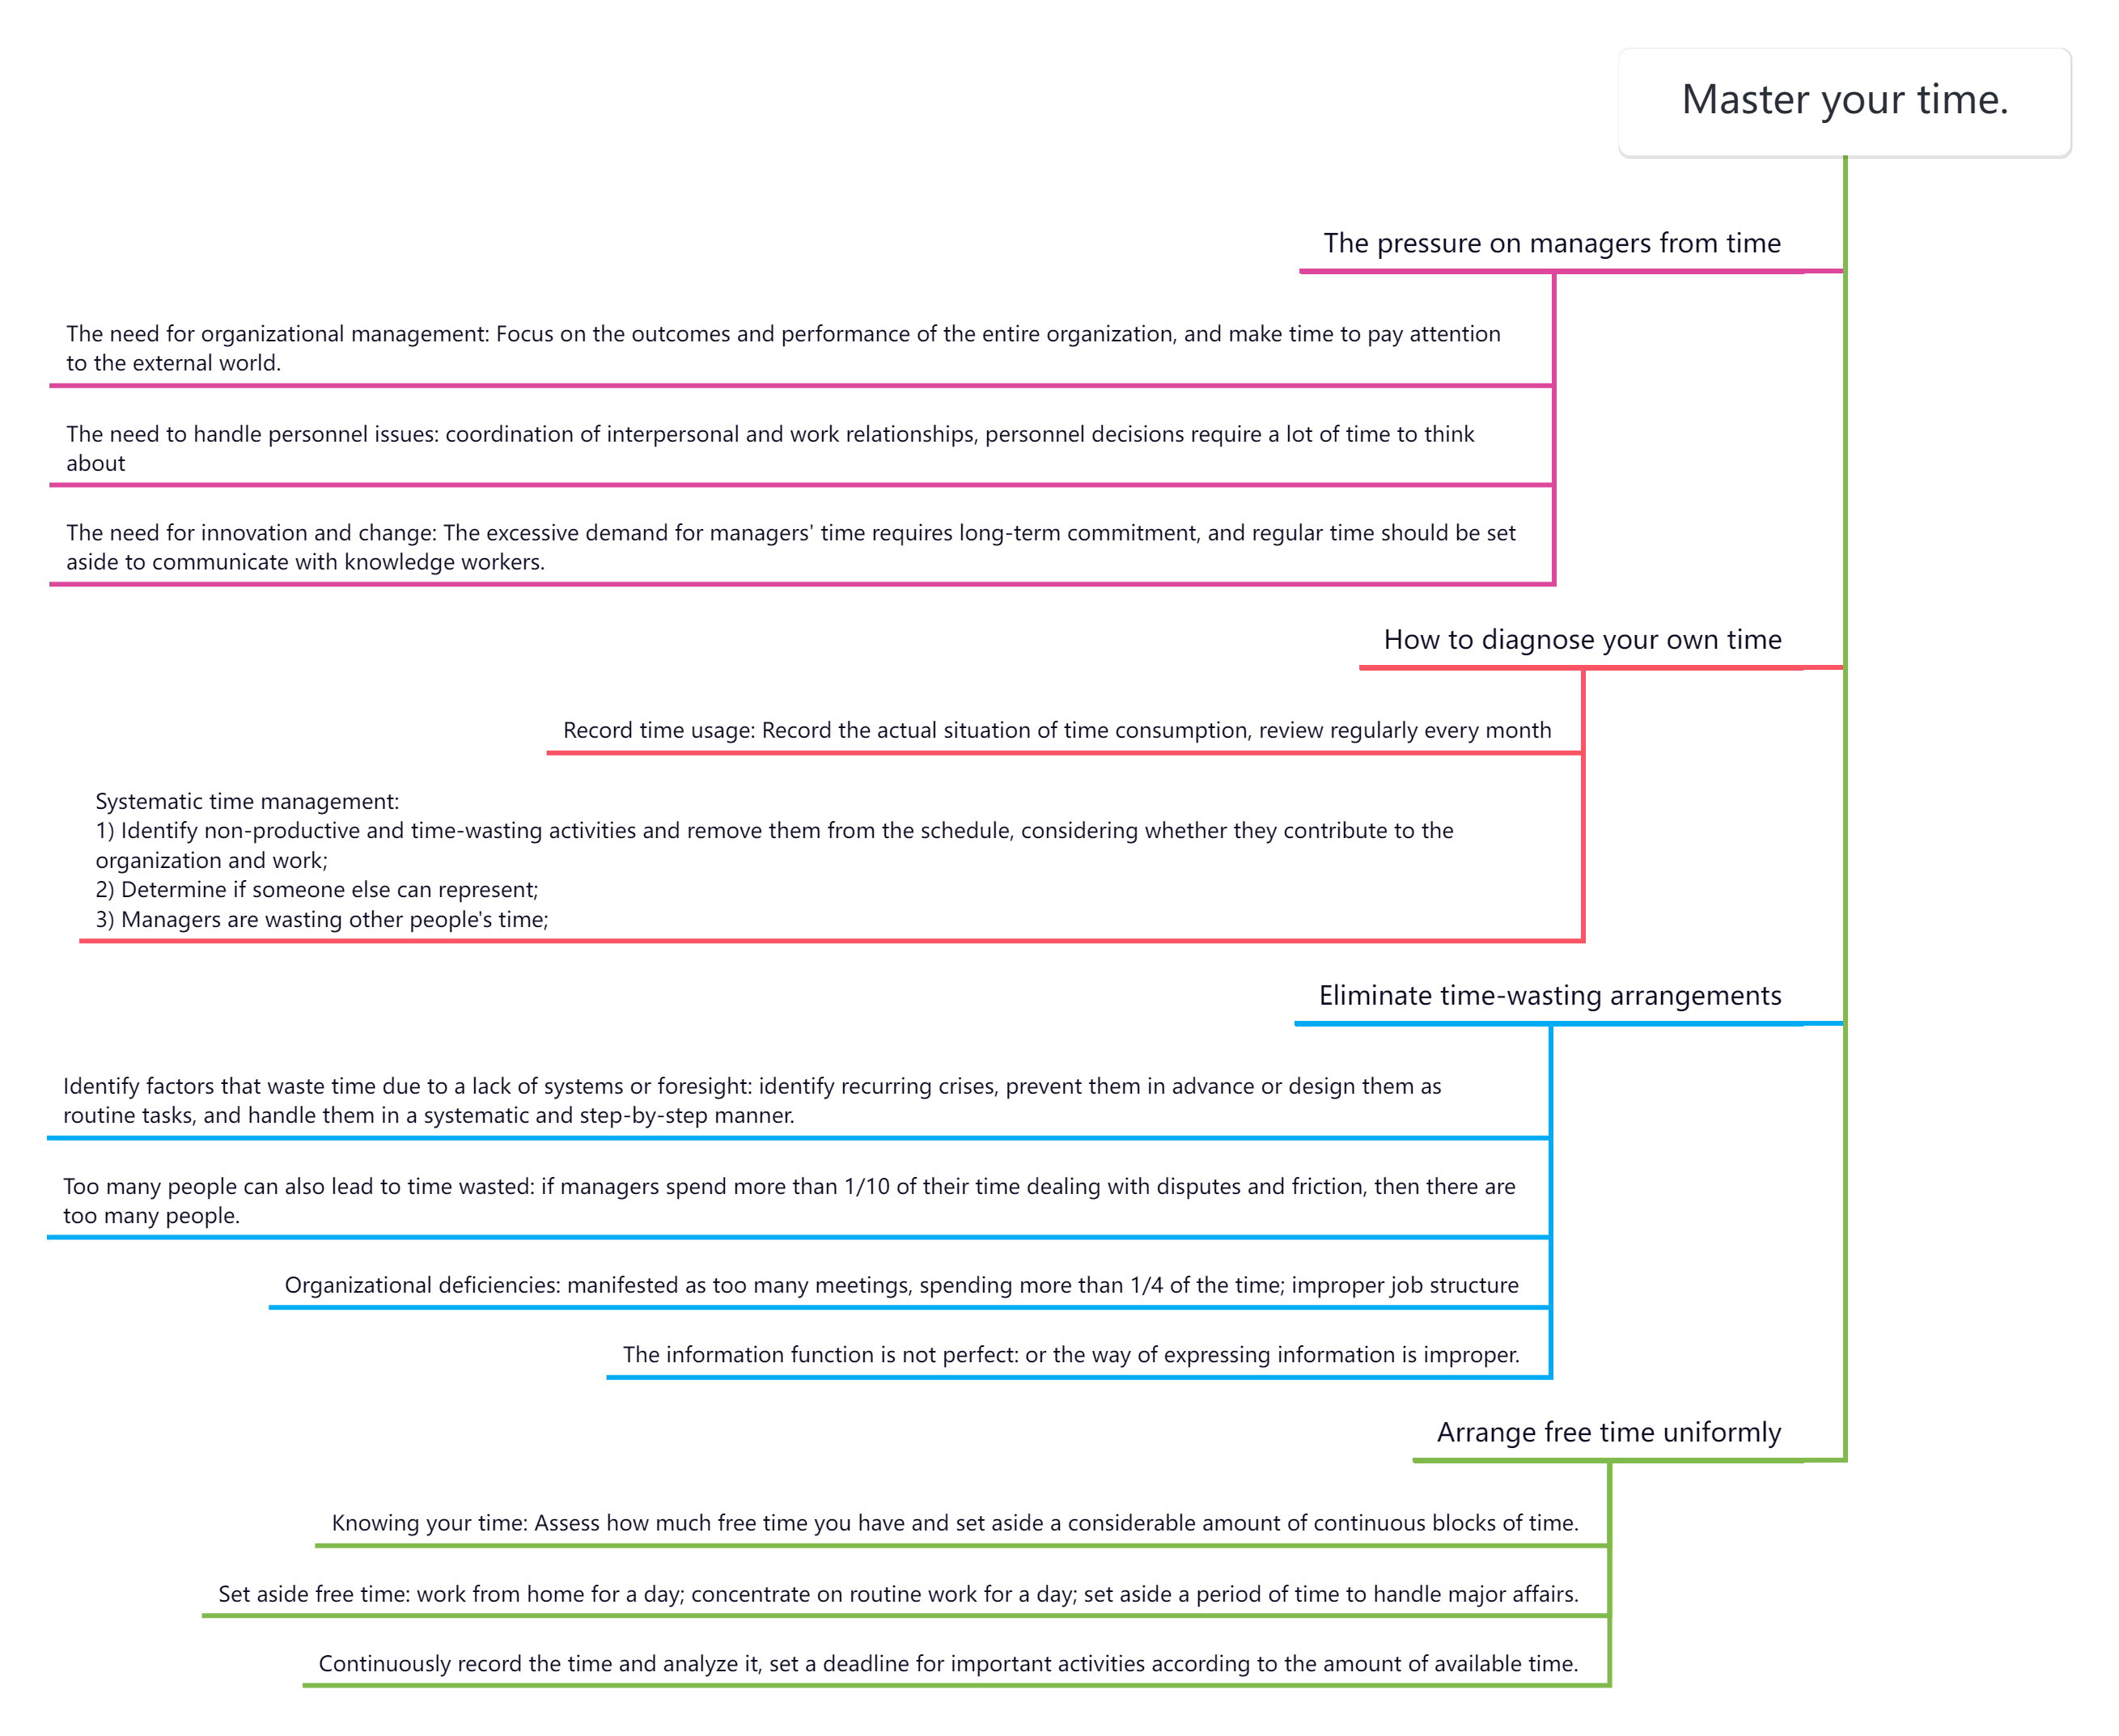
The bracket diagram can be used to decompose the structure of things. It is often used to analyze the relationship between the whole and the part. However, it should be noted that it should not be used for abstract things, such as a concept or idea, because these things cannot be separated physically.
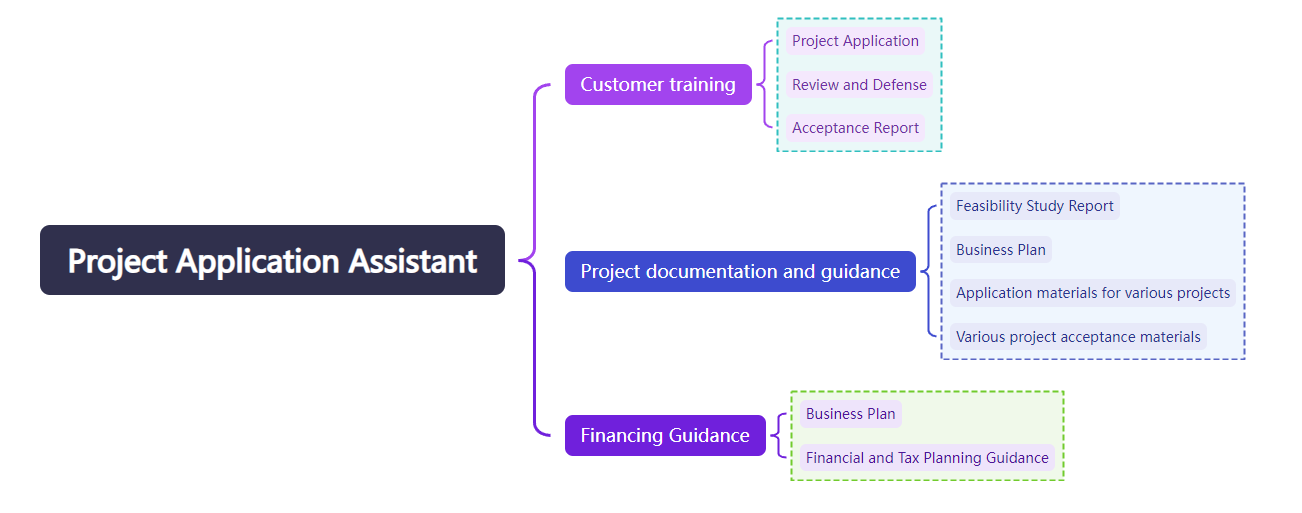
Project Application Assistant Responsibilities Bracket Chart
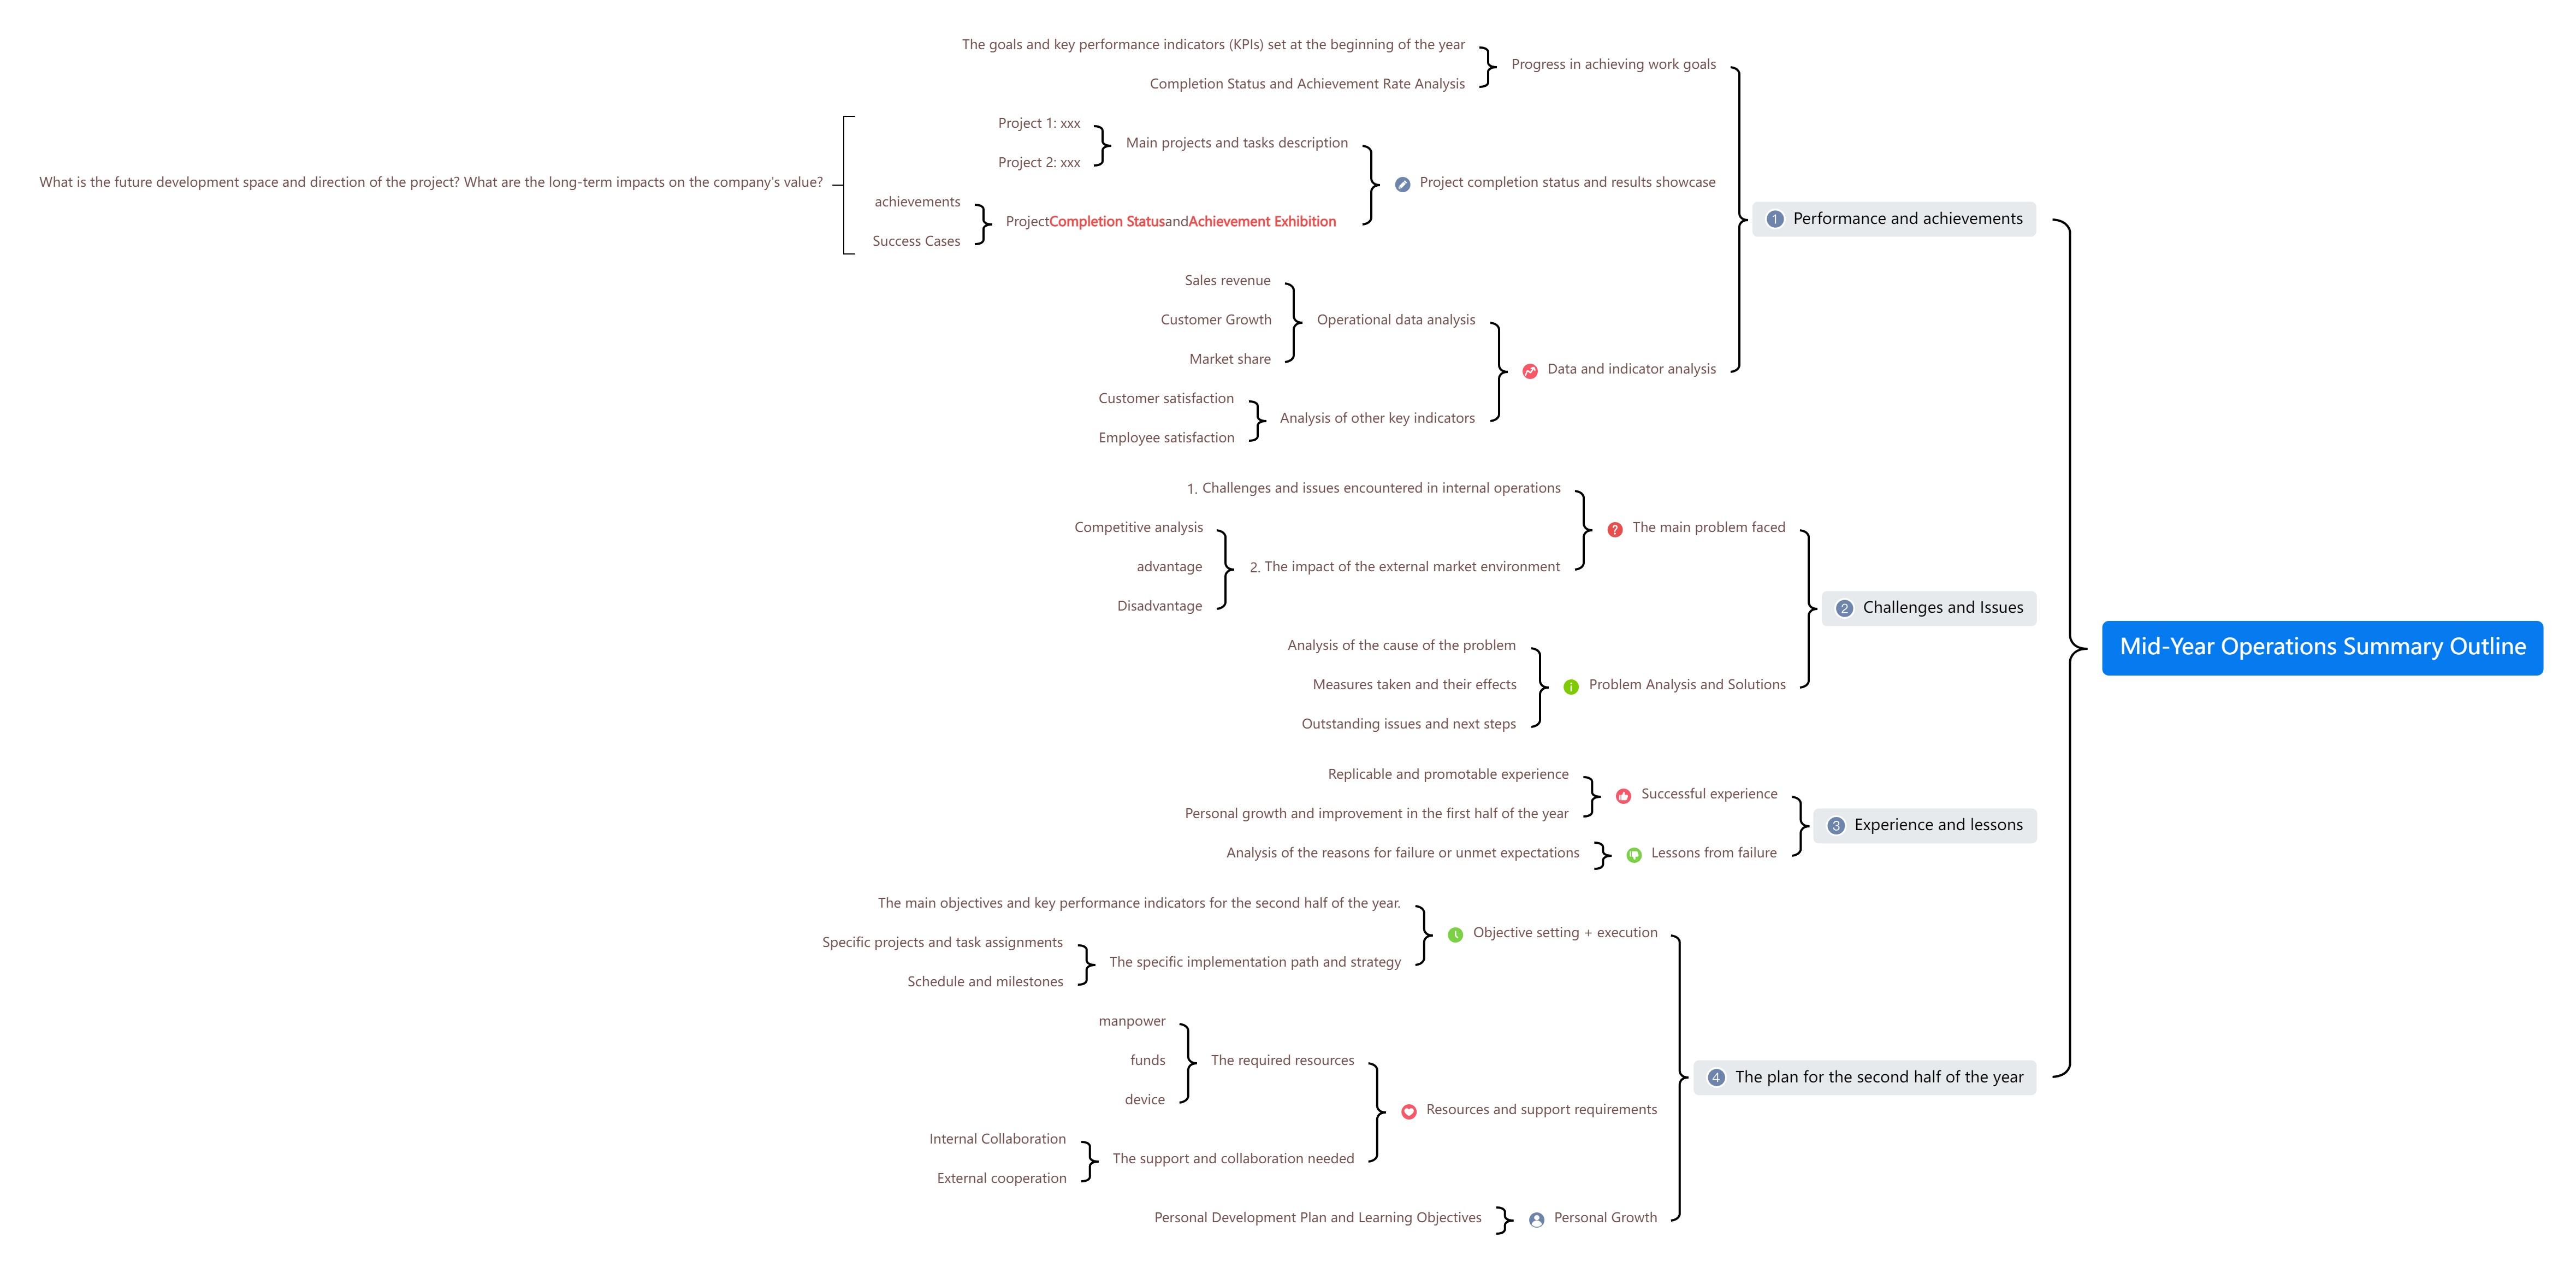
The above are 14 common structures of mind maps. Come and create your own using ProcessOn mind map .