

Venn Diagram, is a relationship diagram used to show the overlapping areas of sets, and is often used in mathematics, statistics, logic and other fields. Through the overlapping of graphics (usually circles or ovals), Venn diagrams represent the intersection relationship between sets, or the possibility of intersection between different sets.
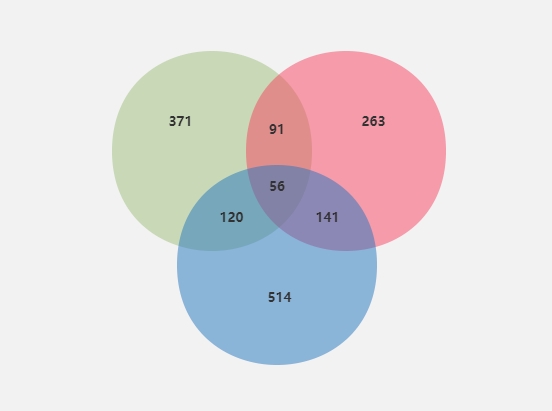
Venn diagram of the relationship between three sets of numbers
In fact, we all know the principle of Venn diagram. In high school, we learned the relationship between two sets A and B. The Venn diagram is a diagram used to display the overlapping areas of element sets.
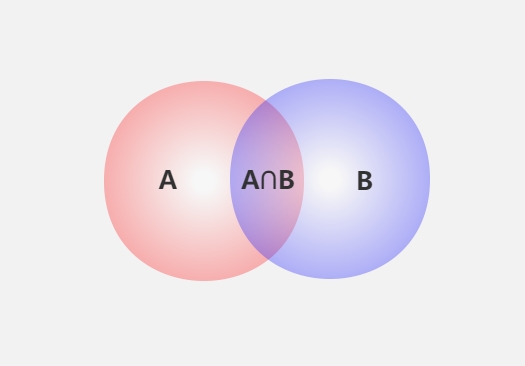
A∩B
Sheldon in the American TV series "The Big Bang Theory" also used a Venn diagram to display the couples he and Amy liked respectively, and at the same time find the common points they liked.

Sheldon draws Venn diagram in The Big Bang Theory
So how do we draw a Venn diagram? Today, I will teach you how to draw a Venn diagram using ProcessOn. You no longer have to study the complex functions of Word.
The main elements of a Venn diagram are circles, intersections, and logical expressions . There are four steps to making a Venn diagram:
Step 1: Create a new flowchart and add a Venn diagram element to the more graphics in the lower left corner .
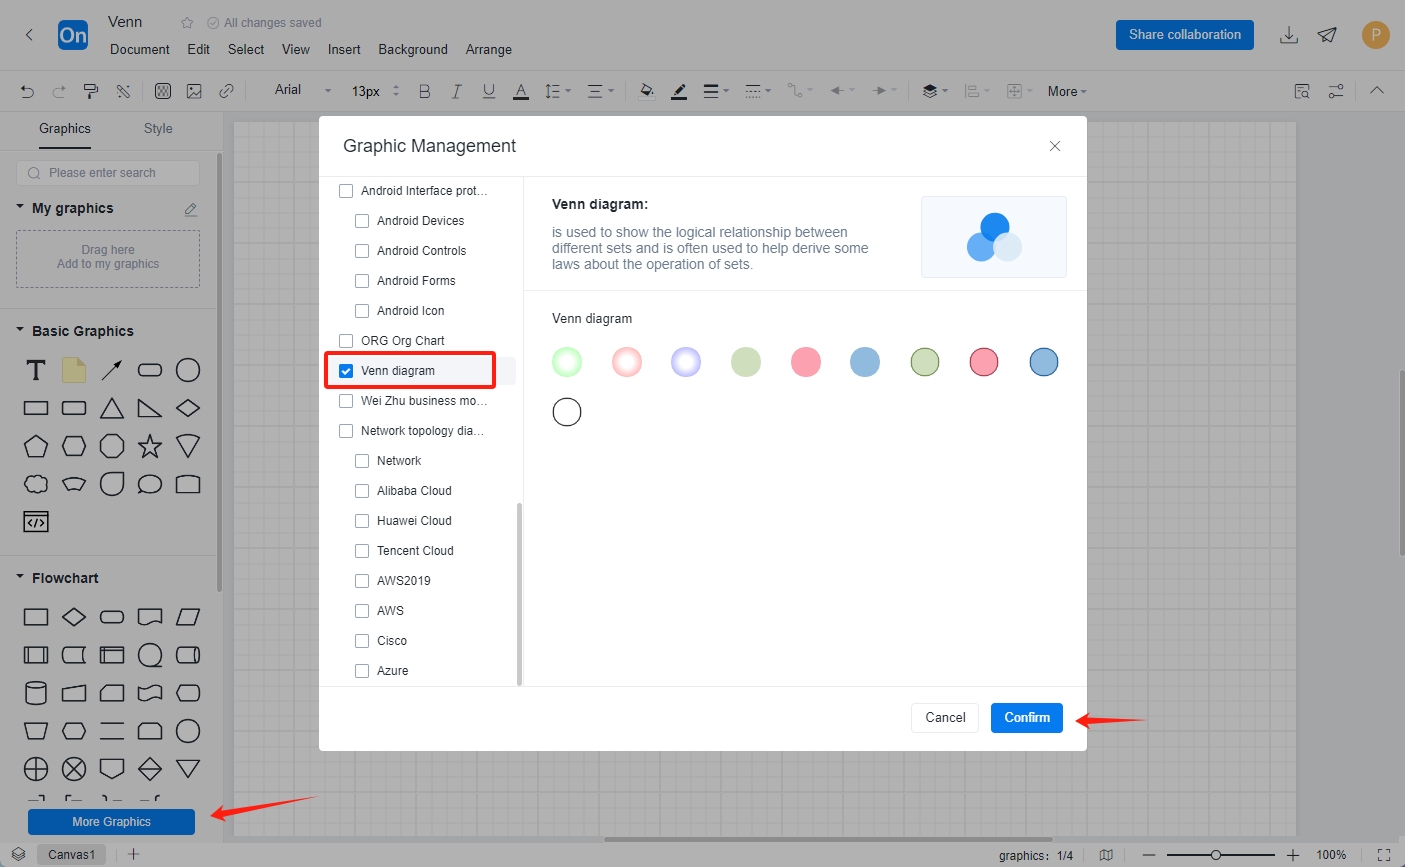
Step 1 - Adding Venn Diagram Elements
Step 2: Drag the circle to the canvas and adjust the size of the circle according to the size of the collection .
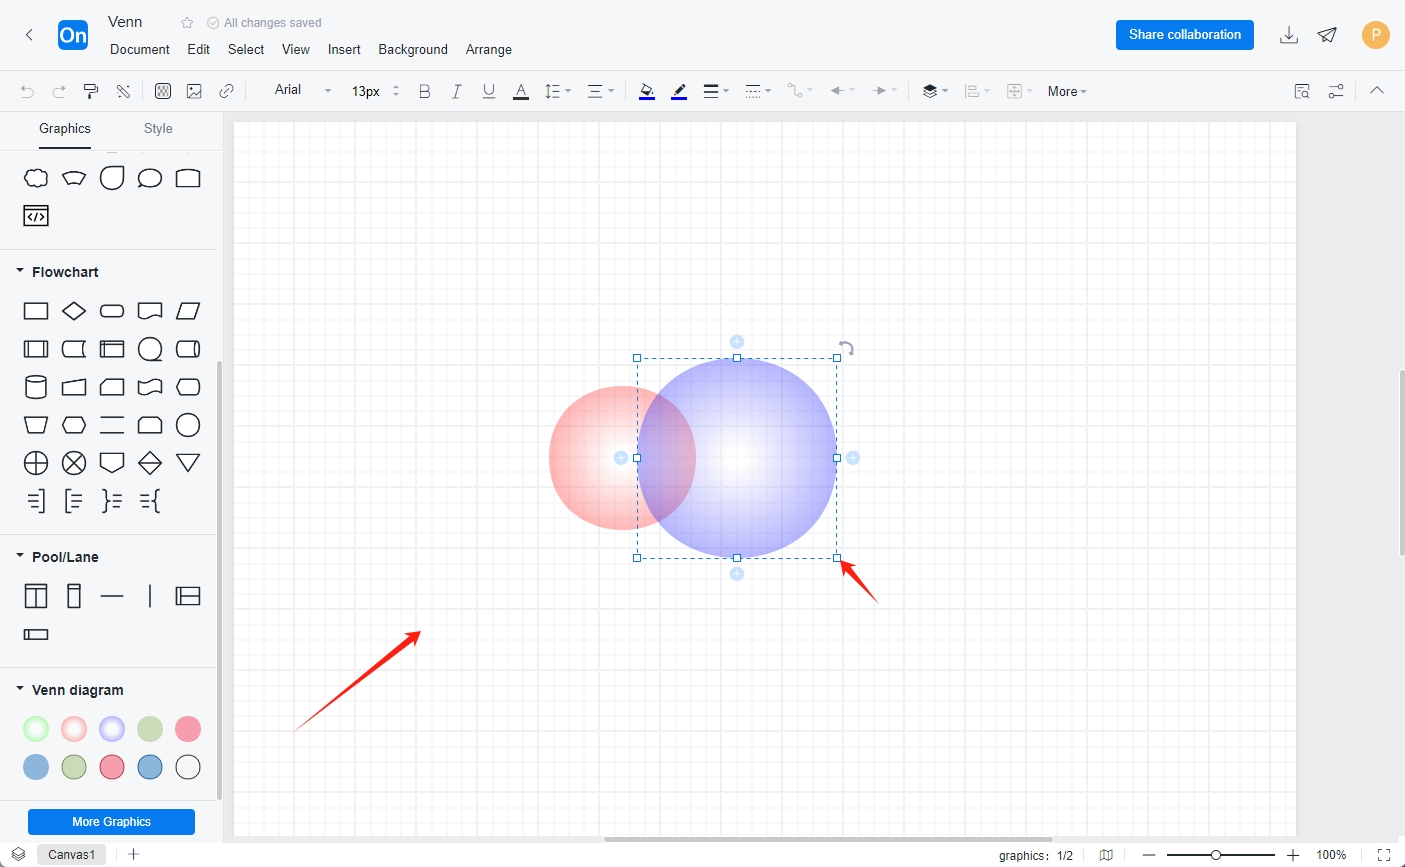
Step 2 - Drag elements to the canvas
Step 3: Mark the content and analyze it .
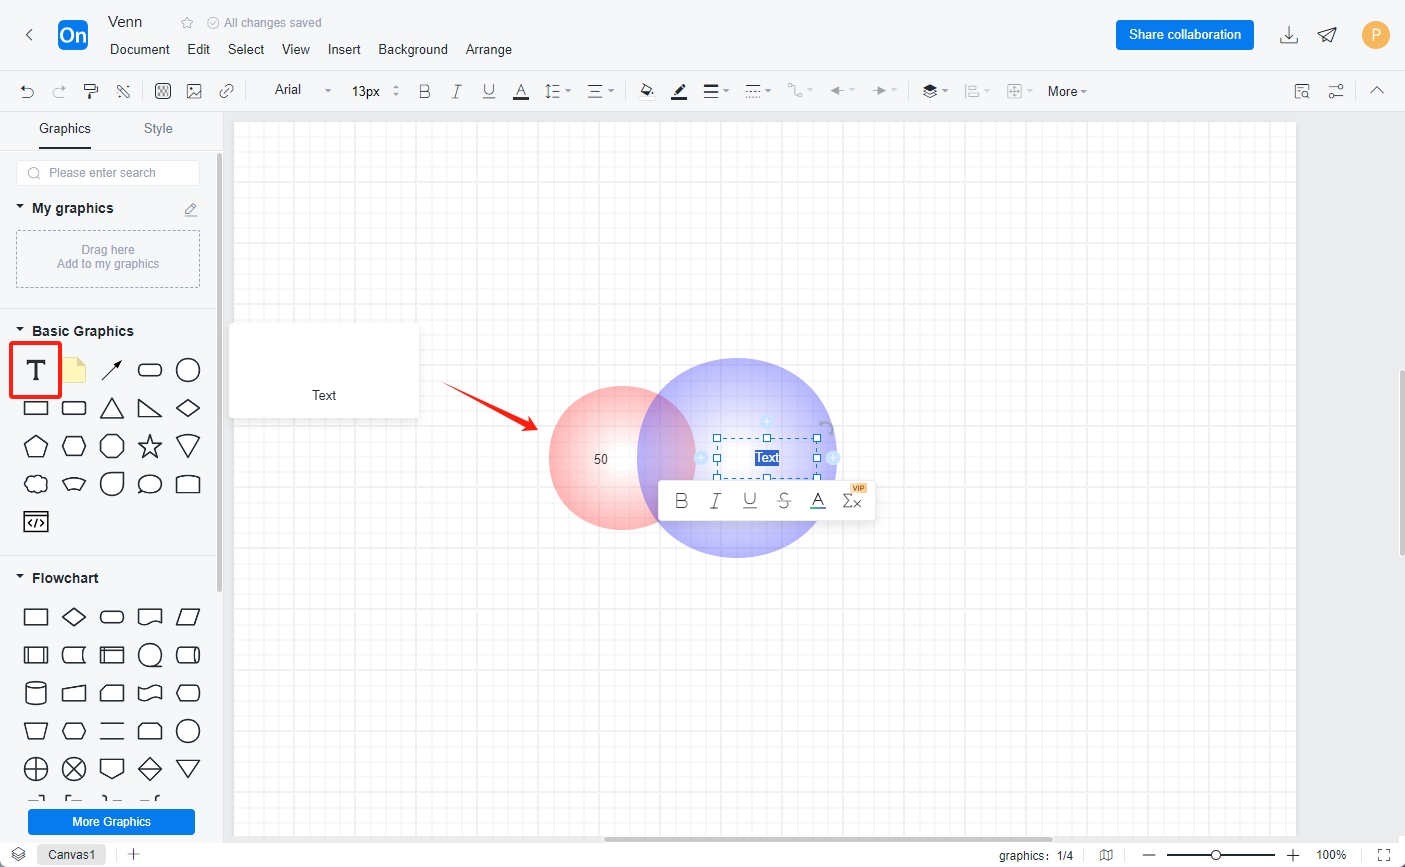
Step 3 - Mark the content
So what are the application scenarios of Venn diagram in our daily study, work and life? Today I will share with you some common scenarios of Venn diagram.
1. Understand the inclusion relationship between different concepts
The most intuitive application of the Venn diagram is to represent the intersection relationship between two or more sets. Through the overlapping parts of the diagram, you can clearly see the common elements and different elements between the sets.
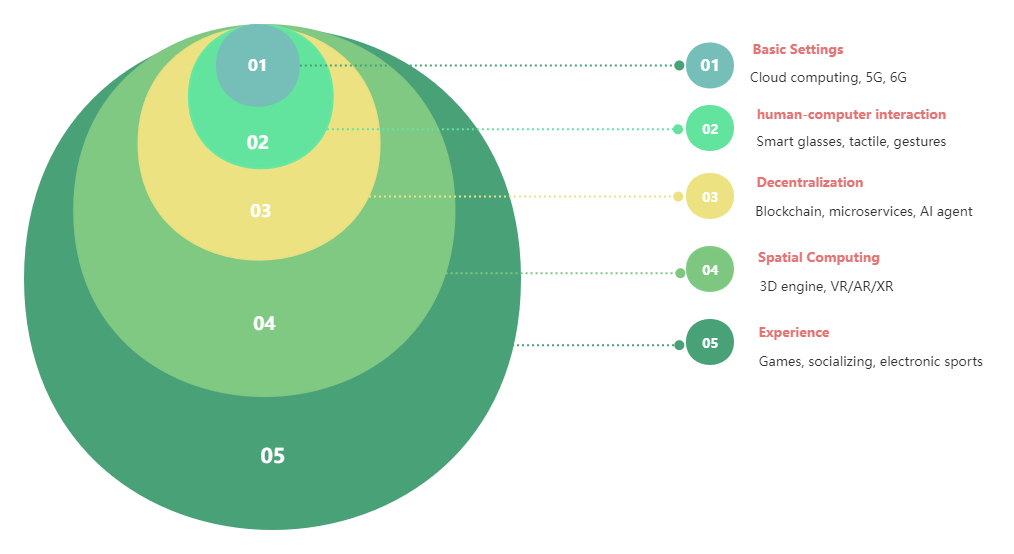
AI Intelligent Relationship Diagram
2. Market Research
Use Venn diagrams to conduct business analysis and find the balance between products, prices and customers, so as to develop more effective marketing strategies and improve customer satisfaction.
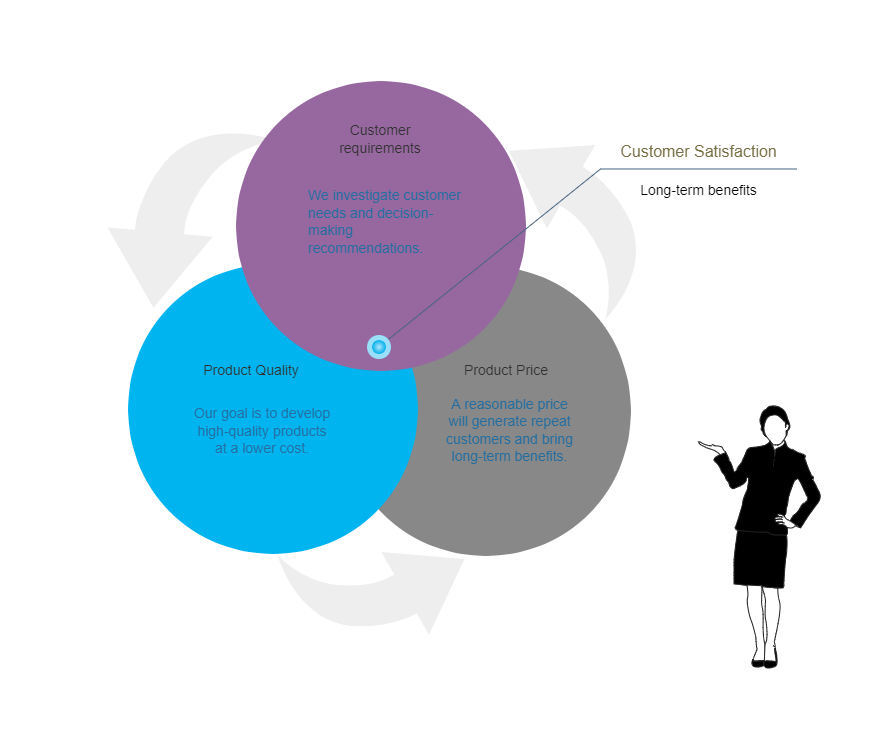
Customer Satisfaction Venn Diagram Template
3. Choose a job
Venn diagrams can also be used for career planning. If you are about to graduate from college and want to find a job that suits you, you cannot just choose a field based on your major. You have to take into account your interests, abilities, and social needs. In the diagram above, you can list what you are good at, what you like, and what you can do to make a living, and finally choose the most suitable job.
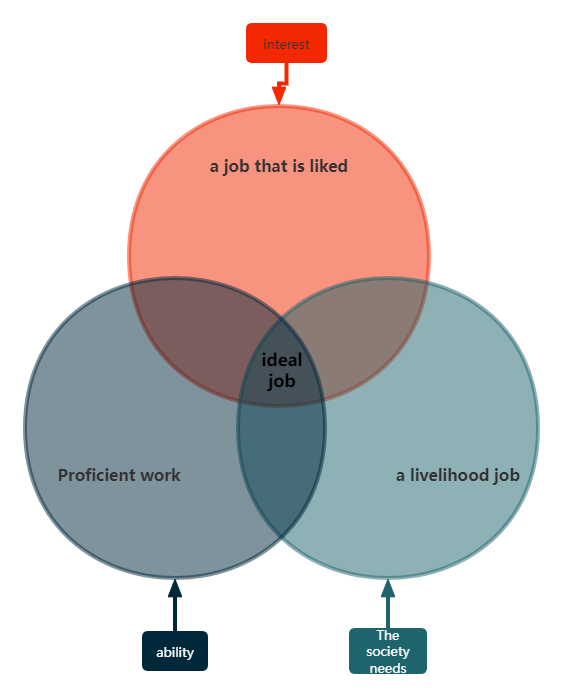
How to Choose Your Ideal Job Venn Diagram
The advantage of the Venn diagram is that it does not require advanced equipment to draw. You only need a canvas to draw a Venn diagram with circles. It is very useful and can help people visualize abstract things and reduce the complexity of things. By visualizing the intersection of sets, it can help us find the commonalities and differences of sets, and then help people see the pros and cons or similarities and differences of things and make the best choice.
For more beautiful Venn diagram templates, please visit ProcessOn template community .