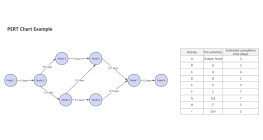
Basic PERT Chart Example
2024-12-06 11:23:25 116 0 Report 0
0

Login to view full content
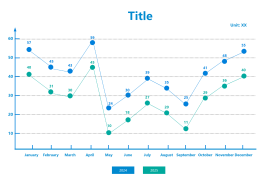
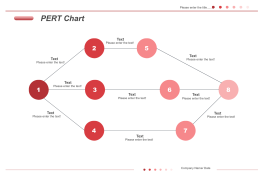
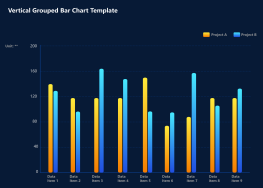
This is a basic PERT chart example, designed to illustrate the scheduling and organization of tasks within a project. It includes various tasks such as Task 1, Task 2, Task 3, and others, each with specific durations ranging from 1 to 10 days. The chart outlines dependencies and timelines, providing a clear visual representation of the project's critical path. The structured flow from start to end date helps in effective project management and planning, ensuring that all tasks are completed within the stipulated time frame. This example serves as a useful tool for understanding project timelines and task prioritization.
Other creations by the author
Outline/Content
3 days
1 day
Task 6
9 days
Task 3
4 days
Task 4
10 days
Task 5
8 days
5 days
Task 10
Task 9
Task 11
Start date
Task 8
Task 2
2 days
End date
Basic PERT Chart Example
Task 1
Task 7


Collect
Collect
0 Comments
Next page