Cause and Effect Diagram Style Template
2024-08-09 10:51:25 220 1 Report 0
0

Login to view full content
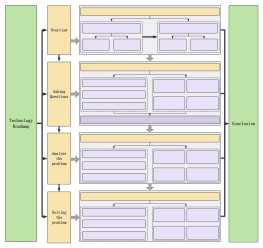
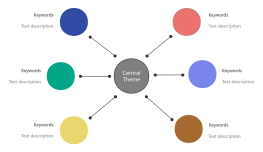
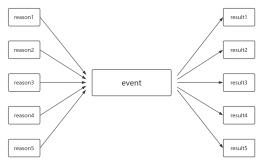
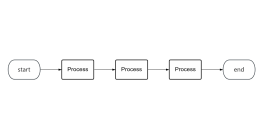
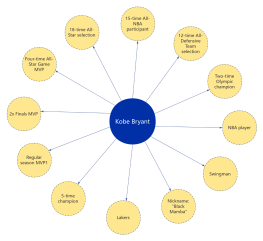
The cause-and-effect diagram is also called a complex flow chart. The box in the center of the complex flow chart represents an important event. The left side is the multiple causes of the event, and the right side is the result of the event. It is suitable for analyzing and presenting multiple parallel or intersecting processes in complex situations involving multiple processes and dimensions.
Other creations by the author
Outline/Content
reason5
event
result1
reason3
reason4
reason2
result2
result5
reason1
result3
result4
Collect
Collect

Collect
0 Comments
Next page
Recommended for you
More