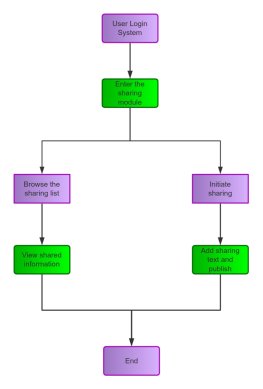
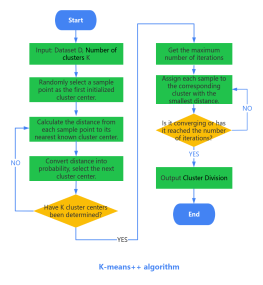
Clustering algorithm flow chart
2025-02-12 18:25:39 190 3 Report 0
1

Login to view full content
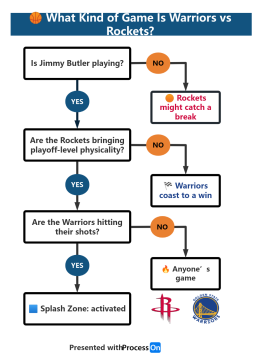
This flowchart illustrates the process of a clustering algorithm, detailing each step from initializing data points to determining final cluster centers. It begins with setting an initial central point and capacity, followed by updating the center based on sample point membership functions. The flowchart guides through checking if all points have been traversed and whether the center point has stabilized. It also involves calculating mean values of data points and adjusting the center point radius. The process concludes with a visual representation of clustering effects through scatter plots, ensuring effective encapsulation and analysis of data clusters.
Other creations by the author
Outline/Content
Update Center Point
Have all points been traversed?
Y
End
Final encapsulation call
Initial capacity Cmax = 0
Input Data_x and Data_y
Initial point
Set central point capacity
N
Start
Return to new_center
Update the center point by updating the center point function new_Center()
Obtained through the membership function of sample pointsCu(x,y,c)
Set center point radius
Is the center point no longer changing?
x=Data_x.mean()y=Data_y.mean()
Is the remaining dataset new_Data empty?
Displaying scatter plot clustering effects through drawing functions
Sequentially read the volume information of all sample points.
Traverse to the next point
Is the capacity of this point greater than?
Cmax=C
returnCenter⟸Cmax
Collect
Collect
0 Comments
Next page
Recommended for you
More