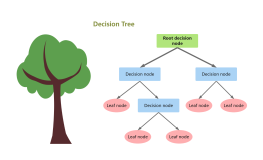
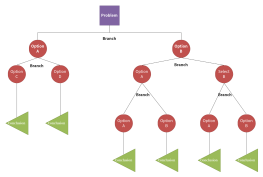
Decision Tree Analysis
2024-12-23 15:47:15 155 1 Report 0
0

Login to view full content
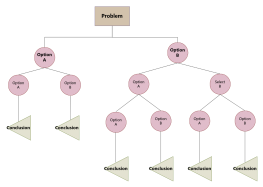
This flowchart illustrates a Decision Tree Analysis, focusing on investment strategies for factory operations. It examines scenarios with varying demands, including strong and weak demand outcomes. The analysis explores two primary options: renovating the old factory with a 50 million investment or building a new factory with a 120 million investment. Probabilities and expected monetary values (EMVs) are calculated to guide decision-making, with emphasis on selecting the decision with the larger EMV. This decision tree aims to provide a structured approach to evaluating potential financial outcomes and optimizing investment strategies.
Other creations by the author
Outline/Content
40%
Chance Node
End Node
8000 million = 200 million - 120 million
46000000=70000000*60%+10000000*40%
Strong demand
10 million=60 million-50 million
60%
Renovate the old factory (Invest 50 million)
-30 million = 90 million - 120 million
New or改造
Decision Node
Weak demand (60 million)
Build a new factory (Invest 120 million)
70 million=120 million-50 million
Weak demand (90 million)
Pending decision event
Decision tree analysis
EMV decision: 46 million * select decision weight larger
Pending decision
36000000=80000000*60%+(-30000000)*30%


Collect
Collect
0 Comments
Next page
Recommended for you
More