Histogram, bar chart template
2025-01-08 18:13:21 129 1 Report 0
0

Login to view full content
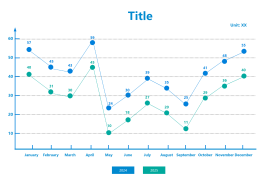
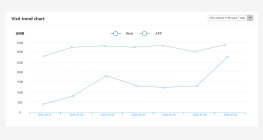
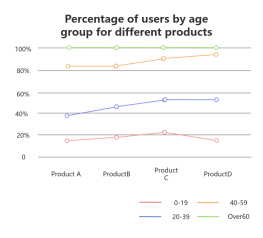
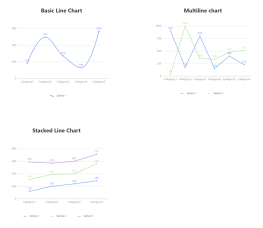
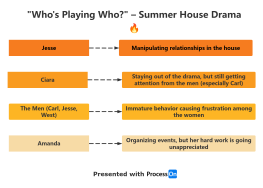
This diagram serves as a template for creating histograms and bar charts, detailing the essential components and their respective data points. The flowchart includes various labels, each associated with a percentage value and a color code, such as Label 8 with 37% and #535353, and Label 6 with 93% and #966E99. It emphasizes the importance of adding titles and detailed content to enhance chart clarity and effectiveness. By following this template, users can efficiently organize and present data visually, ensuring that key information is highlighted and easily understood.
Other creations by the author
Outline/Content
Label 8
Please add the detailed content here.
Label 5
Add a title
37%
60%
#535353
Label 2
72%
Label 4
80%
#966E99
Label 6
93%
Label 1
57%
58%
#F0774A
Label 3
71%
#405C71
56%
Label 7
83%
66%
Collect
Collect
0 Comments
Next page
Recommended for you
More