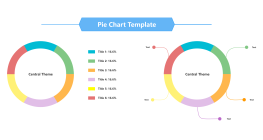
Line chart template
2025-01-08 18:13:21 136 0 Report 0
0

Login to view full content
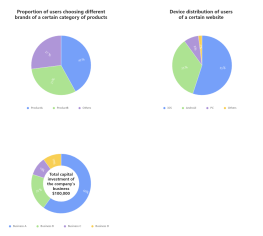
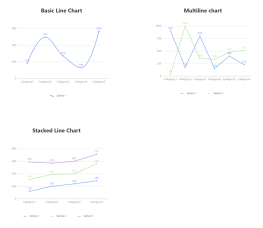
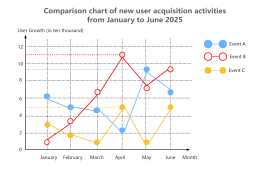
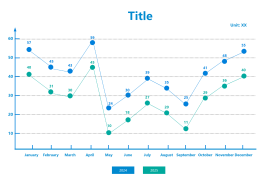
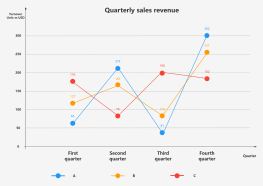
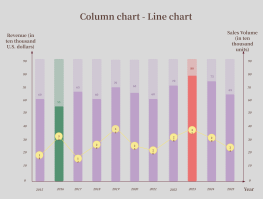
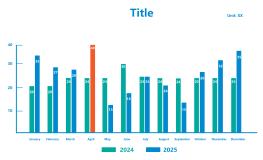
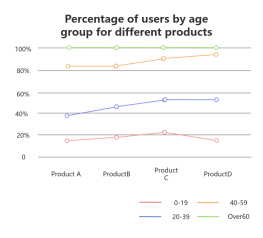
This is a line chart template guide, designed to assist users in creating and comparing single and percentage-based line charts. The schematic diagram provides a visual representation of data points and trends, with values ranging from 500 to 2000 and percentages from 33% to 83%. This template is ideal for illustrating changes over time and comparing multiple datasets. By following this guide, users can effectively visualize data, making it easier to interpret and analyze trends. This tool is especially useful for those looking to enhance their data presentation skills.
Other creations by the author
Outline/Content
Please enter text
text
1120
Single line chart
1500
Compare the line chart
Line chart schematic diagram
1100
500
50%
1000
83%
2000
33%
68%
Percentage Line Chart
line chart
66%


0 Comments
Next page
Recommended for you
More