PERT Chart Example
2024-12-06 11:23:25 118 1 Report 0
0

Login to view full content
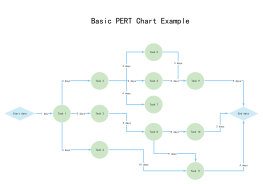
This PERT Chart Example illustrates the sequence and duration of activities required to complete a project efficiently. Each node represents a specific task, detailing its pre-activities and estimated completion time. Starting with Activity A, which has no preceding tasks, the chart progresses through various interconnected activities such as B, C, D, and E, each with specific time frames. Critical paths are highlighted, showing dependencies like Activity F following C, and Activity H following F. This chart serves as a valuable tool for project managers to visualize task dependencies and optimize project timelines effectively.
Other creations by the author
Outline/Content
Node 4
G:7 days
Activity
Pre-activities
Estimated completion time (days)
A
Output: None
2
B
3
C
4
D
E
F
7
G
H
I
Node 1
Node 5
Node 2
I:2 days
Node 8
2 days
F:7 days
Node 3
C:4 days
Node 6
H:3 days
Node 7
PERT Chart Example
B:3 days
E:3 days


Collect
Collect

0 Comments
Next page
Recommended for you
More