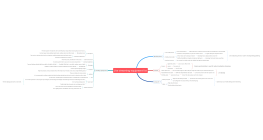
Video platform live broadcast review data split
2024-11-22 18:29:58 147 1 Report 0
1

Login to view full content
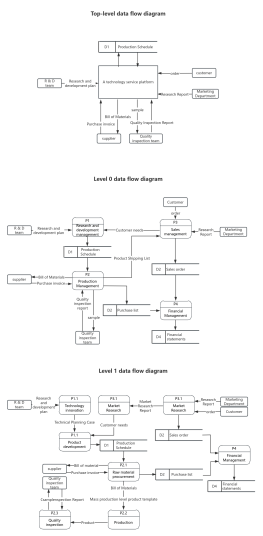
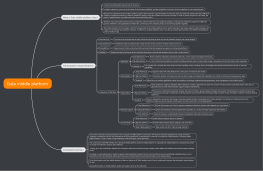
The 'Video Platform Live Broadcast Review Data Split' flowchart provides a comprehensive overview of the various metrics and factors influencing live broadcast performance on video platforms. It highlights key elements such as user interaction, payment probabilities, and audience engagement metrics, including average viewing time and user satisfaction. The chart also delves into data dimensions like GMV/UV, click-through rates, and conversion rates, offering insights into the effectiveness of live broadcast strategies. Additionally, it examines the impact of official traffic support, host guiding ability, and brand appeal on live broadcast success, ultimately aiming to enhance revenue outcomes and audience satisfaction.
Other creations by the author
Outline/Content
Operation. Anchor
The probability of payment after a user clicks on the product detail page
All of the above
Number of times users actually paid / Number of times users clicked on products
Live stream audience interaction
GMV/UV
Average viewing time
Live broadcast acceptance capacity. Live broadcast activitiesprocess script. Official traffic support strength
Maximum number of online users
Return rate
Audience likes data
Viewing & Interaction Data
Check in the video number background
Commodity & Transaction Data
Host guiding ability
User comment rate
How much public domain traffic has a live broadcast settled into the private domain?
Data indicators
User satisfaction with the product
Factors
Number of times users actually click on the product / all viewers
The appeal of live broadcast brands. Private alkali channel coverage and promotion intensity; live broadcast on-site guide appointment frequency and intensity
GMV
Everyone
Live broadcast cumulative sales department
Lucky bag prize attraction
The probability that users click into the product detail page
Point to the result
Live viewership for a single game
Exposure rate
Relevant positions
View on the live account
Audience evaluation dwell time
Number of reservations
Refund order number / total order number
Data Dimension
UV Value
--
Click-through rate
Live streaming data analysis on video platforms
Algorithm
New followers
Live broadcast pre-private traffic start-up volume The amount of guided appointment interaction in the previous live broadcast
Number of people on site
Maximum number of concurrent viewers
Output: Single live broadcast revenue
Cheers
Collect
Collect
0 Comments
Next page
Recommended for you
More