A diagram that uses specific graphic symbols and instructions to represent an algorithm is called a flowchart or block diagram. A flowchart uses various graphics connected by arrows to show the specific steps of a process. You can draw a flowchart to accurately understand how things work.
There is no clear classification standard for flowcharts at present. Andrew Veronis named three basic types of flowcharts in 1978: system flowchart, general flowchart, and detailed flowchart. In the same year, Marilyn Bohl proposed: "In fact, there are two types of flowcharts in the field of solution planning: system flowchart and program flowchart"; in 2001, Mark A Fryman proposed: "In the field of business and management, there are more types of flowcharts such as decision flowcharts, logic flowcharts, system flowcharts, product flowcharts, and process flowcharts." More recently, Sterneckert proposed in 2003 that flowcharts can be drawn from the perspective of different user groups (such as managers, system analysts, and clerks), and divided them into four commonly used types:
document flowchart: showing the control of document flow through a system;
data flow diagram: showing the control of data flow in a system;
system flowchart: showing the control at the physical level or resource level;
program flowchart: showing the control of programs in a system;
Although there is no strict classification standard for flowcharts themselves, a basic consensus has been formed on their graphical expression.
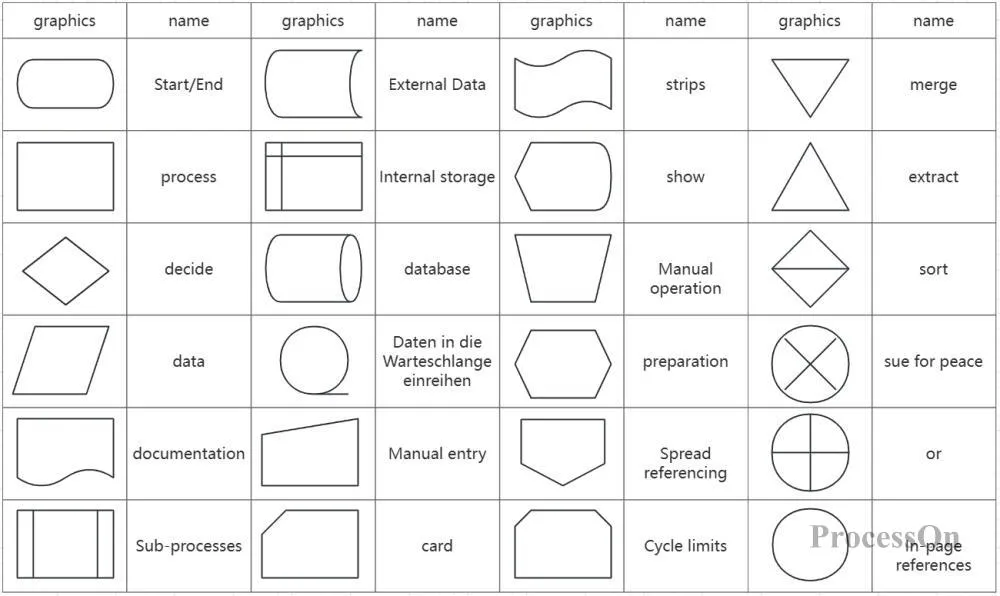
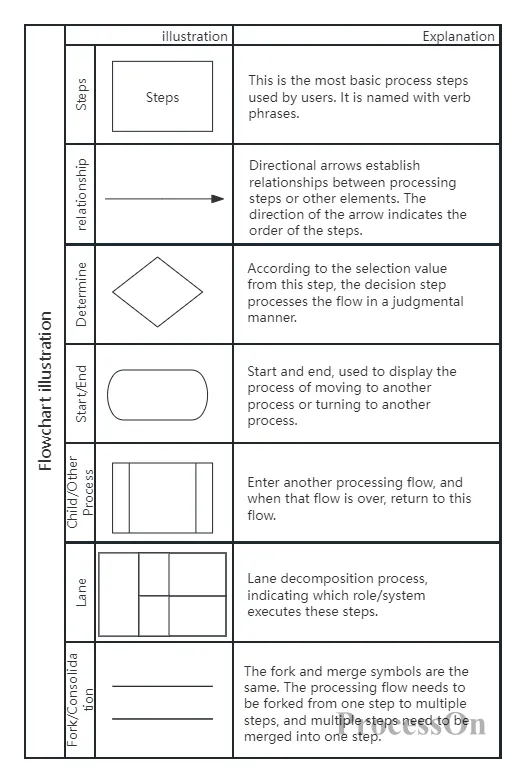
1. When drawing a flowchart, in order to ensure that the process is clear and logical, it should be arranged from left to right and from top to bottom;
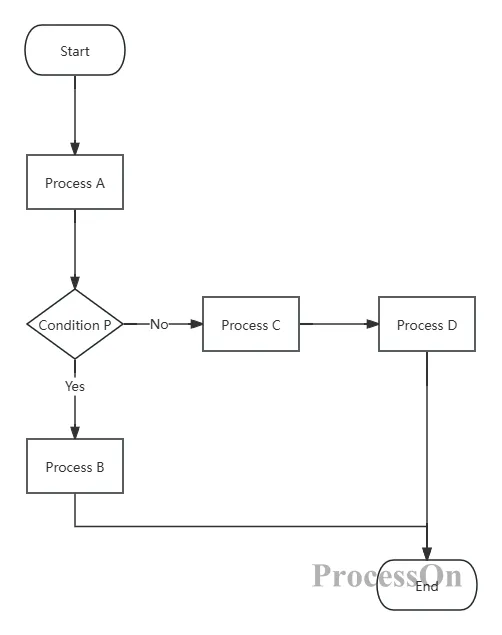
Basic Flowchart Template-Go to edit
2. When drawing a flowchart, use uniform and accurate graphic symbols, use concise and easy-to-understand text in the graphics, and write complex information in the notes;
3. When drawing a flowchart, use the start symbol as the starting point and the end symbol as the end point; the start symbol can only appear once in the flowchart, and the end symbol is unlimited;
4. Flow lines should not cross as much as possible. If they do cross, use crossover lines to distinguish the flow directions;
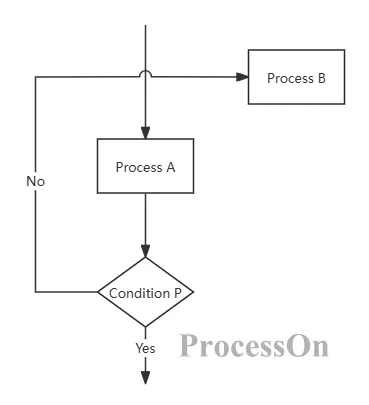
5. The processing element has a single input and a single output, while the judgment element has a single input and multiple outputs;
6. There is only one indicator arrow for the same path symbol.
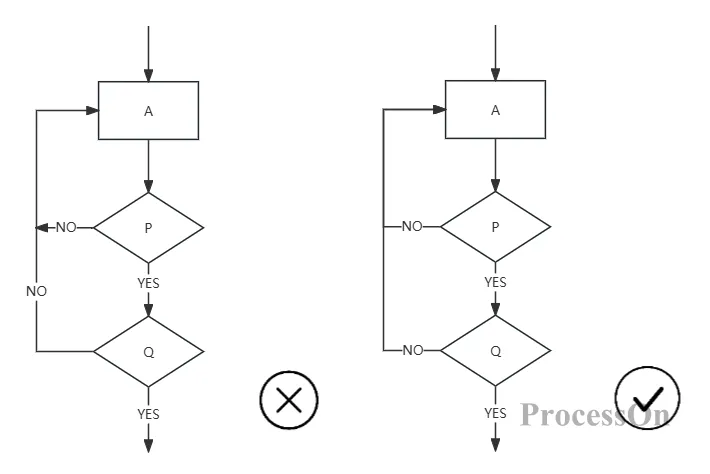
There are many software for drawing flowcharts. Here we recommend ProcessOn . The advantages of using ProcessOn to draw flowcharts are:
it supports free online drawing, the page is simple, the user experience is smooth, and it is very suitable for beginners;
The flowchart editor is rich in elements and provides thousands of symbols for professional flowcharts, UML, network topology diagrams, mind maps, and other professional graphics.
Supports inserting pictures, links, LaTax mathematical formulas, code blocks, etc. to meet users' personalized needs;
Supports multiple people to view or edit files online at the same time, suitable for team collaboration, and can import and export Visio formats, with strong compatibility;
A large number of flowchart templates and examples can be used as reference or directly used to provide drawing ideas and improve drawing efficiency.
1. Clarify purpose and scope
Determine the goal: Make it clear what problem the flowchart is going to solve or illustrate.
Define the scope: Identify all the steps, decisions, and process branches that the flowchart needs to cover.
2. List all steps and decision points
Break down tasks: Break down complex processes into simple, concrete steps.
Identify decision points: Find the nodes in the process where choices or judgments need to be made.
3. Determine the flowchart symbols
Standard symbols: Use common flowchart symbols (circles for start/end, rectangles for steps, diamonds for decisions, etc.).
Consistency: Keep symbols consistent throughout the flowchart for easier understanding and reading.
4. Sketch
Preliminary Layout: Quickly sketch your flowchart on paper or a whiteboard without going into too much detail.
Adjust the order: Adjust the order of steps based on logical relationships and dependencies.
5. Add details and annotations
Elaborate steps: Add necessary descriptions or comments to each step to ensure that readers can understand the content of each step.
Mark decision conditions: indicate the judgment conditions or criteria at the decision nodes.
6. Inspection and Verification
Logic check: Ensure that the steps and decision logic in the flowchart are correct without omissions or duplications.
Feedback loop: Have relevant people (e.g. team members, stakeholders) review the process map and make adjustments based on the feedback.
7. Use professional tools to create the final version
Select tools: Choose a suitable flowchart drawing tool (such as Microsoft Visio, ProcessOn , etc.) according to your needs.
Draw the final diagram: Draw and beautify the flowchart in the tool to ensure it is both clear and beautiful.
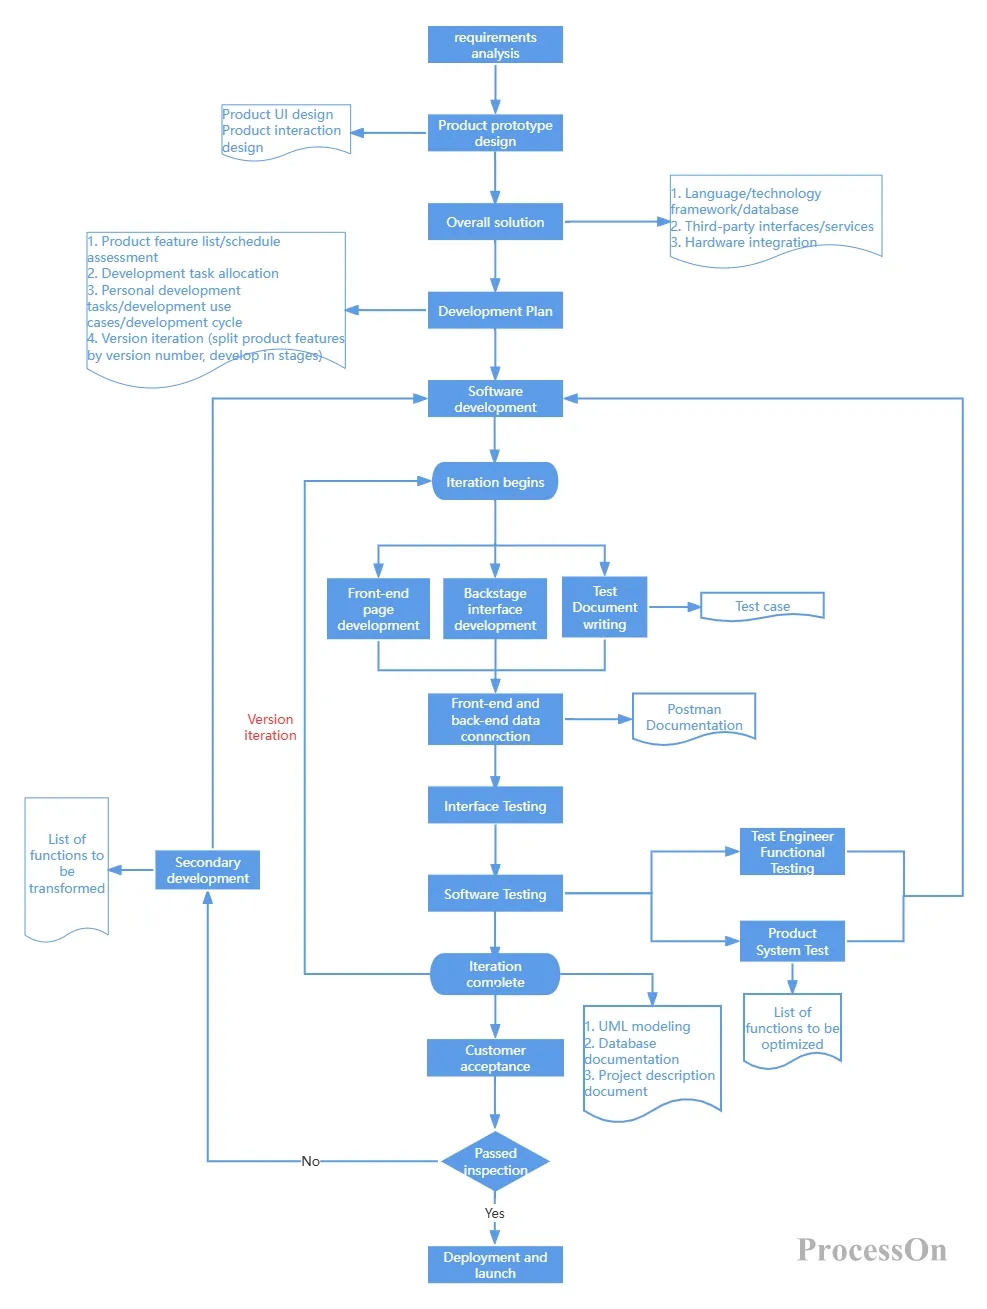
Software Development Flowchart-Go to edit
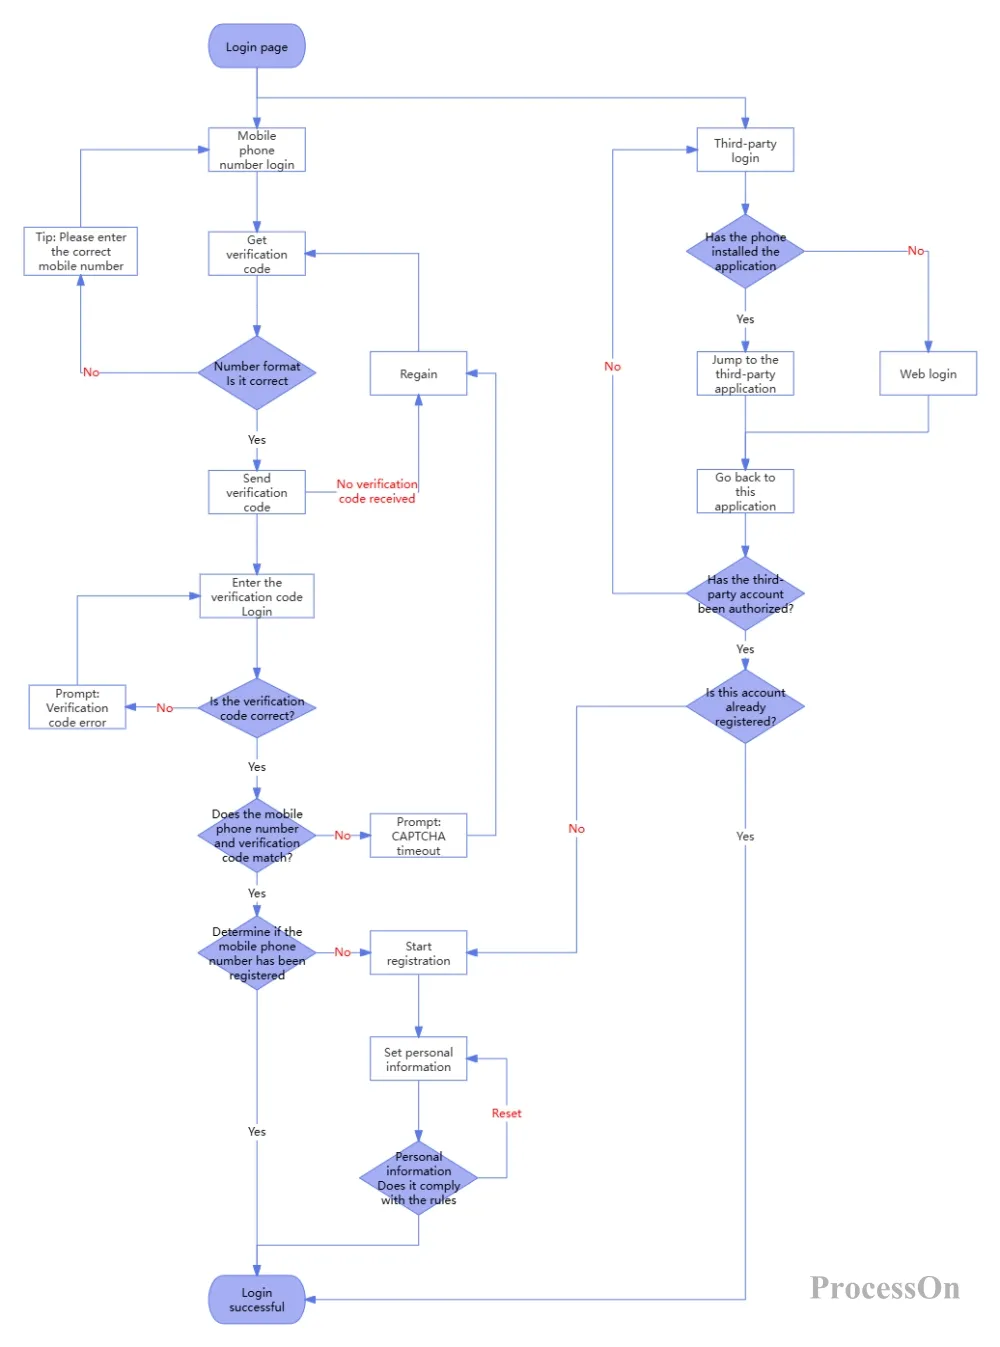
Login process design-Go to edit
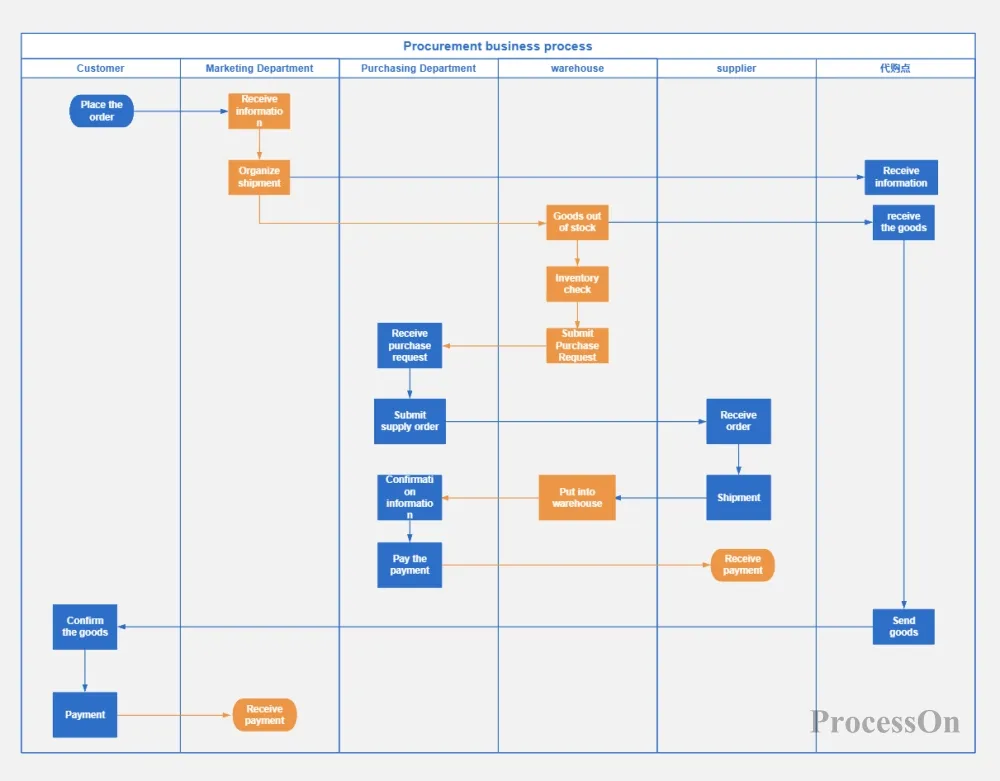
Procurement business process-Go to edit
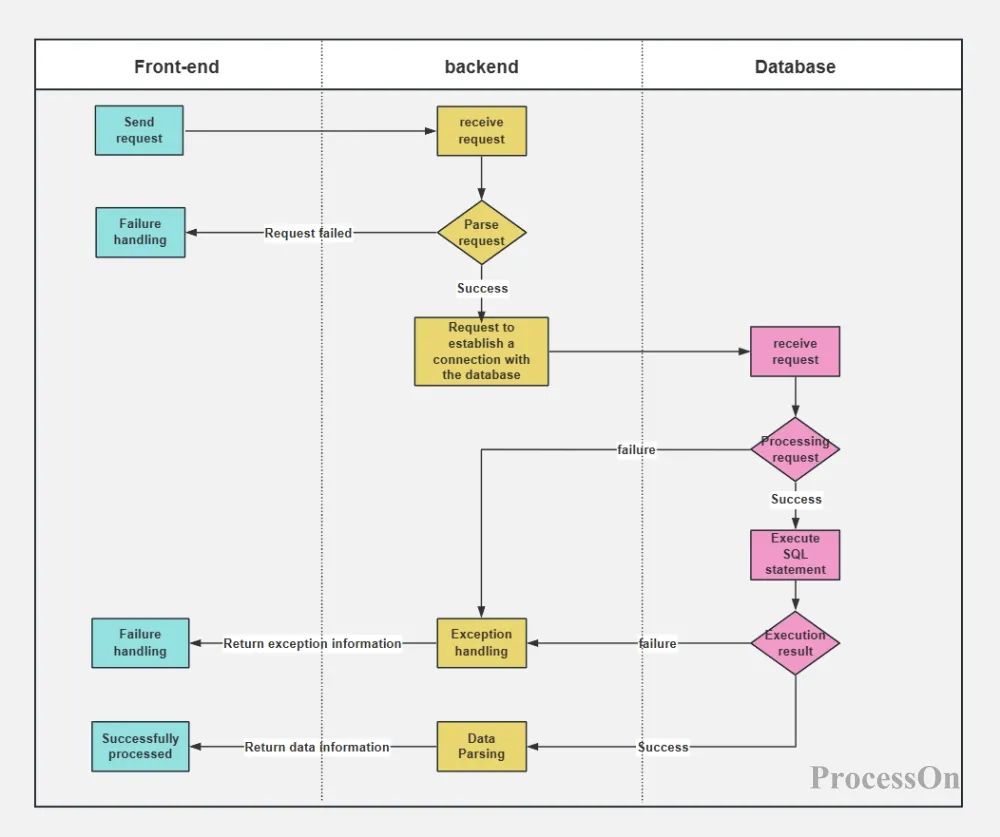
Interface interaction flow chart-Go to edit
The above is the relevant content of flowcharts. Flowcharts have a wide range of application scenarios in many industries such as the Internet, consulting, and law. They can help companies establish efficient and reusable workflows and standards, and simplify long paragraphs of text descriptions into visual graphic languages, making it easier for information recipients to understand. If you want to try drawing a data flow diagram or view more examples, you can visit the official ProcessOn website.