

Do you often feel that time is not enough? Why are others so efficient in the same 24 hours, while you always fail to complete your tasks? The most important factor in the gap is the ability to manage and control time and projects.
To improve your time management and project management skills, I recommend you use the Gantt chart. I have prepared the latest Gantt chart templates for you. Let's take a look at how efficiency experts use the Gantt chart.
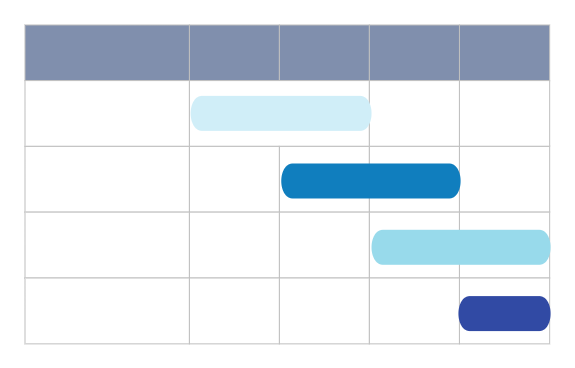
The most basic style of Gantt chart
The Gantt chart, also known as a bar chart or a bar graph, is a very commonly used chart type in project and task management. It shows the order and duration of specific projects through activity lists and time scales. It is very suitable for secondary optimization of our long-term plans. Through the use of the Gantt chart, medium- and long-term goals can be divided into more controllable short-term plans, so that plans can be implemented and the efficiency of actions can be improved.
1. Determine the project scope and task list
Clarify project goals: Understand the overall goals and key milestones of the project.
List all tasks: List in detail all the tasks that need to be completed for the project, including subtasks.
2. Estimate task duration
Estimate the time required for each task, which may need to be based on experience, historical data, or expert opinion.
Consider the parallel and serial relationships between tasks, that is, which tasks can be performed simultaneously and which must be performed sequentially.
3. Identify task dependencies
Identify the sequencing and dependencies between tasks, which helps understand which tasks must be completed before others can begin.
Mark these dependencies using arrows, symbols, or functions in your software tools.
4. Set the time frame
Determine the project's start date and expected end date.
Set a reasonable time frame for the project based on task durations and dependencies.
5. Draw a Gantt chart
Create a Gantt chart template or a blank chart in your tool of choice.
Enter the task name, start time, end time, and duration.
Adjust the position and length of the task bar based on task dependencies.
Use colors, icons, or annotations to distinguish different task statuses (such as in progress, completed, deferred) or priorities.
6. Review and Adjustment
Carefully review the Gantt chart to ensure that all information is accurate and that dependencies between tasks are correctly represented.
Adjust the position, length, or color of the task bar as needed.
Invite team members or stakeholders to review the Gantt chart and collect their feedback and suggestions.
7. Updates and Maintenance
As the project progresses, update the Gantt chart regularly to reflect the latest status of the project.
When tasks are completed or changed, mark and adjust them in the Gantt chart in a timely manner.
Come and appreciate the excellent Gantt chart templates in the ProcessOn template community with the editor!
Special work weekly/monthly progress sheet
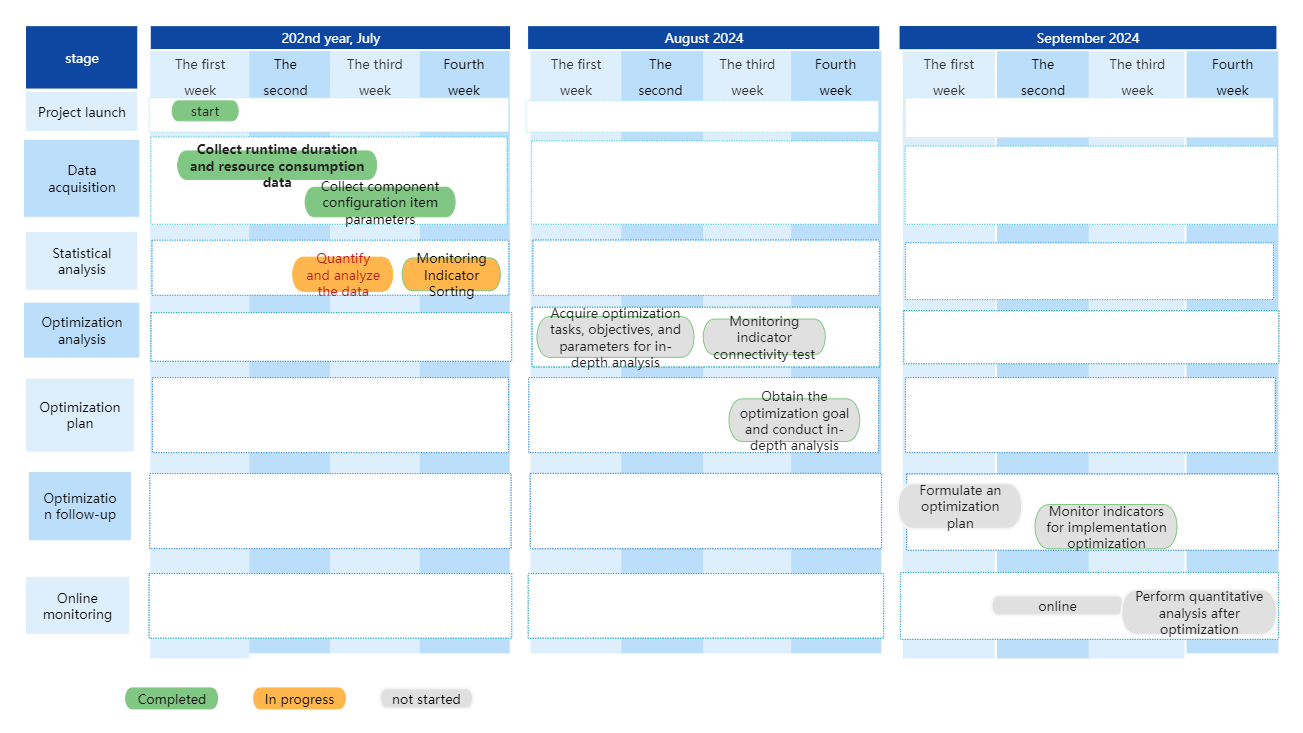
Gantt chart of special work schedule
Project Monthly Gantt Chart (with Milestones)
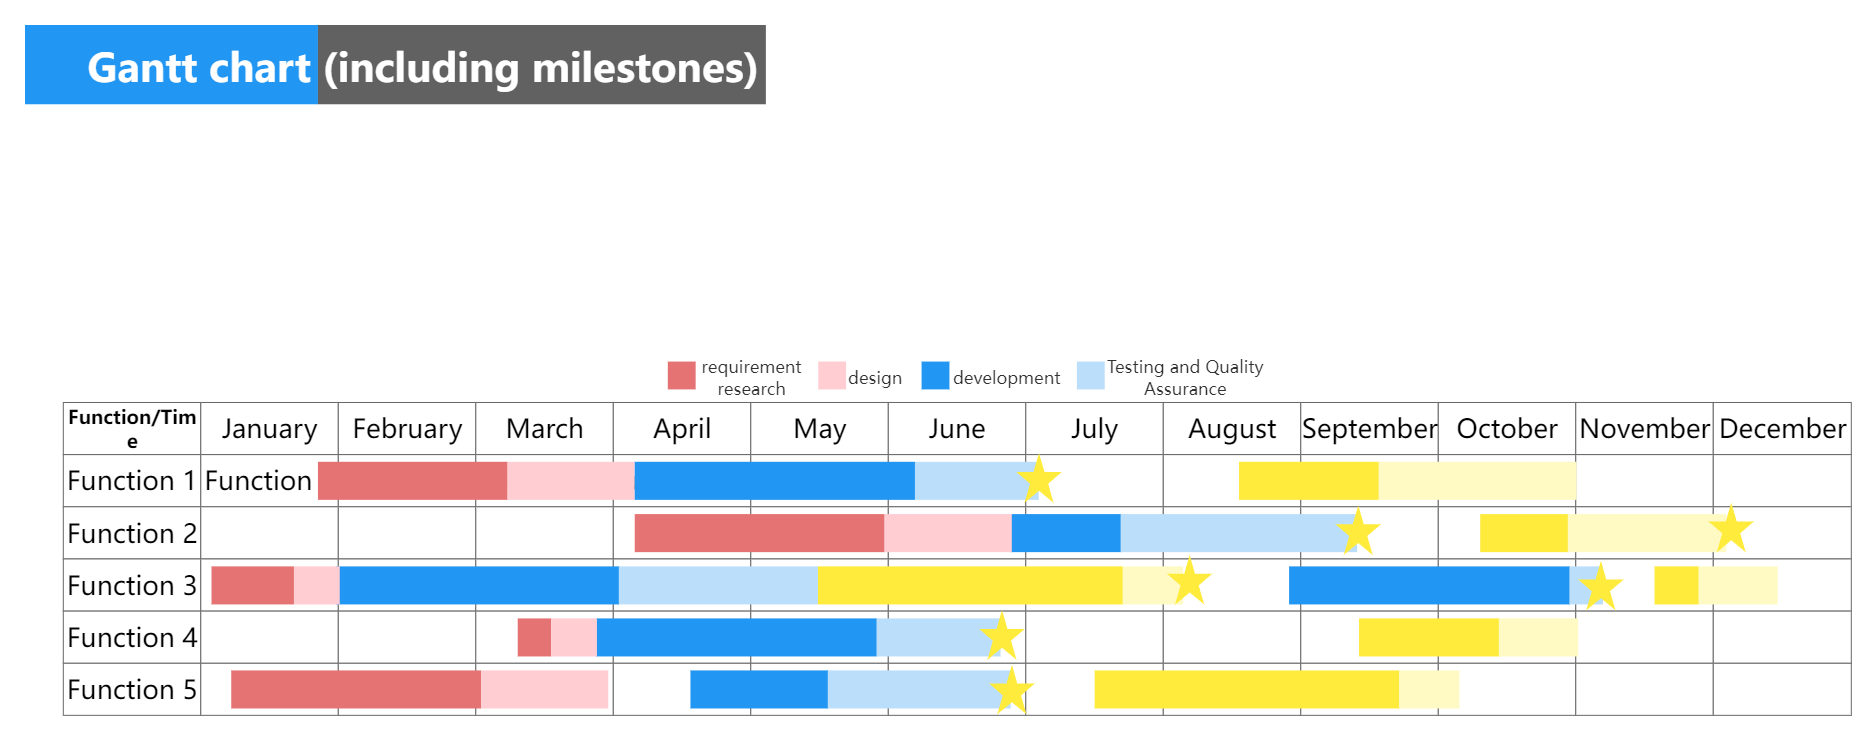
Project Gantt chart (with milestones)
Software Development Lifecycle
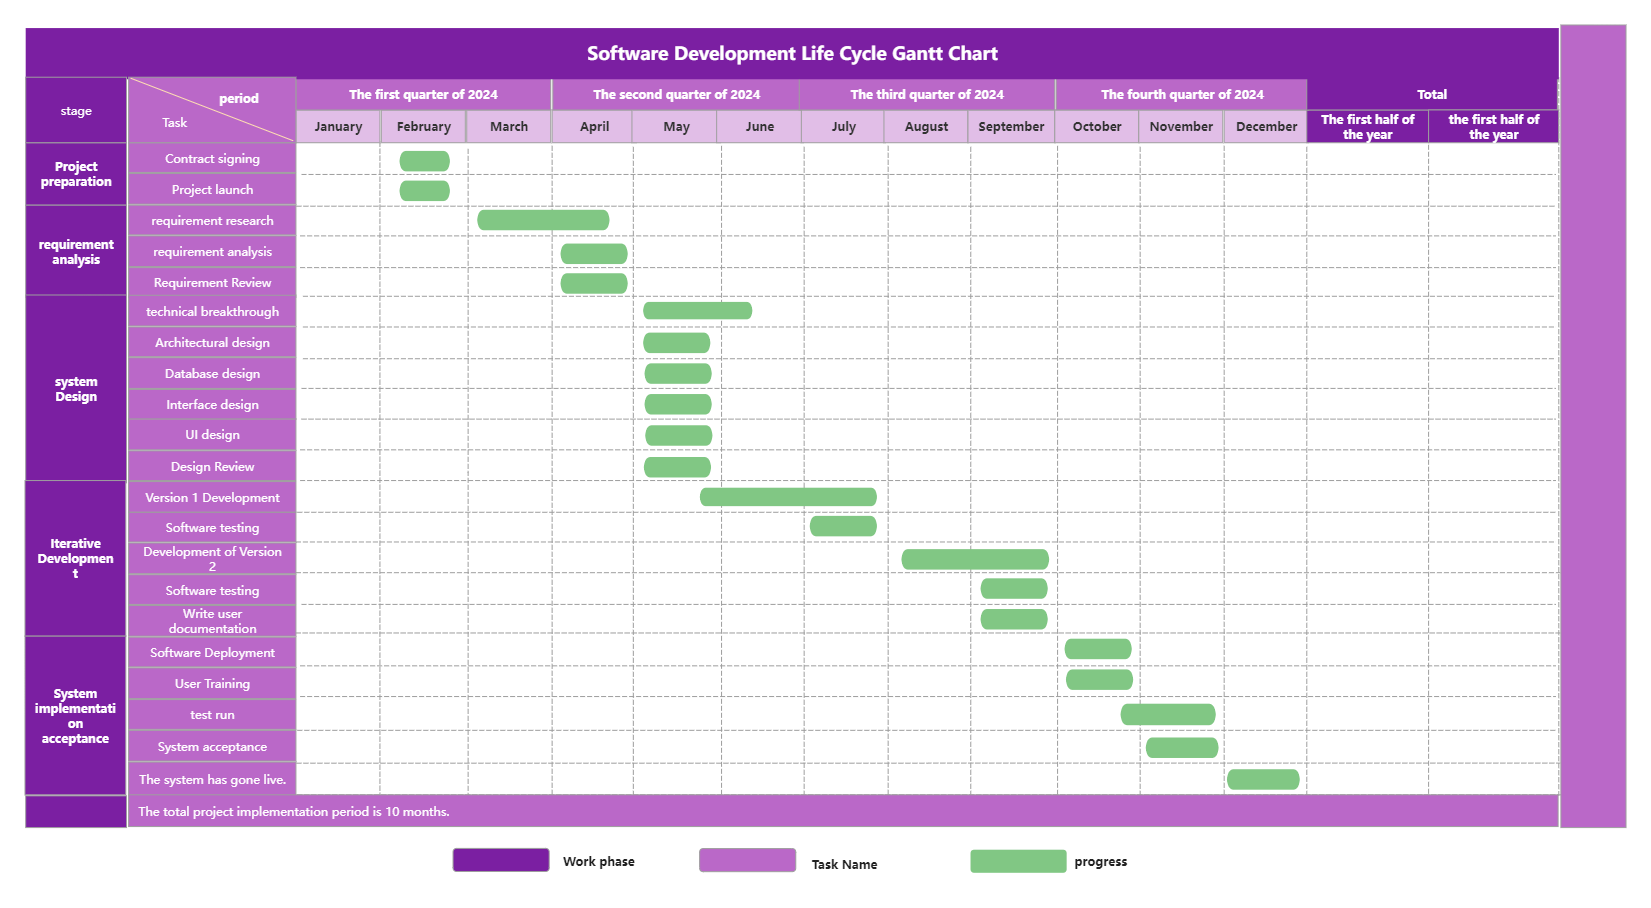
Software Development Lifecycle Gantt Chart
Horizontal column Gantt chart
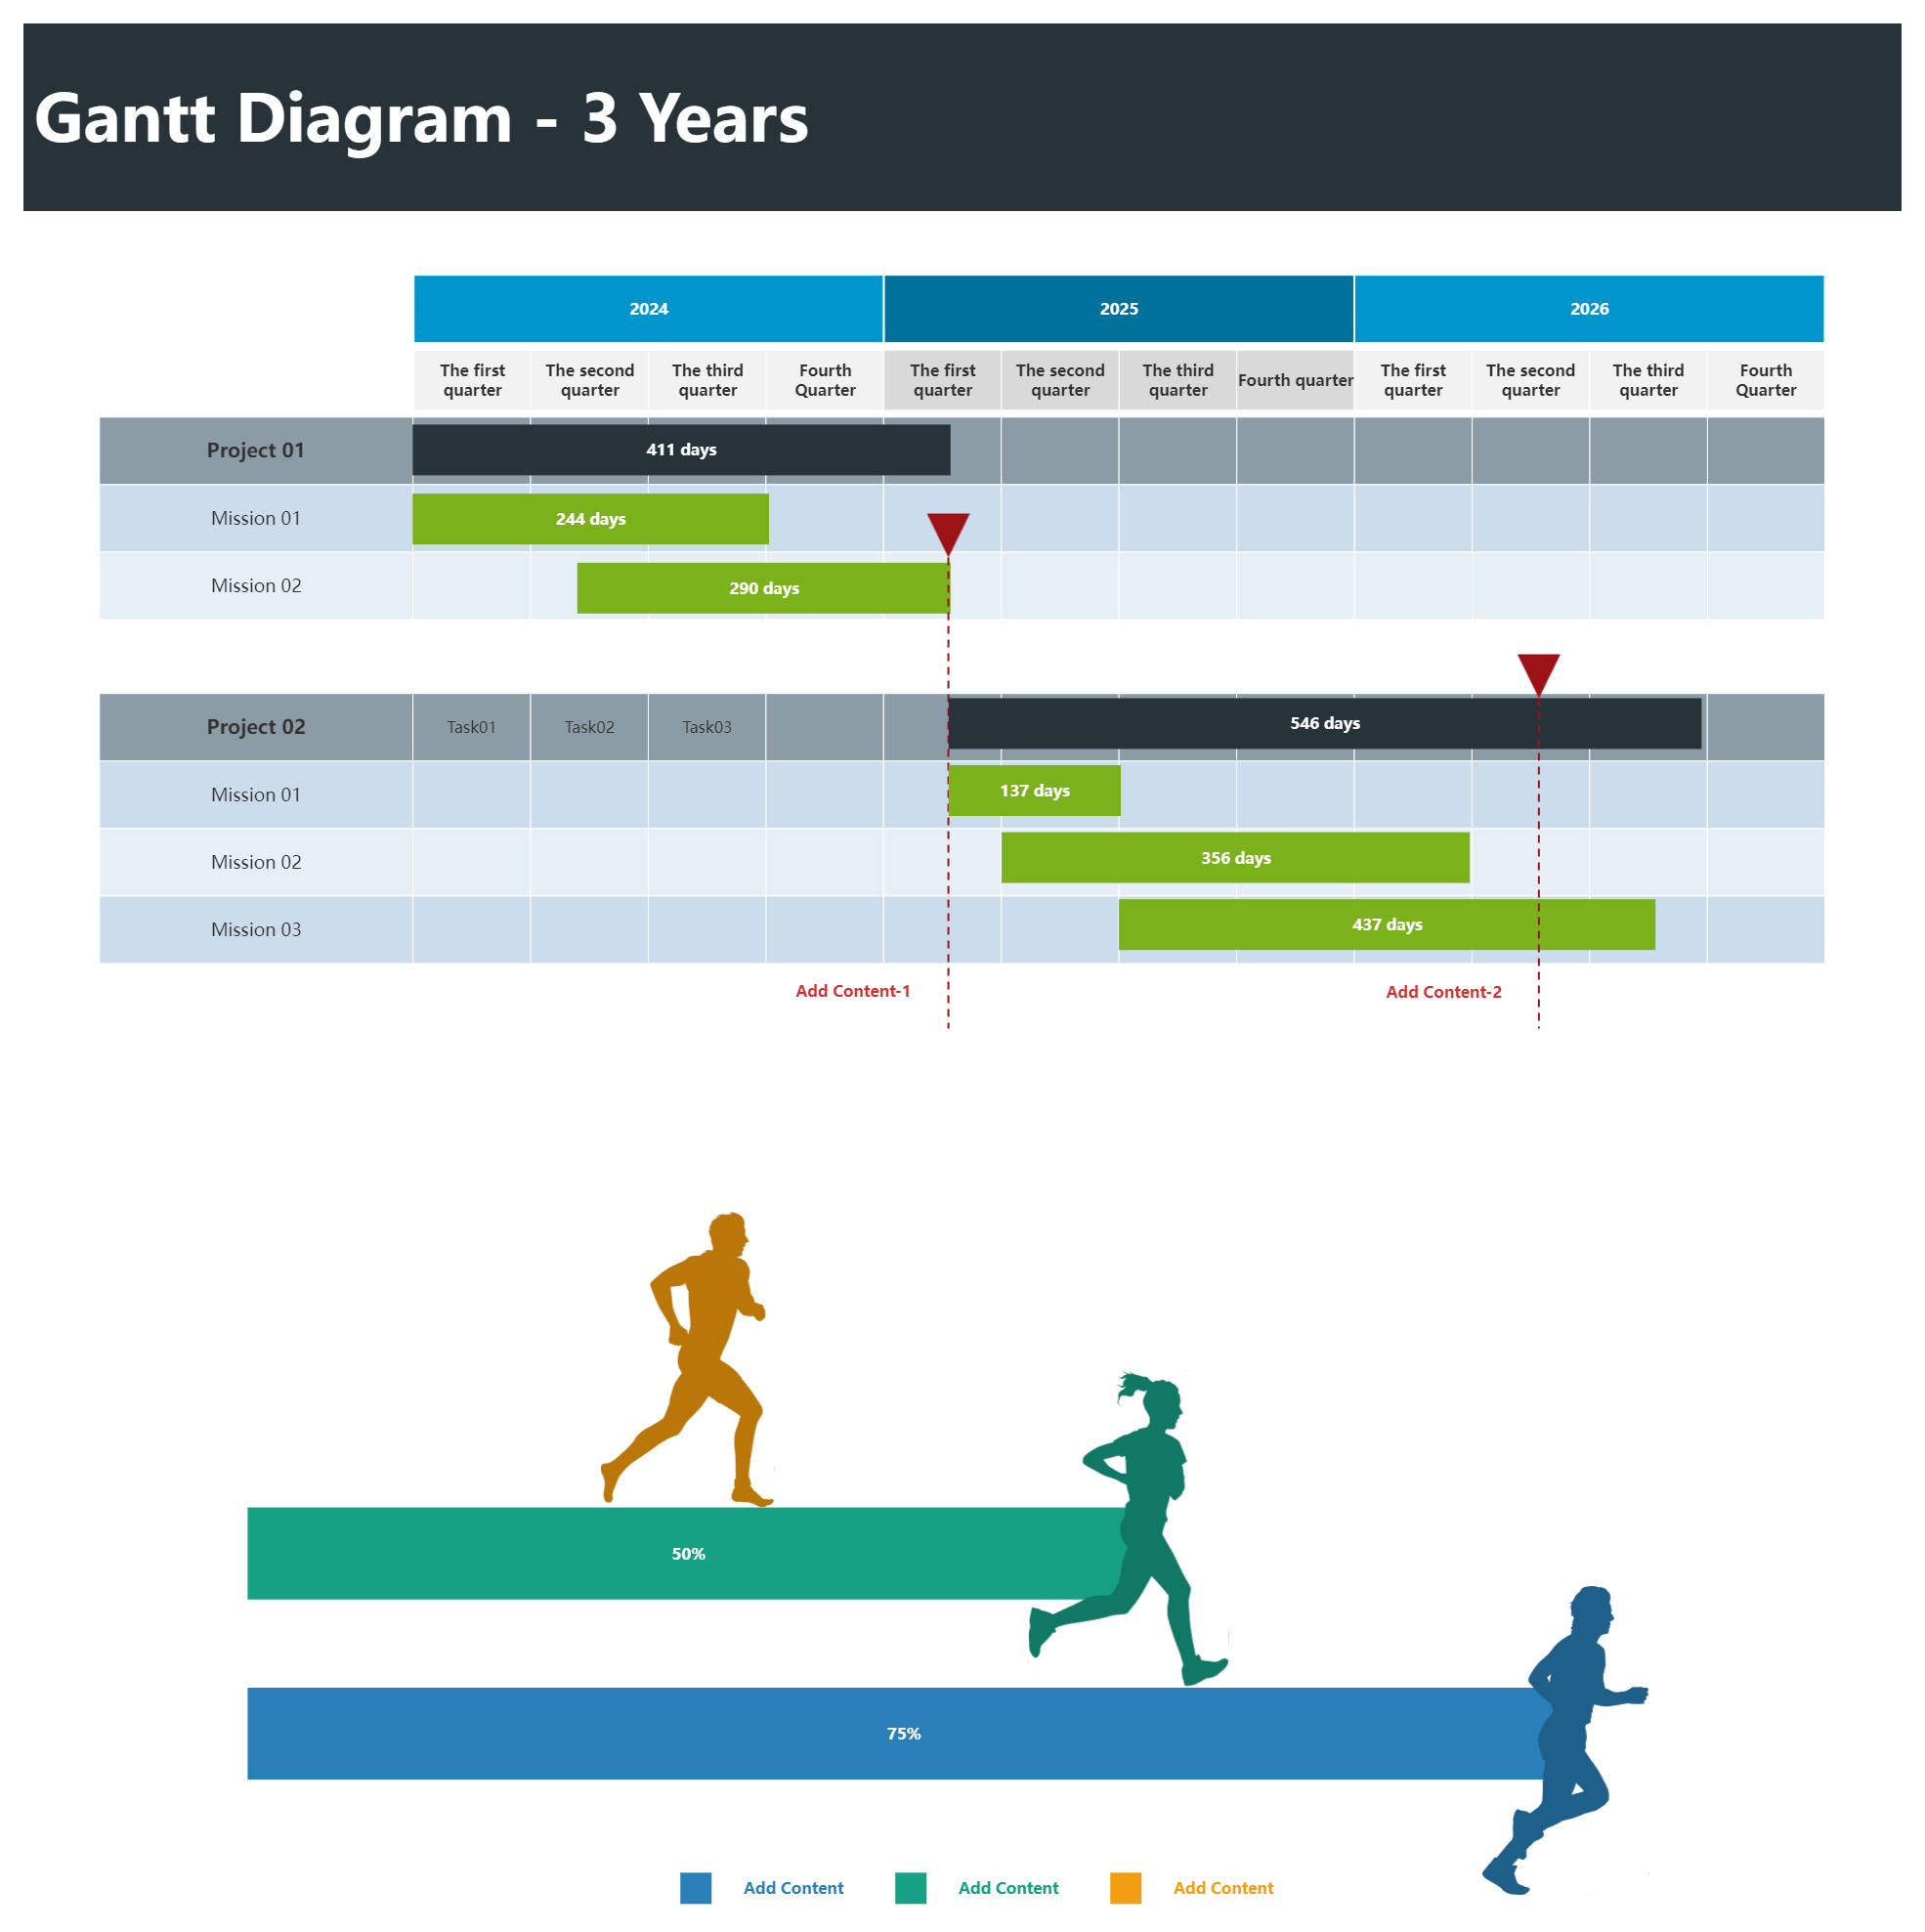
Horizontal column Gantt chart style template
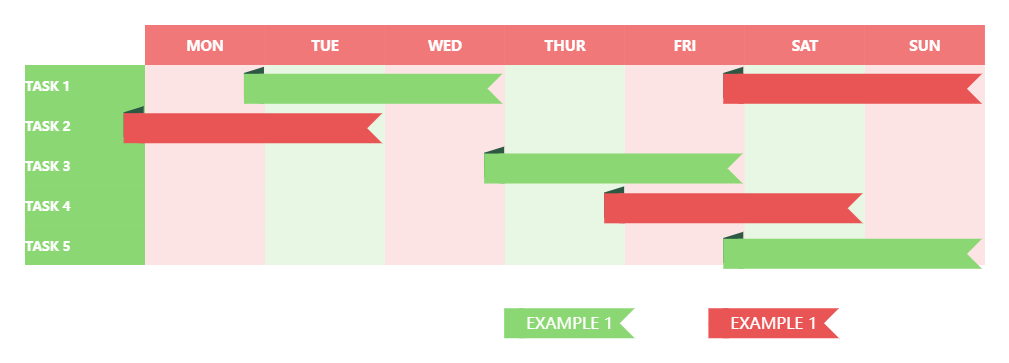
3D Gantt chart
Dependency Line Gantt Chart
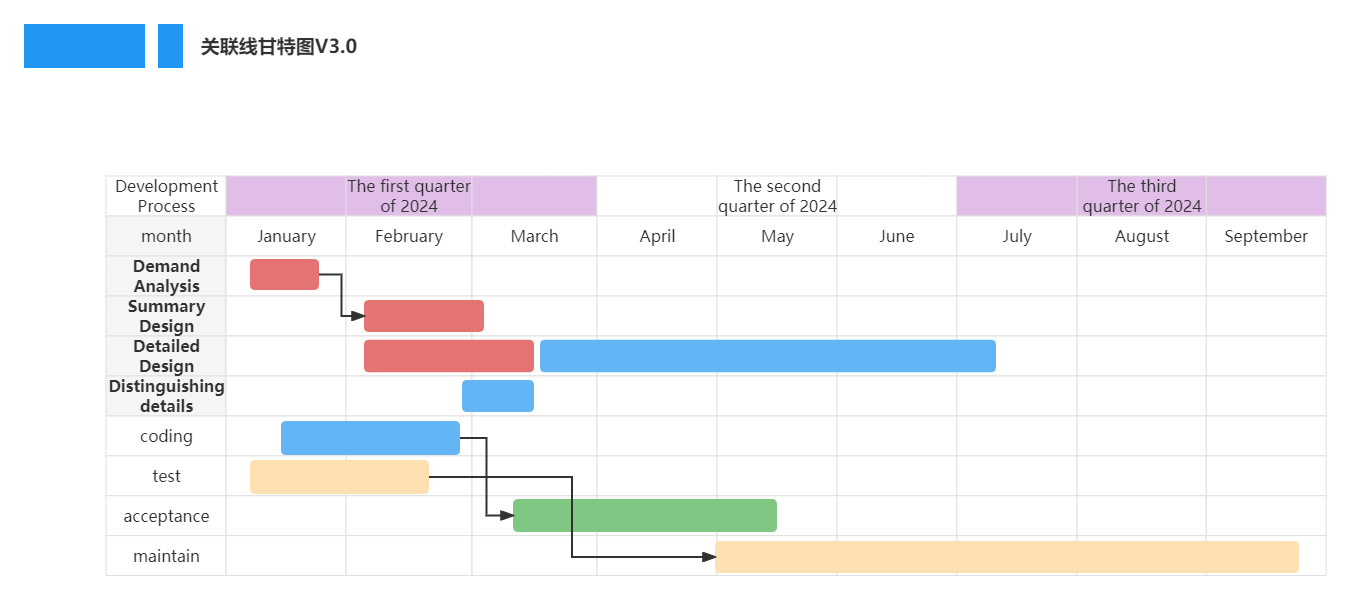
these Gantt charts? Do you think the project progress is very clear? When doing a project, you must ensure the maximum utilization of resources. Through the visual display of the Gantt chart, you can see at a glance what the project team members are doing at different times, without any blank periods.
If the project is not affected by other factors, then all the resources of the project are in this chart. Many people have a misunderstanding when making plans: drawing takes too much time and is a waste of time. In fact, drawing a Gantt chart will make your plan clearer and your goals more specific. As the saying goes, sharpening the knife does not delay the chopping of wood. In the long run, it saves time and facilitates the completion of the plan.
Gantt charts are applicable to many scenarios. ProcessOn template library has many Gantt chart templates published by users. You can go to ProcessOn template community to find templates suitable for your own use scenarios! Come and use them.