In our daily life and work, we can use a variety of different types of mind maps to solve different problems. Today we introduce to you 3 alternative structures of mind maps: organization chart, fishbone diagram, timeline, they all have their own independent use scenarios.
Why say that these 3 kinds of mind map structure is more alternative, because these 3 kinds of structure in the shape of the ordinary mind map has obvious differences in the actual production, both with the mind map tool to create, but also through the flow chart tool to create. The following use ProcessOn online mapping tool to explain and demonstrate to you.

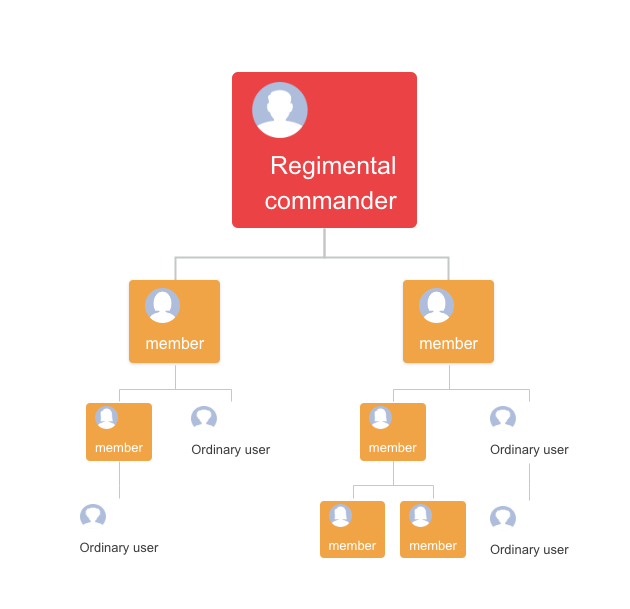
Head like an organization chart style template
An organization chart is a type of mind map used to show the structure of an organization. An organization chart usually consists of a series of nodes and relationships, with each node representing a department or position, and each relationship representing a subordinate relationship or workflow. By drawing an organization chart, we can better understand the structure of the organization and the division of responsibilities, and optimize the organizational structure and management style.

Organization chart style template
Tip:
When drawing an organization chart with avatars, you can organize all the avatars in advance and keep the same aspect ratio, so that after inserting the image, you can directly zoom in and out to make all the avatar images of uniform size.
Here are a few more organization chart templates drawn with ProcessOn mind mapping.

Organizational chart of R&D department
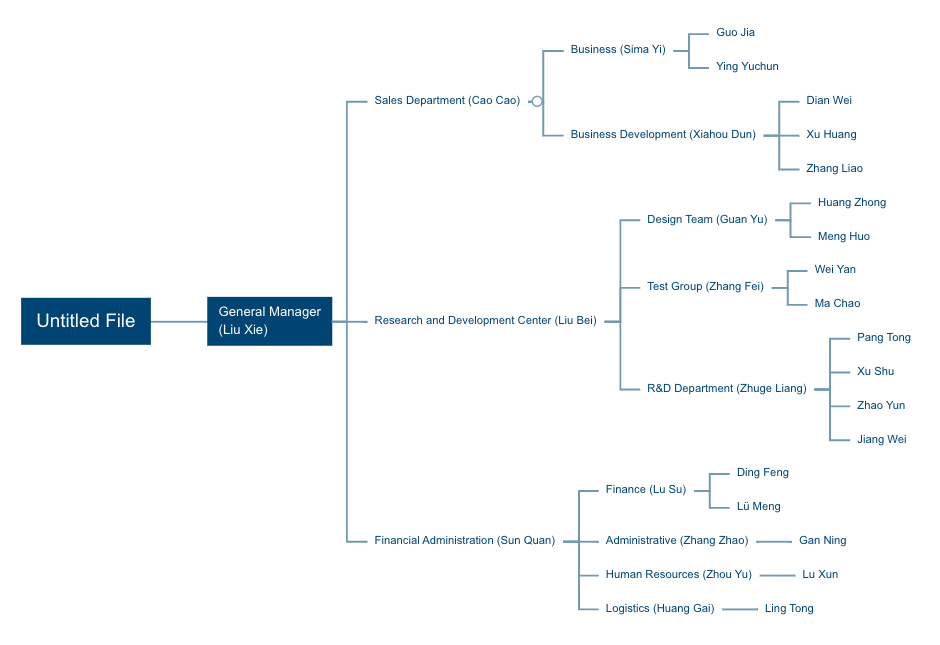
Organizational chart of the company
As shown above, using ProcessOn mind map drawn organizational chart style is fixed, only by adding or deleting nodes in the form of adding or deleting departments or the number of people, and there is a strict hierarchical relationship, and can only be a single line in series, cross-departmental or cross-level reporting on the performance of not very good, at this time you can use ProcessOn flowchart to draw the organizational chart, not much ado about it, on the map first.
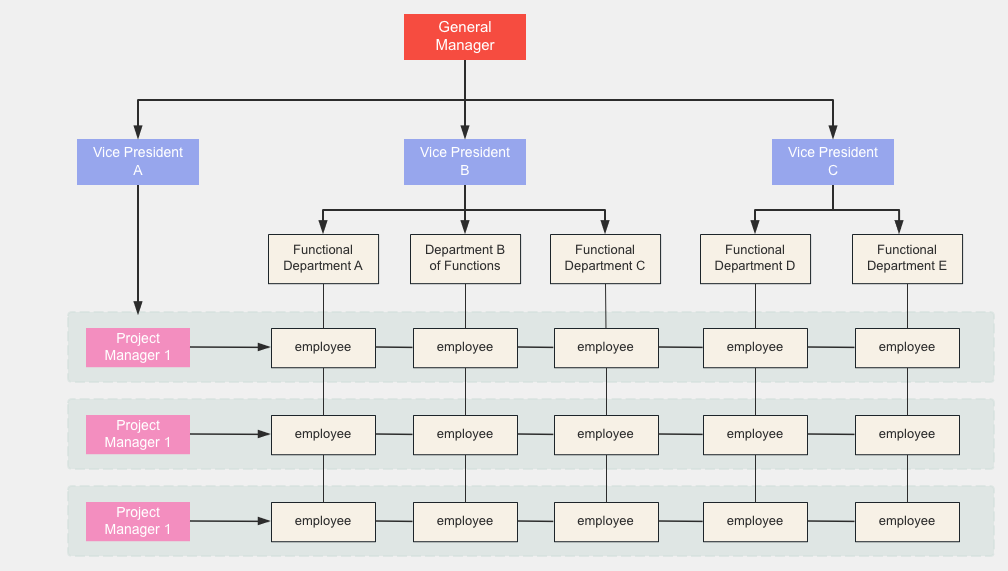
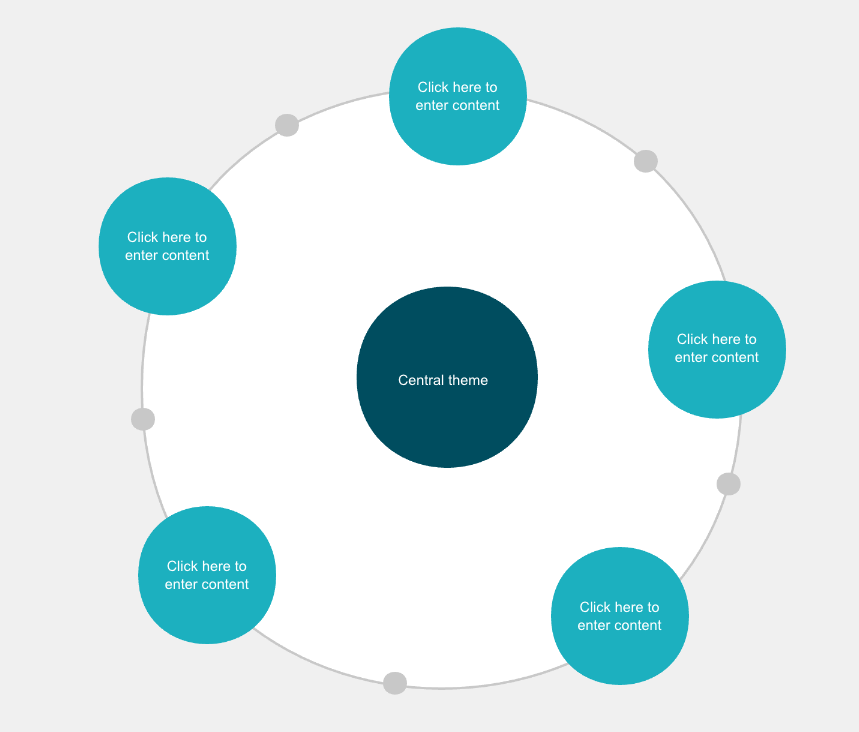
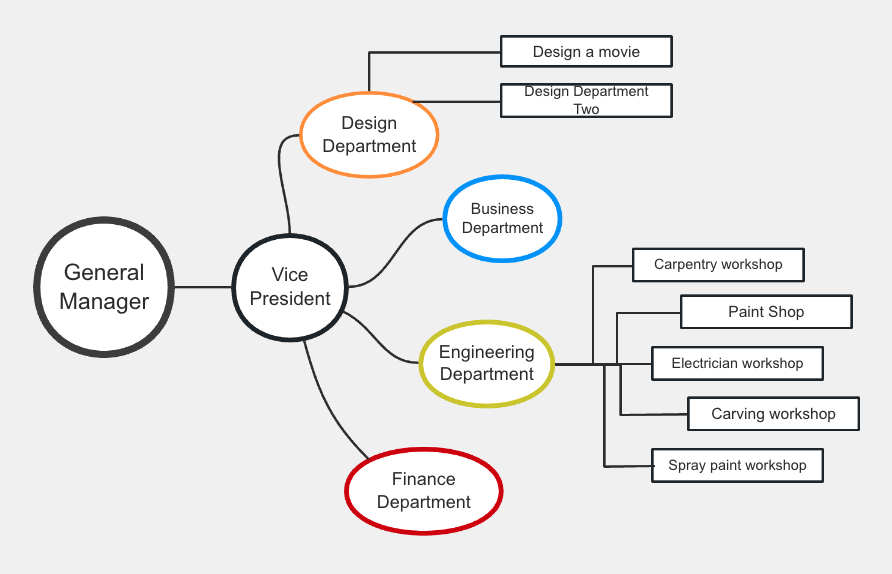
Look at the organization chart template above, you are not also think that the process map will be drawn up more freely, can play a larger space to adapt to the situation of different companies are very different. Here to share with you a few complex organization chart templates drawn with ProcessOn flowchart, this is not possible through the mind mapping tool.

Production-oriented enterprise management organization chart
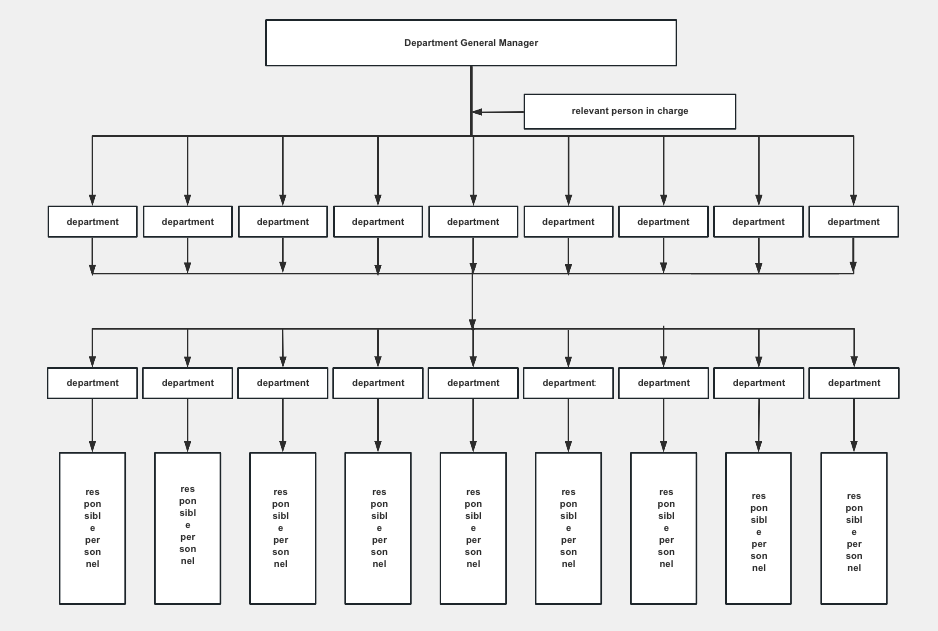
Department organizational chart
Fishbone diagram is a commonly used type of mind mapping, as the name suggests looks like the skeleton of a fish, the head and tail connected by a thick line, like a vertebrae. Fishbone diagram usually consists of a central theme and multiple branches, each branch represents a factor or reason related to the theme. Fishbone diagram has simple and practical, in-depth intuitive characteristics, through the drawing of fishbone diagram, we can better understand the nature of the problem, and find the best way to solve the problem.
Commonly used fishbone diagrams are cause-type fishbone diagram (fish head on the right) and countermeasure-type fishbone diagram (fish head on the left), which are used to analyze the problem and solve the problem.
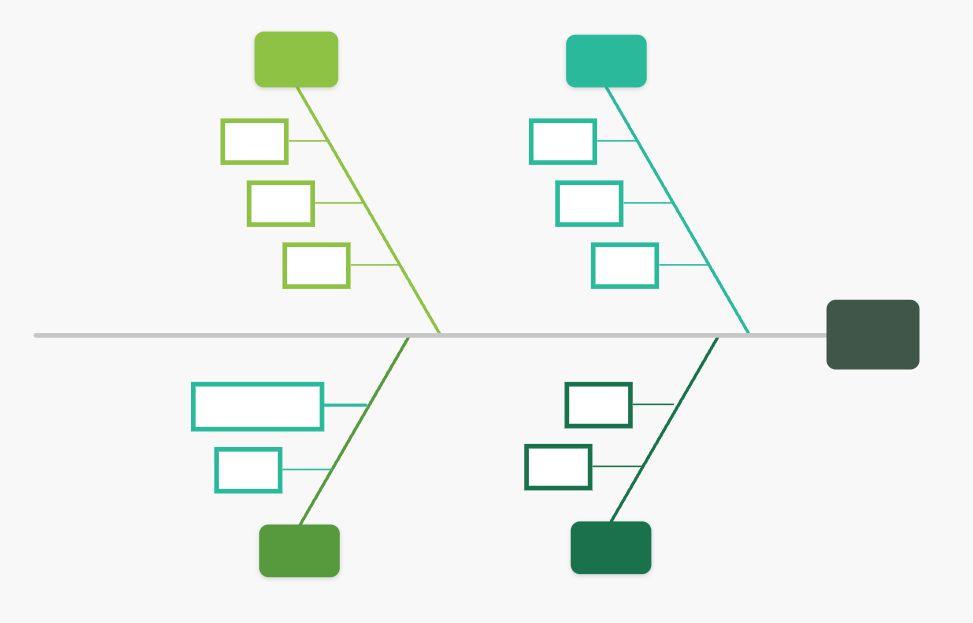
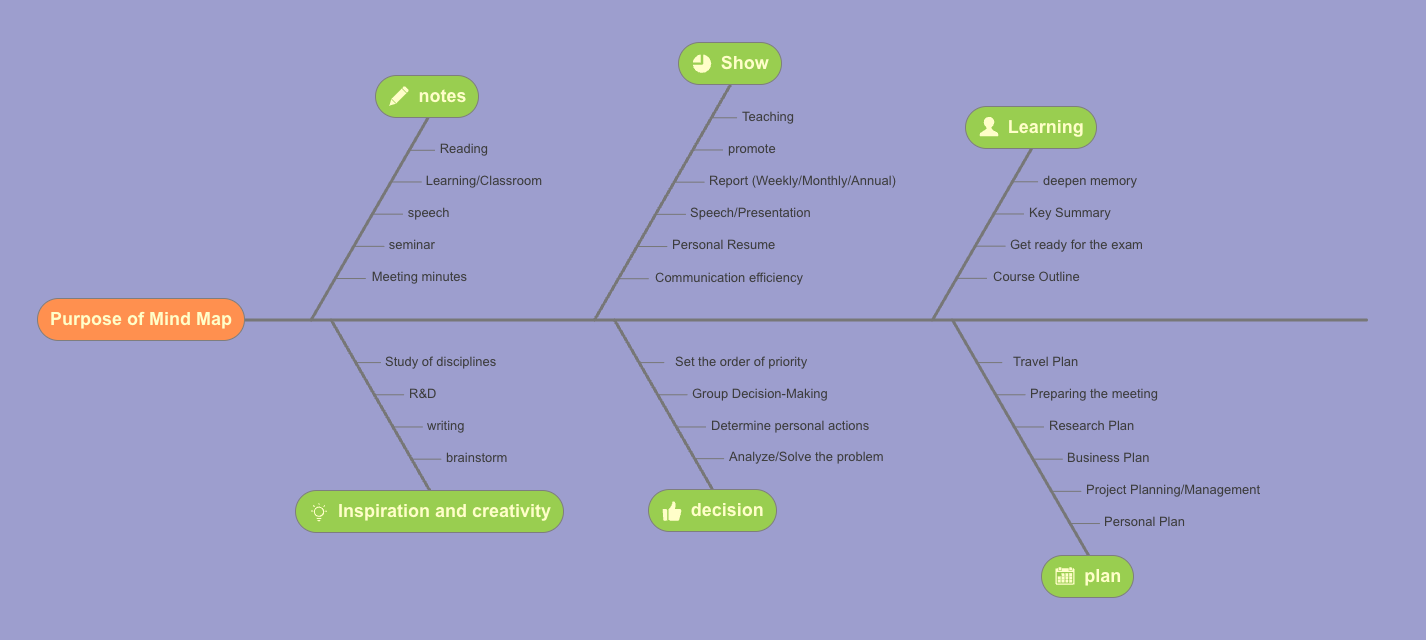
Fishbone diagram compared to ordinary mind map, the structure is more clear, in the face of a fixed scenario more can play their unique role, the following to share with you a few fishbone diagram templates drawn with ProcessOn mind map.

User anomaly analysis fishbone diagram
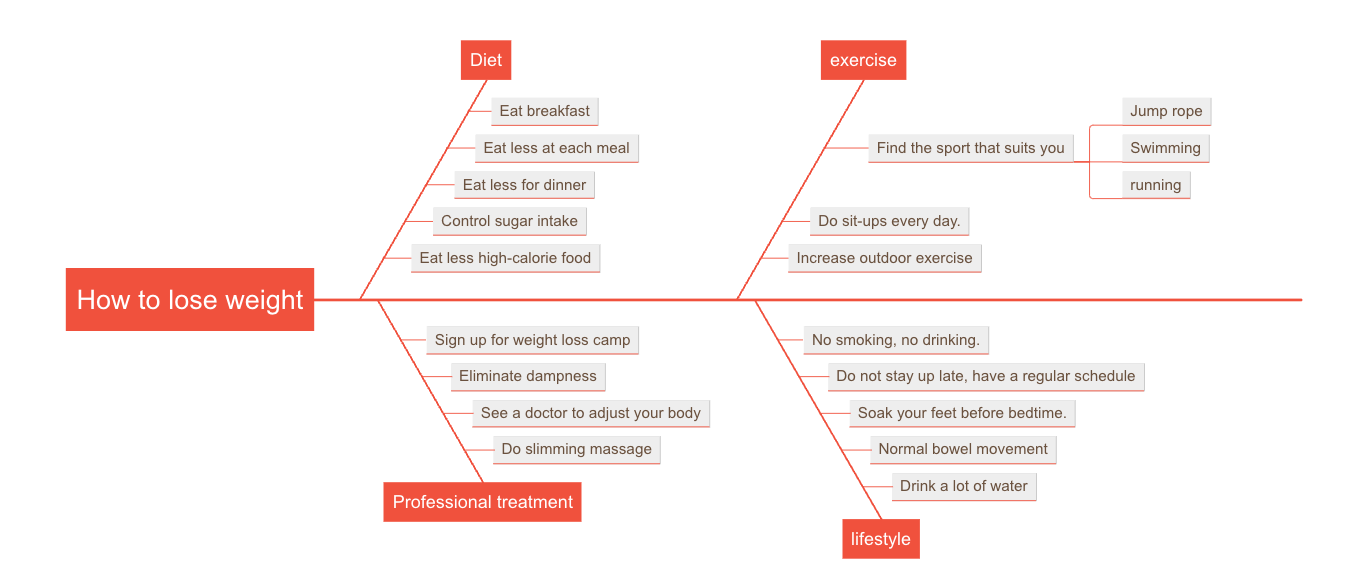
How to lose weight fishbone chart
Similarly, the fishbone diagram drawn with the mind map format is more fixed, less custom elements, when you have personalized needs, you can use ProcessOn flowchart to draw a personalized fishbone diagram, the following to share with you a few fishbone diagram templates drawn with ProcessOn flowchart.

(Big fish shape) Fishbone drawing style template
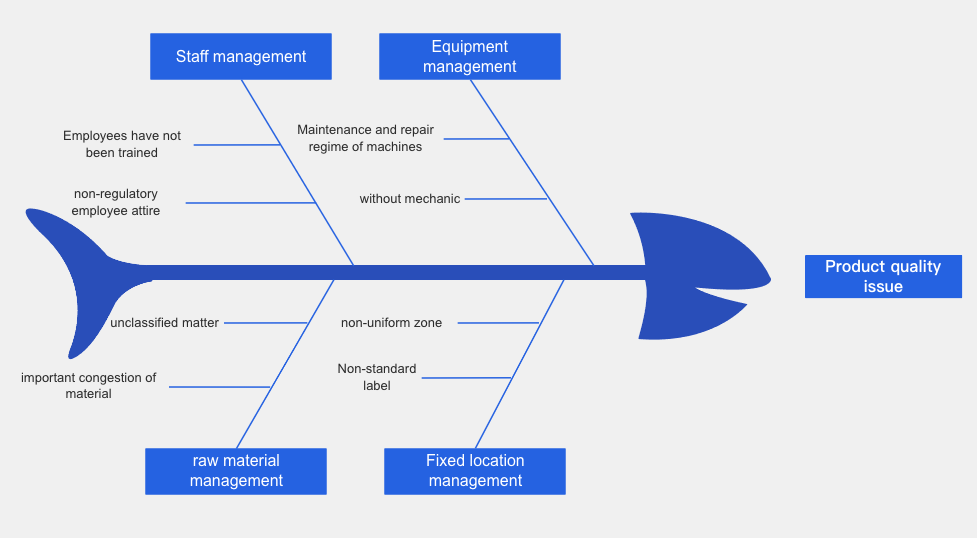
Creative fishbone pattern template
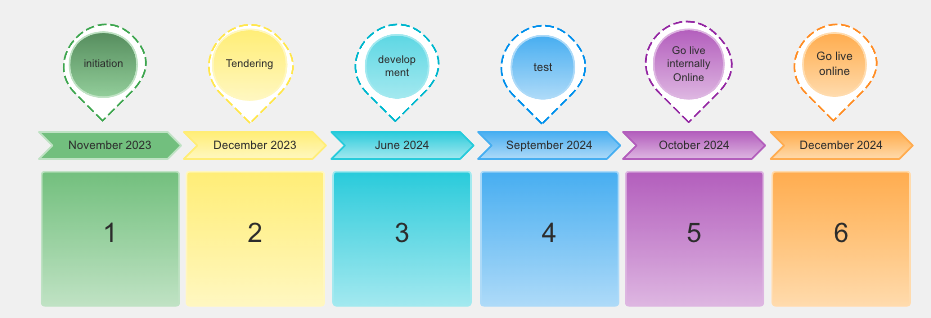
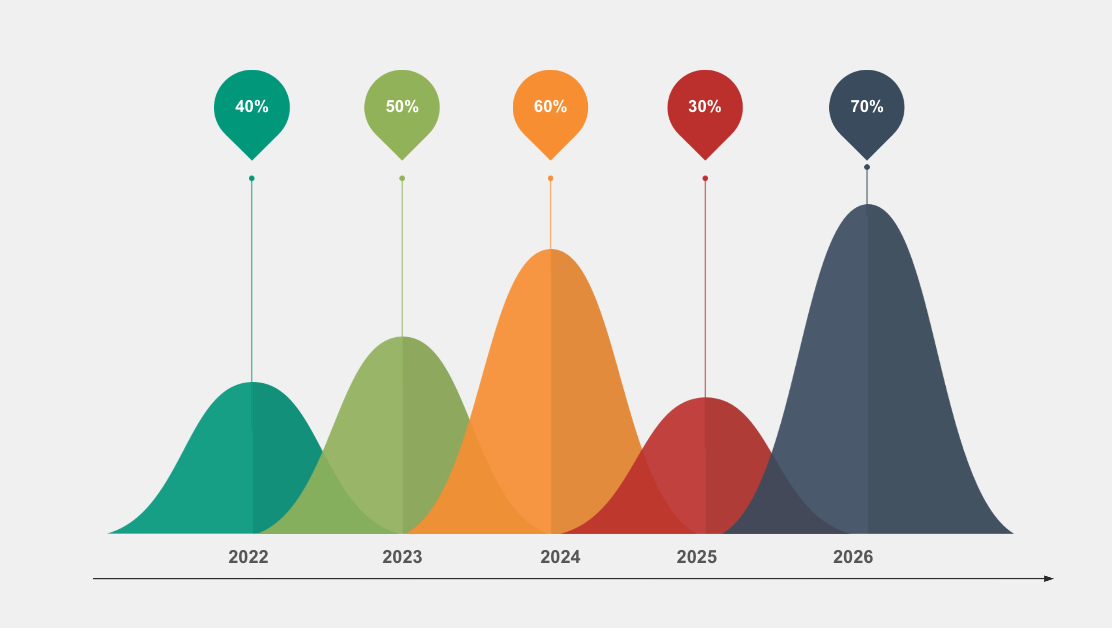
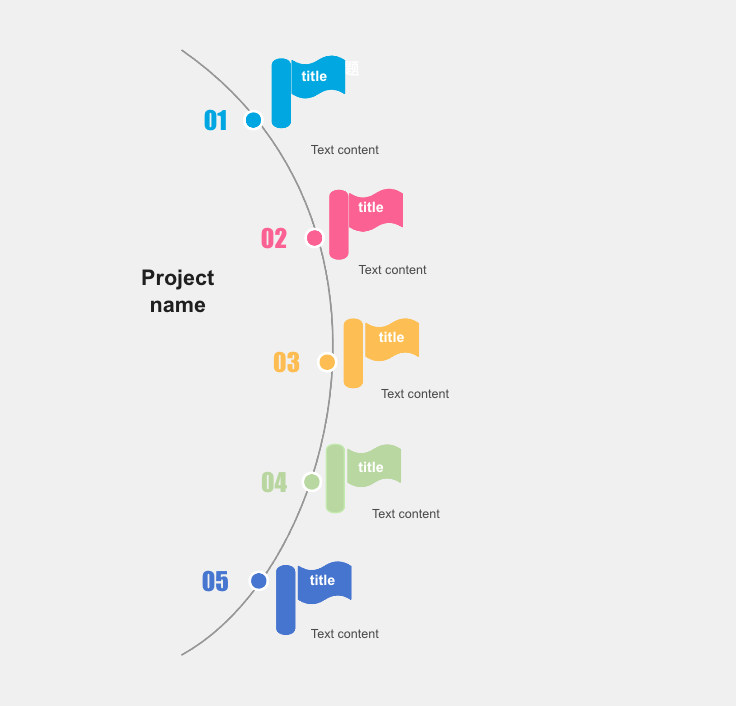
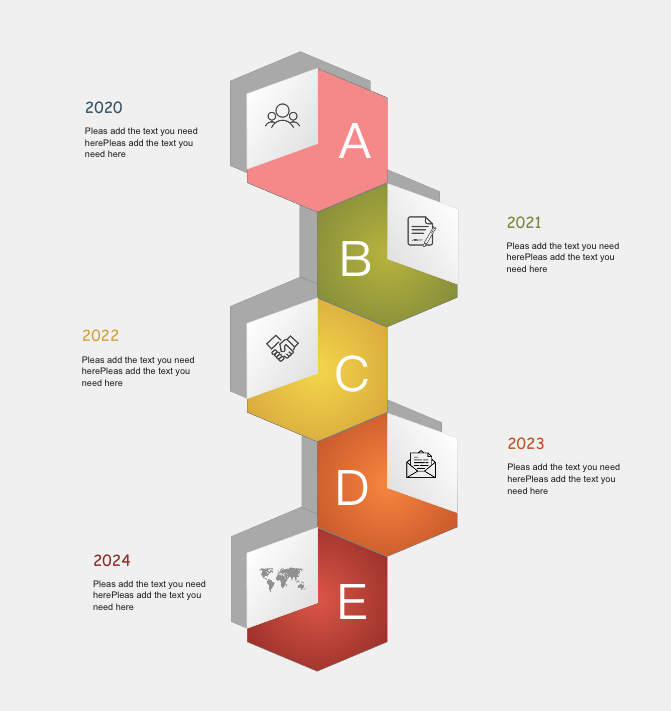
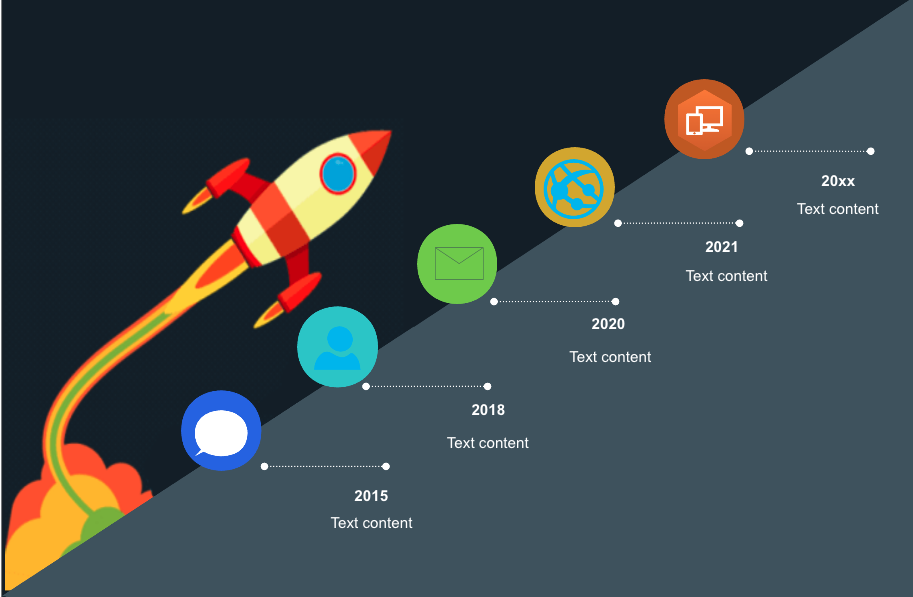
A timeline is a type of mind map used to show the progression of events, usually consisting of a series of dates and events, each represented by a node. By drawing a timeline, we can better understand the course of events and spot patterns and trends.

Creative fishbone pattern template

Enterprise development timeline
The timeline style drawn with a mind map is relatively single, and the flow can only be linear, when you need to draw a complex timeline, or when the flow is variable, or when there are other personalized needs, you can use ProcessOn Flowchart to draw a timeline.
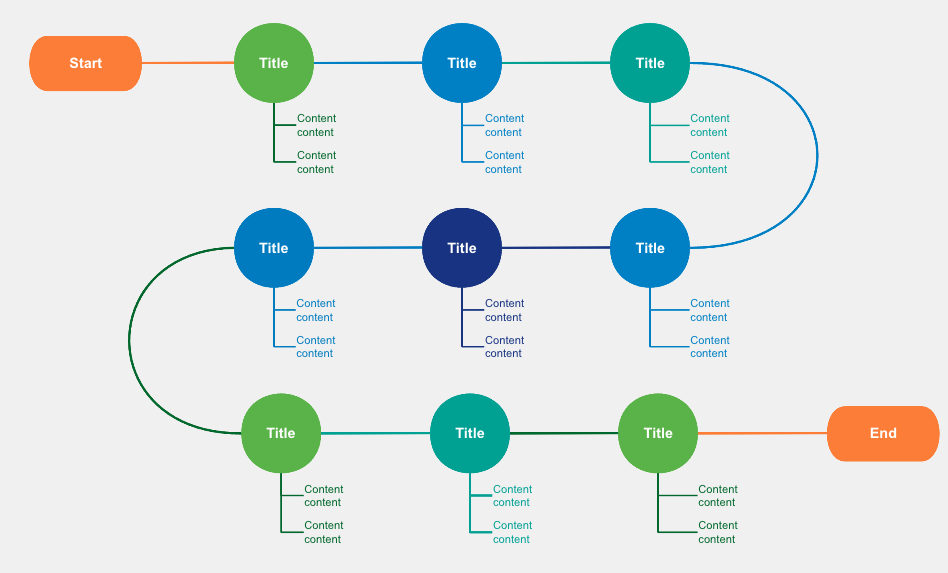
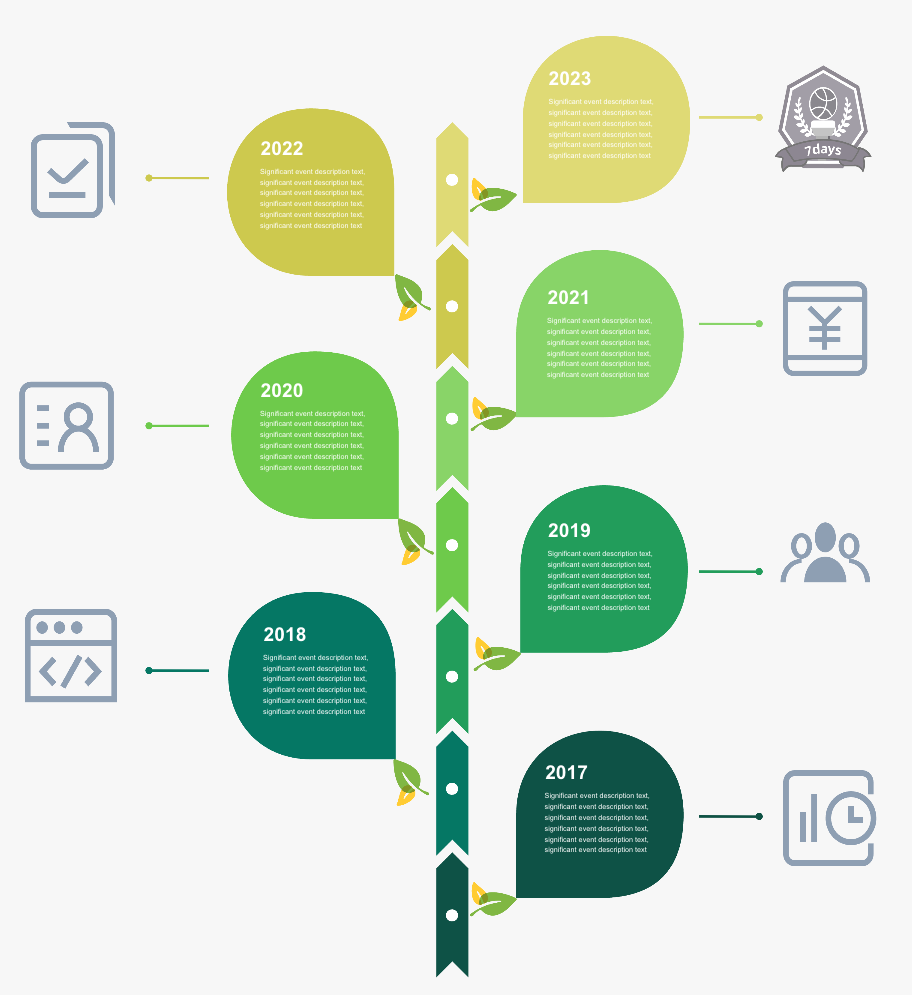

After reading this content, do you also think that these 3 kinds of mind map structure is indeed very alternative?ProcessOn template community has nearly a million high-quality templates shared by the creators, you can come here to share your work, you can also learn from other people's drawing skills, open the creative ideas.