

The timeline connects past, present, and future events in a linear arrangement to form a clear time context. It can be used in a variety of scenarios such as recording history, project planning, and sorting out major corporate events.
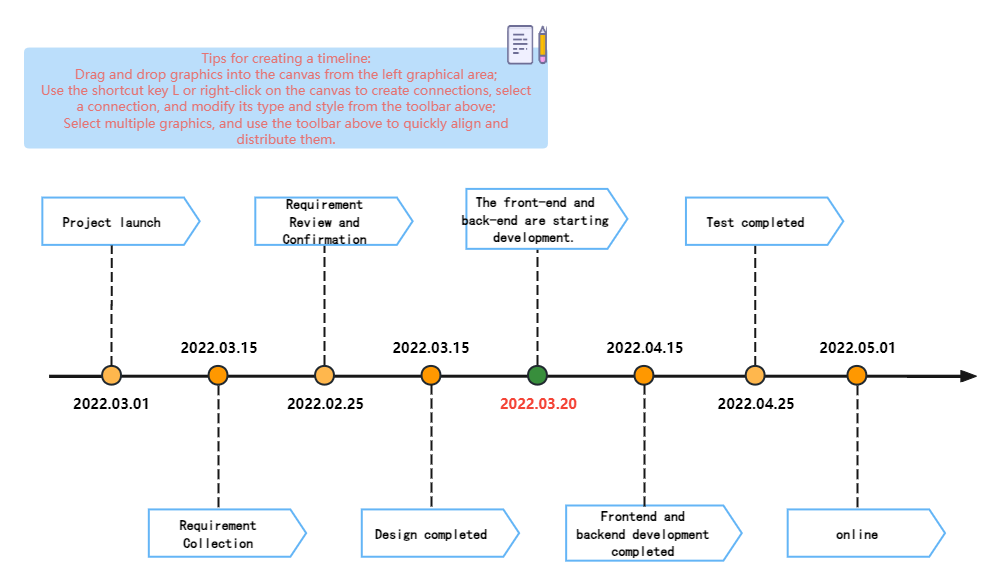
1. Timeline trunk
Time track: The main trunk of the timeline is usually a straight line or time track, which is used to represent the continuity and passage of time. This line can be horizontal or vertical, depending on actual needs and reading habits.
2. Time stamp
Time points: On the timeline, key time points will be clearly marked. These time points can be specific dates, years, or symbolic time periods (such as "ancient times", "modern times", etc.). Time points can be marked in a variety of ways, and can be represented by circles, rectangles, asterisks, and other graphics.
Time interval: Time intervals are usually marked on the time axis to indicate the distance and relative position between different time points. The time intervals can be equal in length or can be adjusted according to actual needs.
3. Event display
Event content: At the corresponding time point on the timeline, the event content related to that time point will be displayed. These contents can be text descriptions, pictures, icons, etc., which are used to explain the occurrence, development and impact of the event in detail.
Event association: Events on the timeline are not isolated, and there is often some kind of association or causal relationship between them. This association can be represented by lines, arrows and other graphics to help people better understand the logical relationship between events.
4. Auxiliary elements
Notes and descriptions: To enhance the readability and understanding of the timeline, you can add notes and descriptions to the timeline. These notes and descriptions can provide additional explanations of time points and event content to help readers better understand the content of the timeline.
Headings and sections: For longer timelines, you can add headings and sections to divide different time periods or subject areas, making the timeline structure clearer and more organized.
1. Historical research
The timeline can be used to sort out and display the context of historical events, making it easier to remember the order and background of historical events, while helping to understand the laws and trends of historical development.
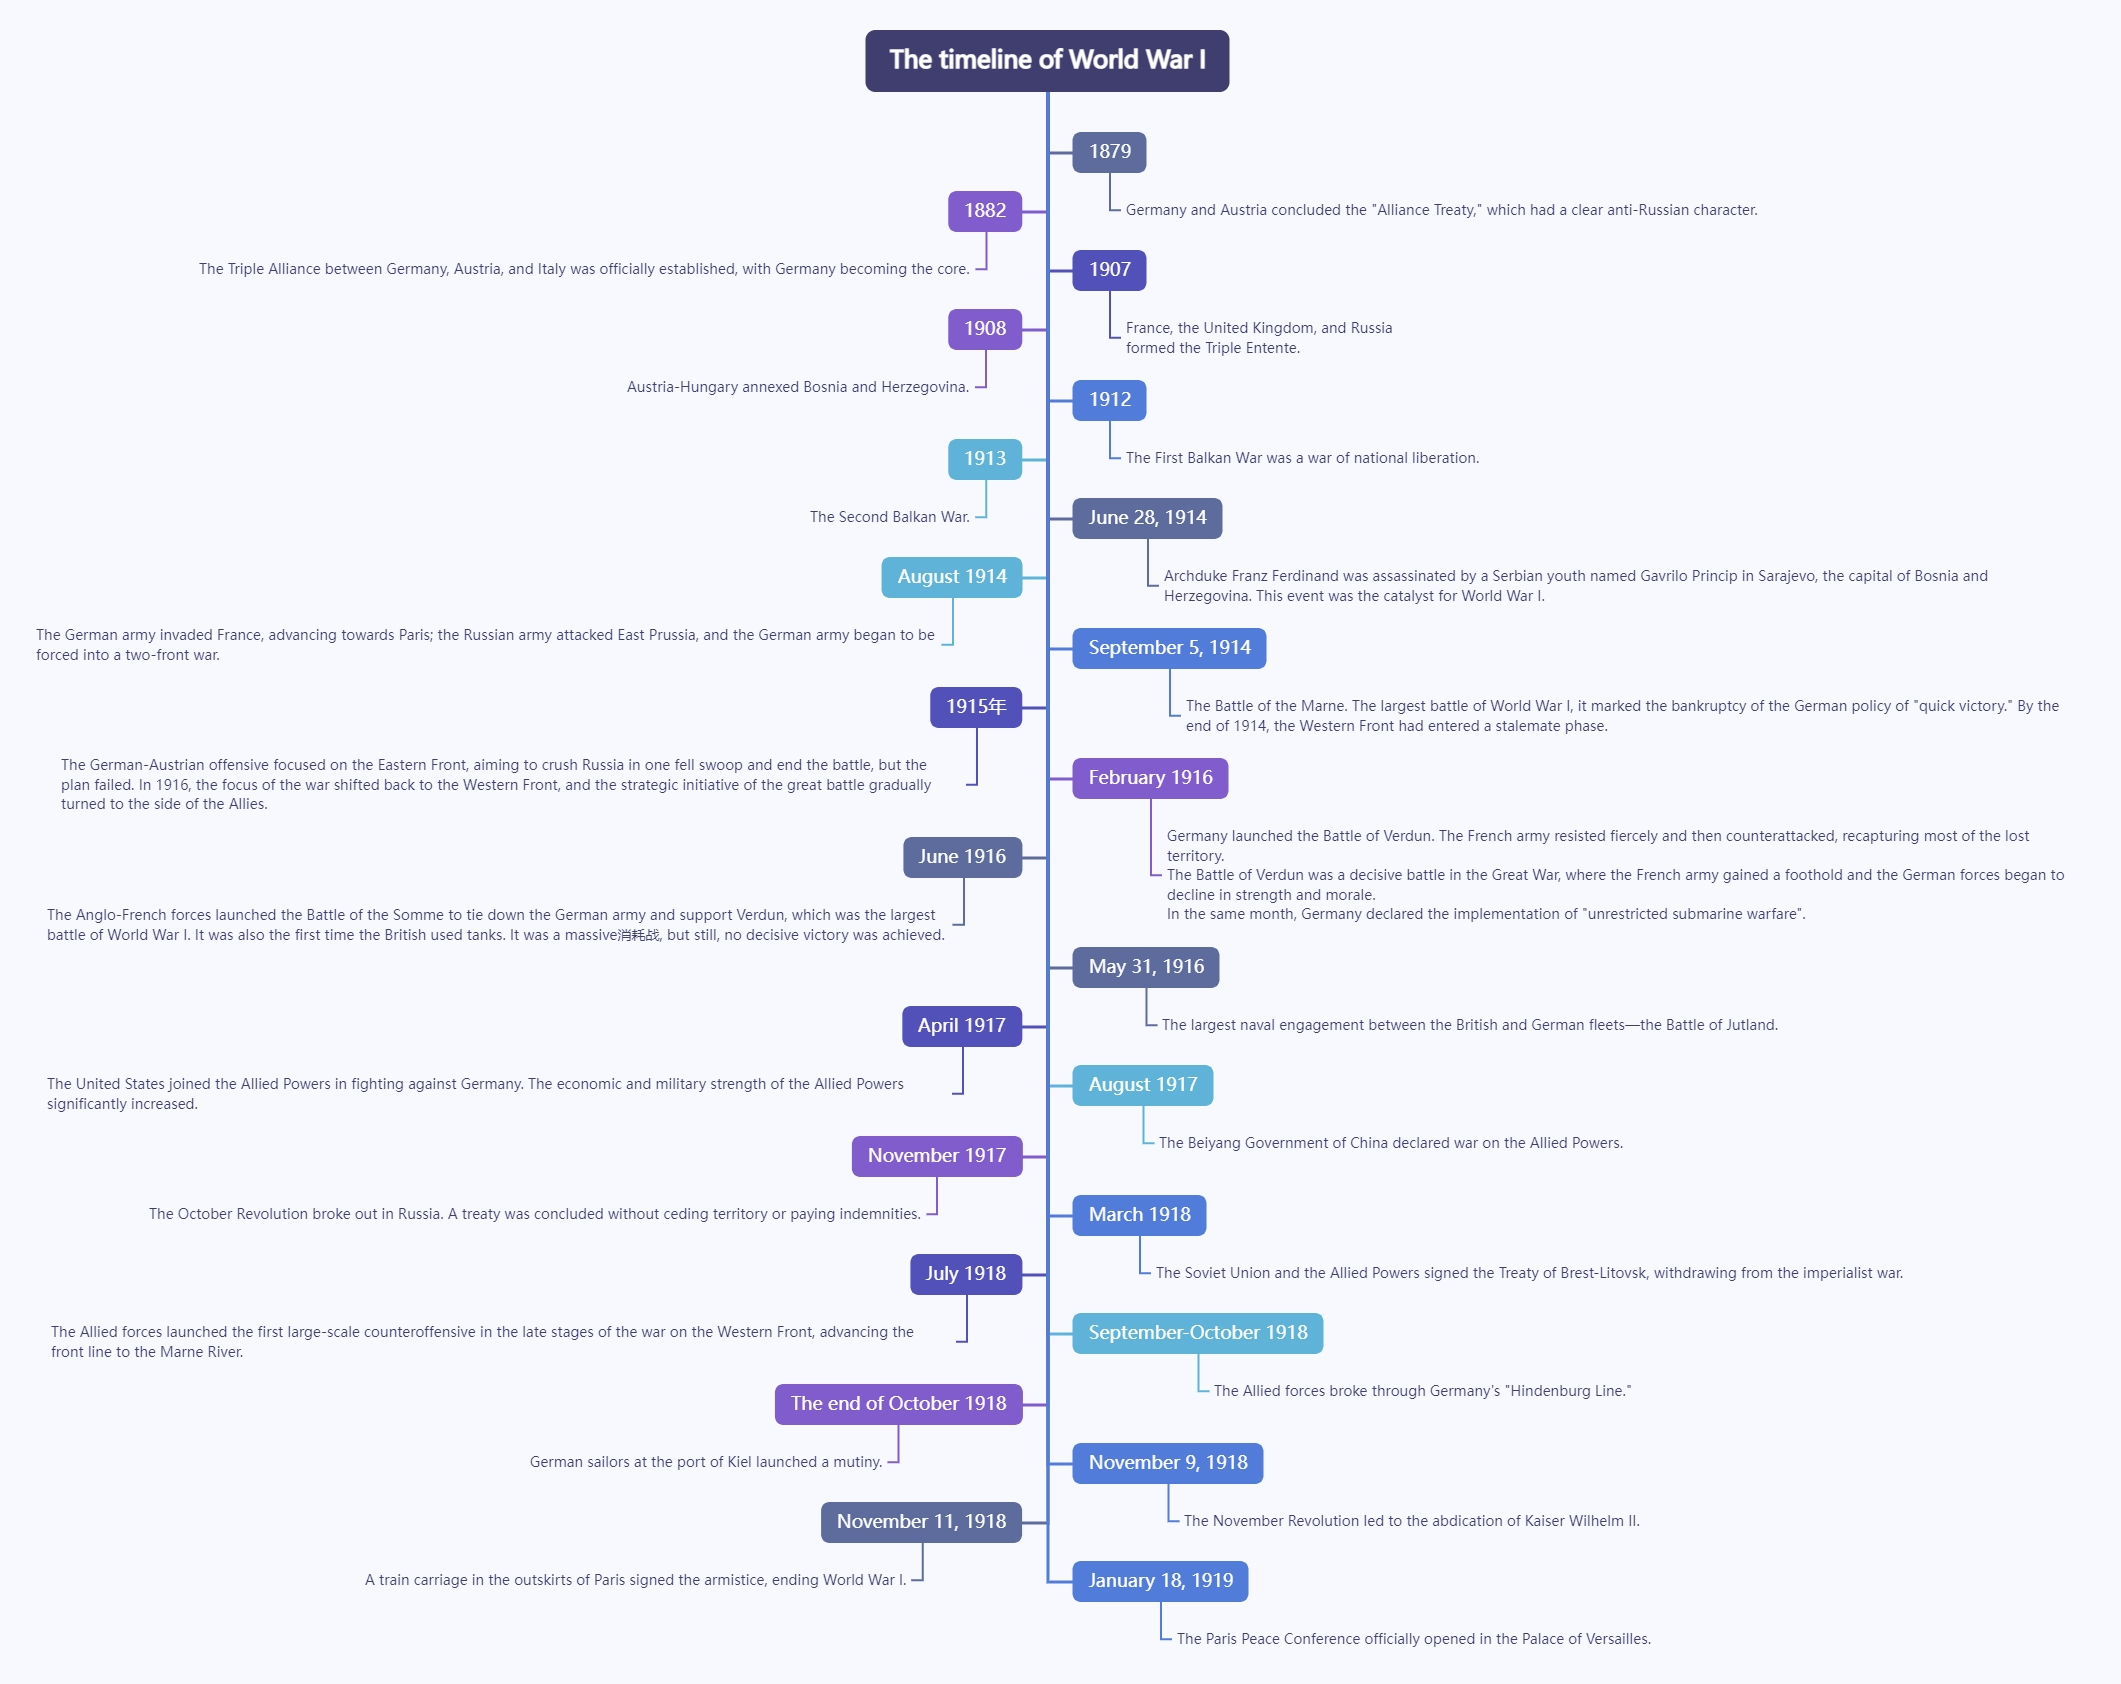
Major historical events before and after World War I
2. Work Planning
Timelines are widely used to plan work progress and schedule tasks. Through the timeline, the team can clearly understand the overall progress, milestones, task allocation, etc. of the work to ensure that the work is completed on time.

Pre-job training process timeline
3. Corporate Exhibition
Companies can use timelines to showcase their development history and important milestones, such as founding date, important product launches, major collaborations, etc. This helps enhance the company's brand image and sense of history.
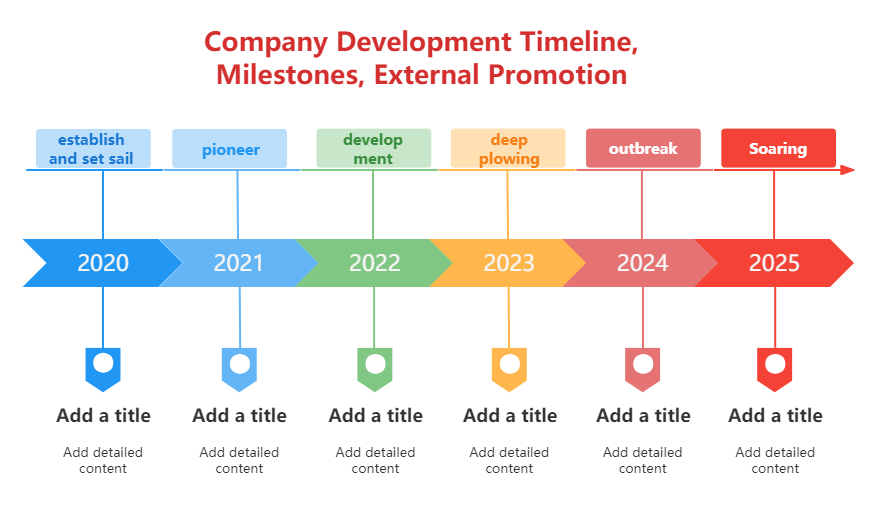
Timeline of company development events
Timeline has many other application scenarios, such as describing scientific phenomena or the process of experimental research, recording important moments and events in personal life, sorting out case processes in the legal industry, etc.
So how do you draw the timeline specifically? Here I will share how to use ProcessOn to draw the timeline.
ProcessOn's mind map or flowchart both support drawing timelines. Mind maps have built-in timeline structures, which are more convenient to operate. You only need to fill in text and key information; flowcharts have greater freedom in drawing timelines and support more personalized editing needs.
1. Draw a timeline with a mind map
First, go to the ProcessOn personal file page, click New in the upper left corner - Mind Map, enter the editor, click "Structure" in the right toolbar, and switch to the timeline structure. Use the shortcut key Enter to create the main branch of the timeline, and Tab to create a sub-branch of the main branch.
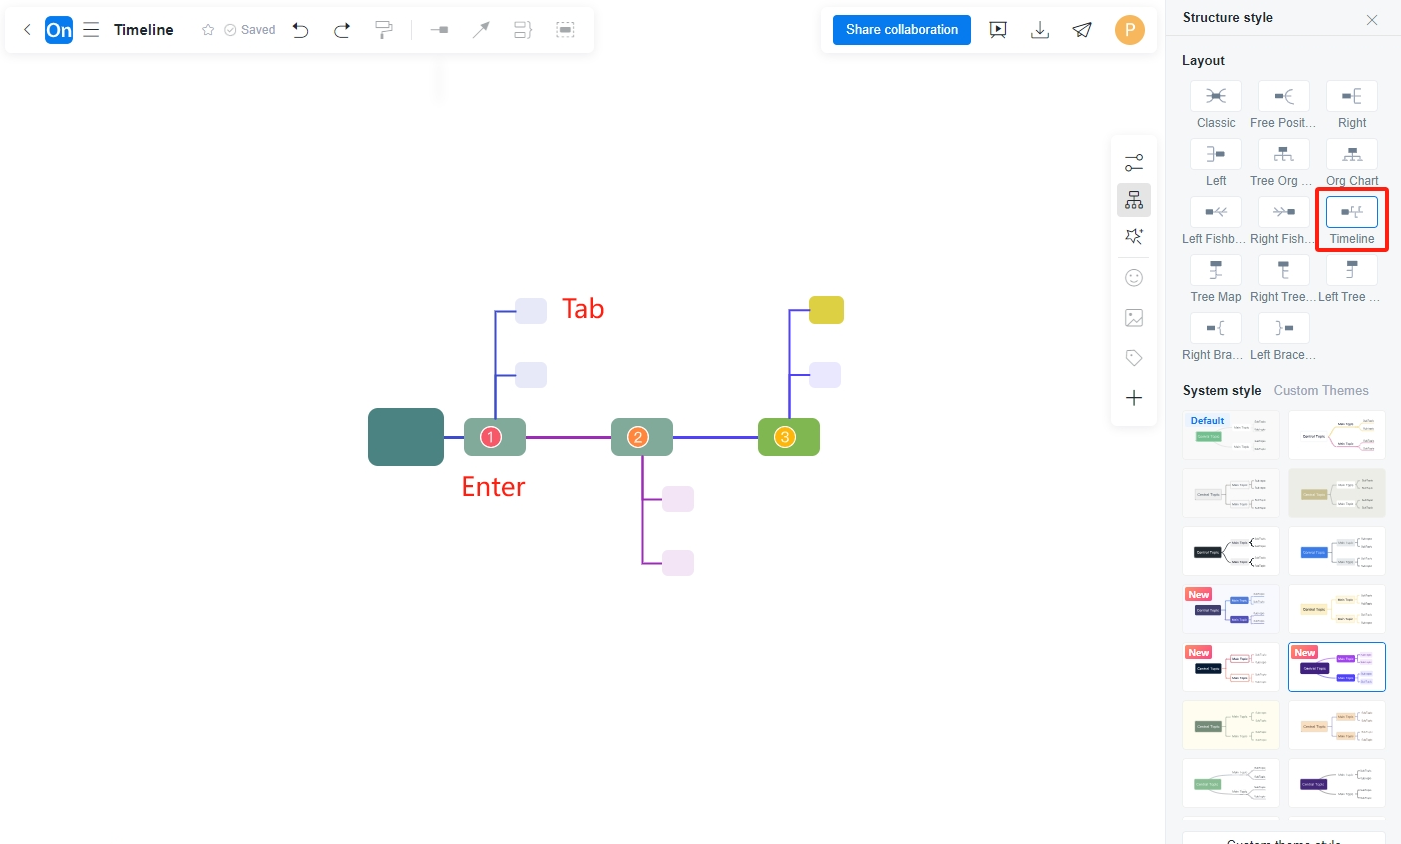
You can insert elements such as icons or pictures at time nodes or events to enrich the visibility and appearance of the timeline.
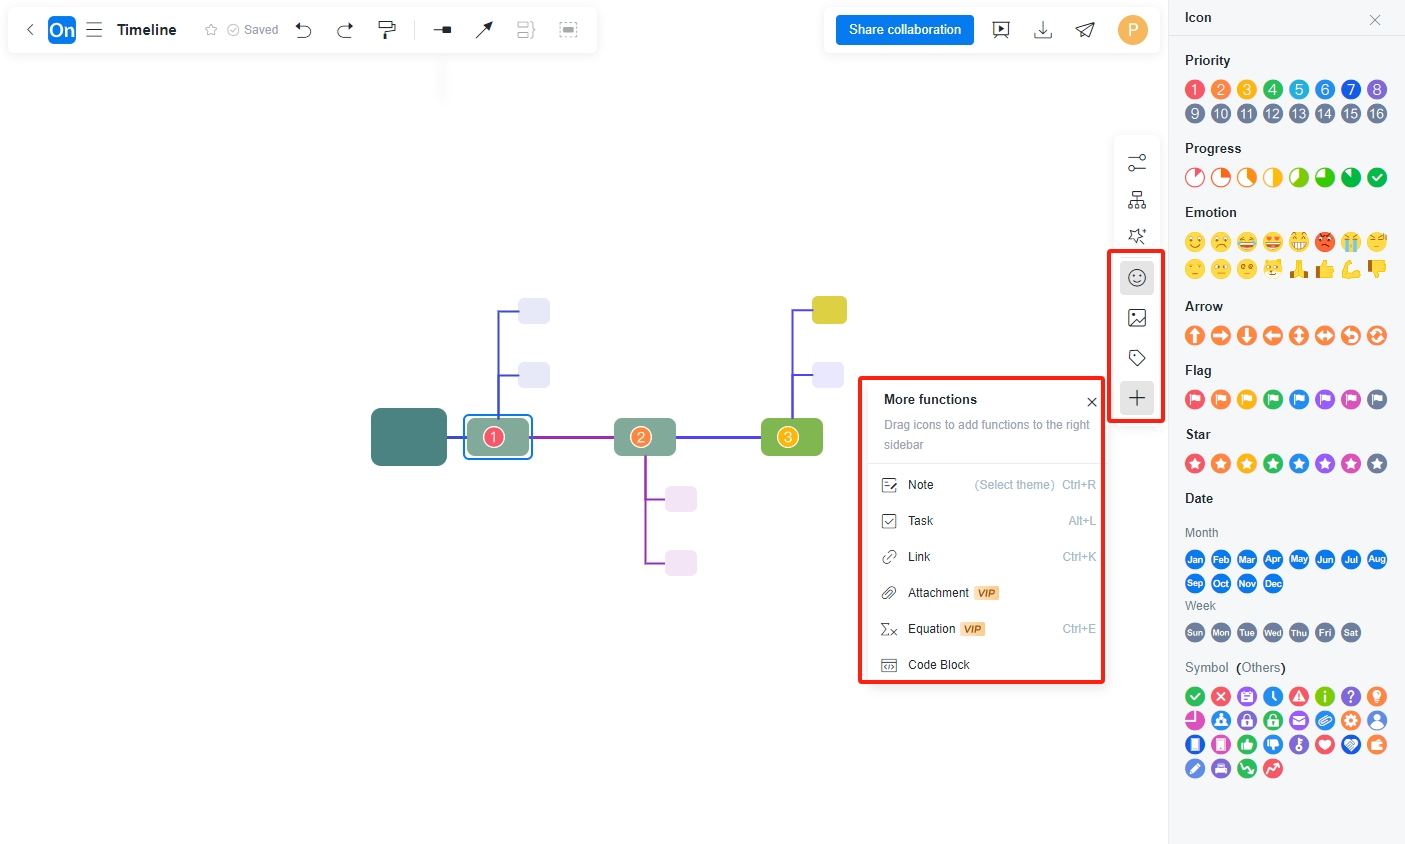
The advantage of drawing a timeline using a mind map is that it is simple and efficient. The structure of the timeline has been fixed for you in the mind map editor. You only need to use shortcut keys to continuously create multi-level timeline nodes without excessive typesetting and layout.
2. Draw the timeline of the flowchart
First, go to the ProcessOn personal file page and click New - Flowchart in the upper left corner.
Drag arrows, circles and other elements from the graphics library on the left to the canvas and stitch them into a timeline according to your needs. The top toolbar supports modifying the style of text, graphics and lines, including font, size, color, etc.
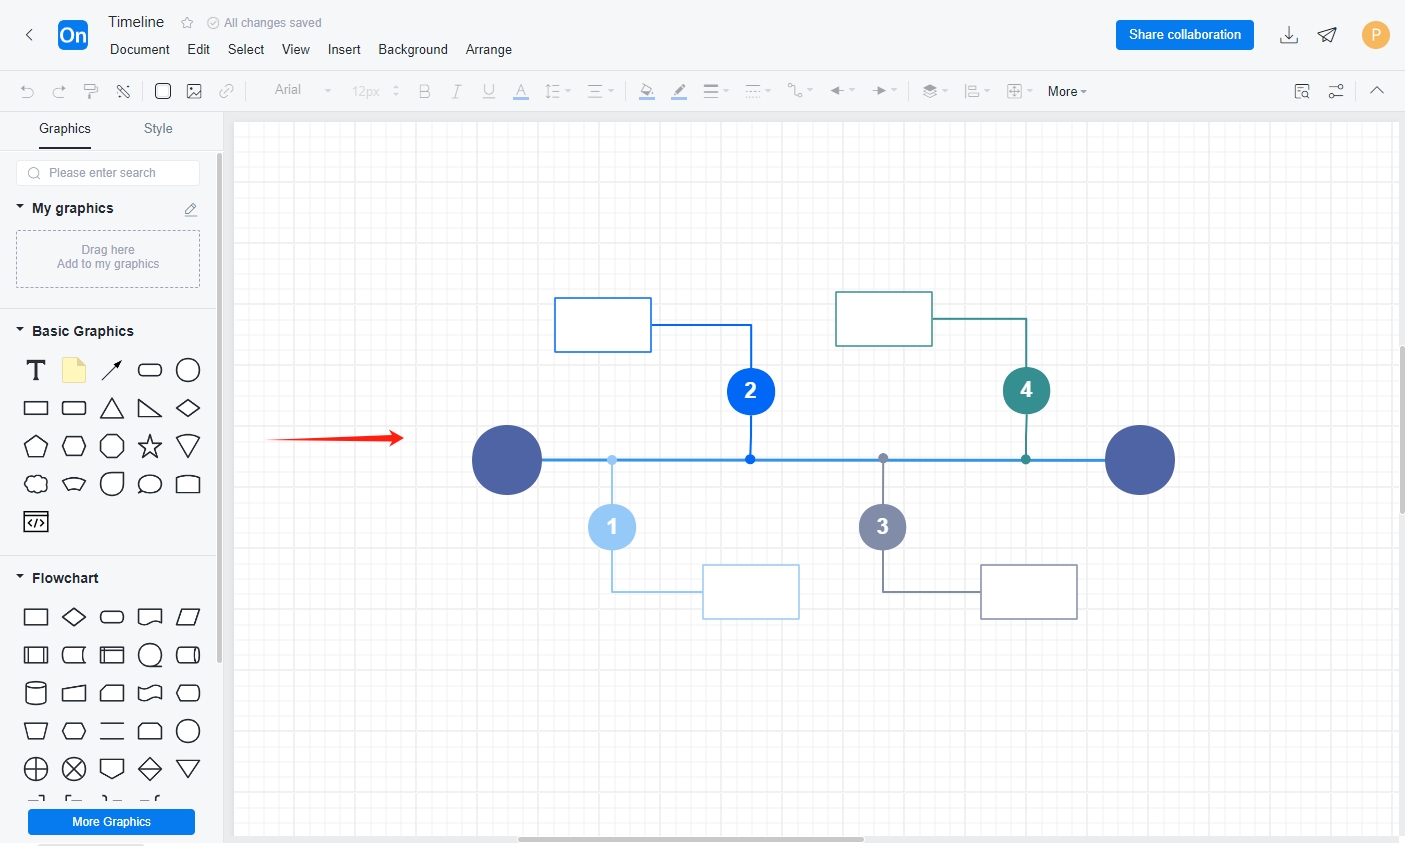
The advantage of drawing a timeline for a flowchart is that it provides a large number of icons, and the drawing process is very free, so a timeline with a complex layout or style can be completed.
After reading the above article, I believe you have a deep understanding of the concept and drawing of the timeline. Then come and experience making a timeline! → Go to ProcessOn to draw a timeline .