

Activity Diagram is an important behavior modeling tool in UML ( Unified Modeling Language ) . It is mainly used to describe a series of activities or operations in a system or business process. It emphasizes the control flow between objects, can clearly show how a series of activities or operations are executed in a specific order, and supports the representation of concurrency and synchronization.
This article will mainly explain the practical application and drawing tutorial of UML activity diagram in software development.
Activity diagrams are widely used in software development, mainly in the following scenarios:
In the early stages of software development, UML activity diagrams are often used to describe and model an enterprise's business processes. Through activity diagrams, developers can clearly display the various steps, decision points, and tasks that are executed in parallel or serially in the business process. This helps team members better understand the business logic and ensure that the software functions are consistent with the actual business process .
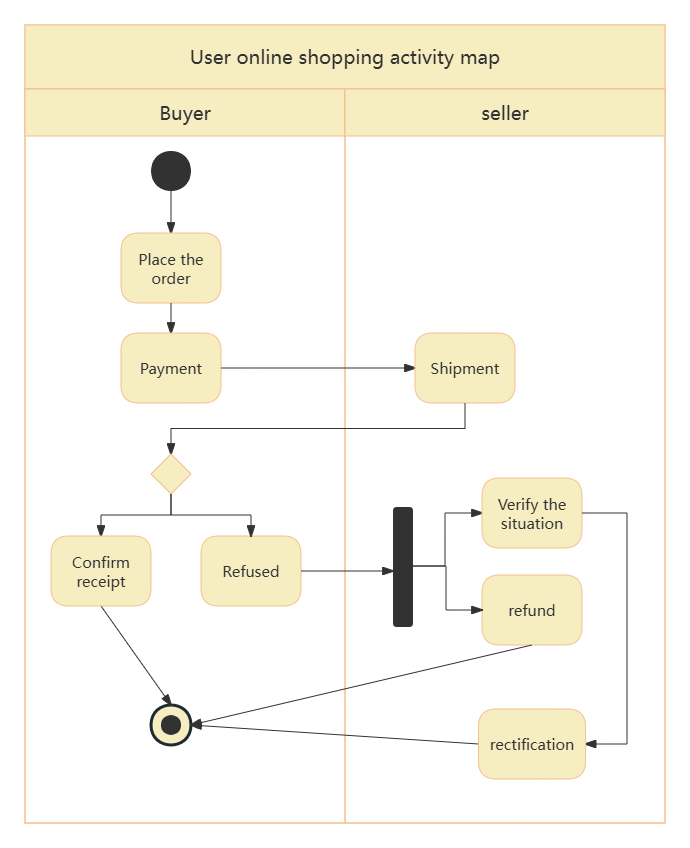
User online shopping activity chart
In use case analysis, activity diagrams can be used to describe in detail how the system responds to specific user requests. By showing a series of actions and state changes when users interact with the system, activity diagrams help developers deeply understand user needs and design software functions that better meet user expectations.
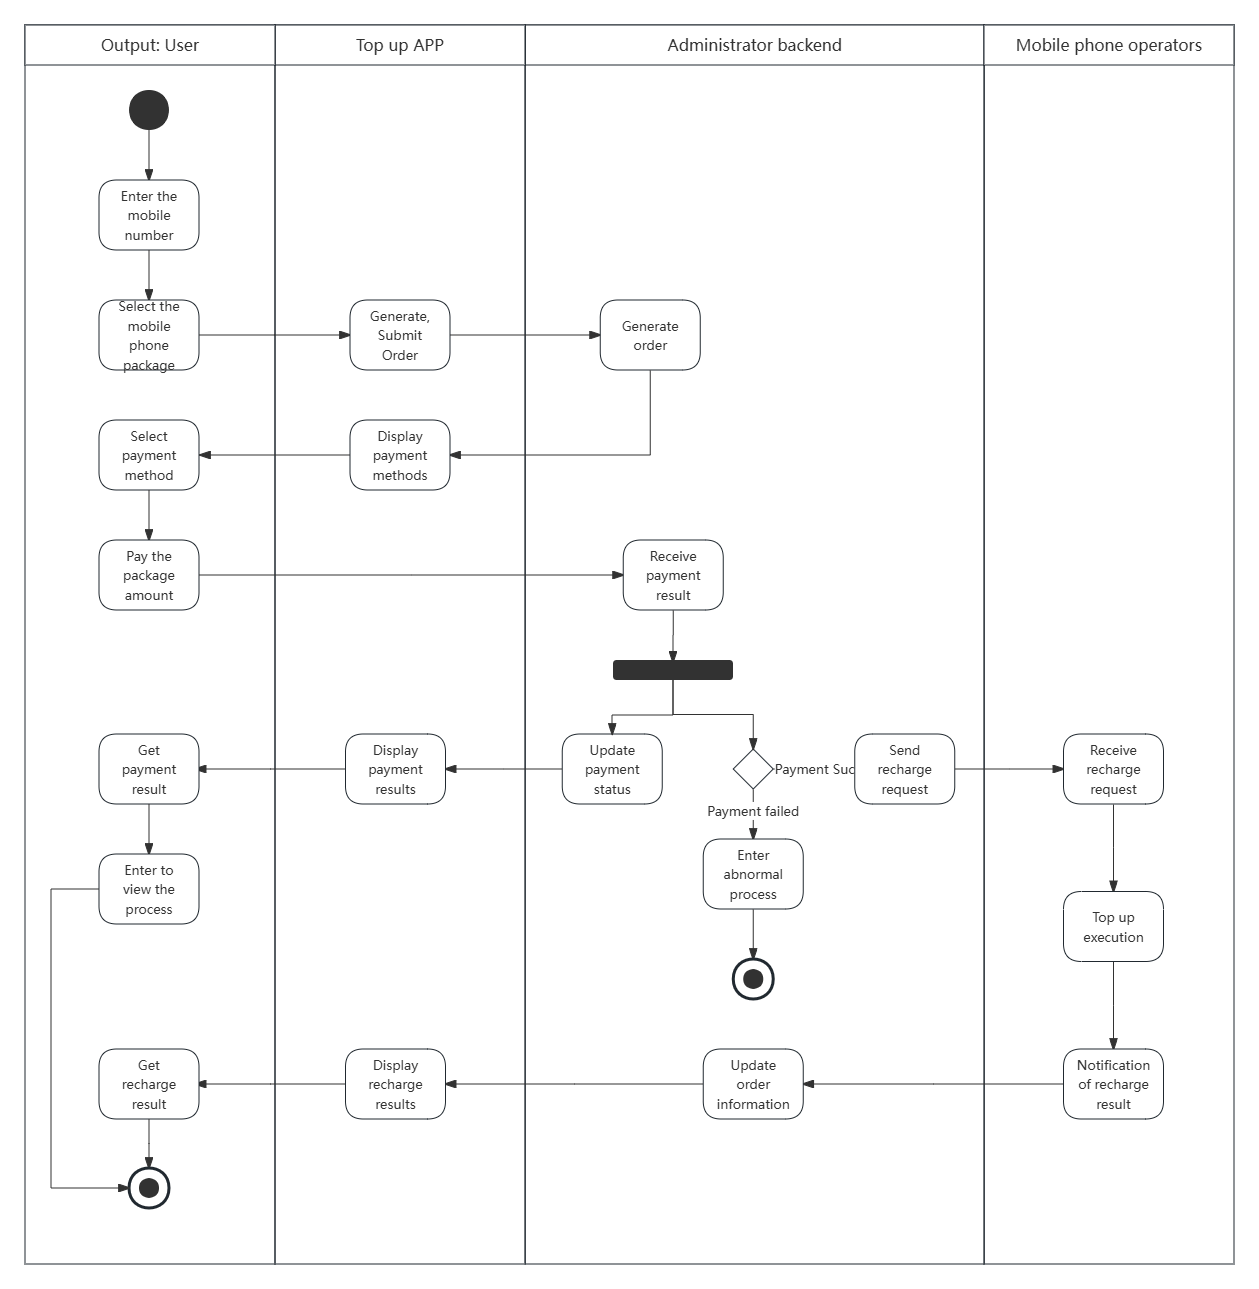
Purchase phone package activity map
In addition to describing external business processes and use case behaviors, UML activity diagrams can also be used to show the internal processes of a system. For example, it can describe how the system processes input data, performs calculations, updates a database, or generates output, which is essential for understanding and optimizing the internal workflow of a system.
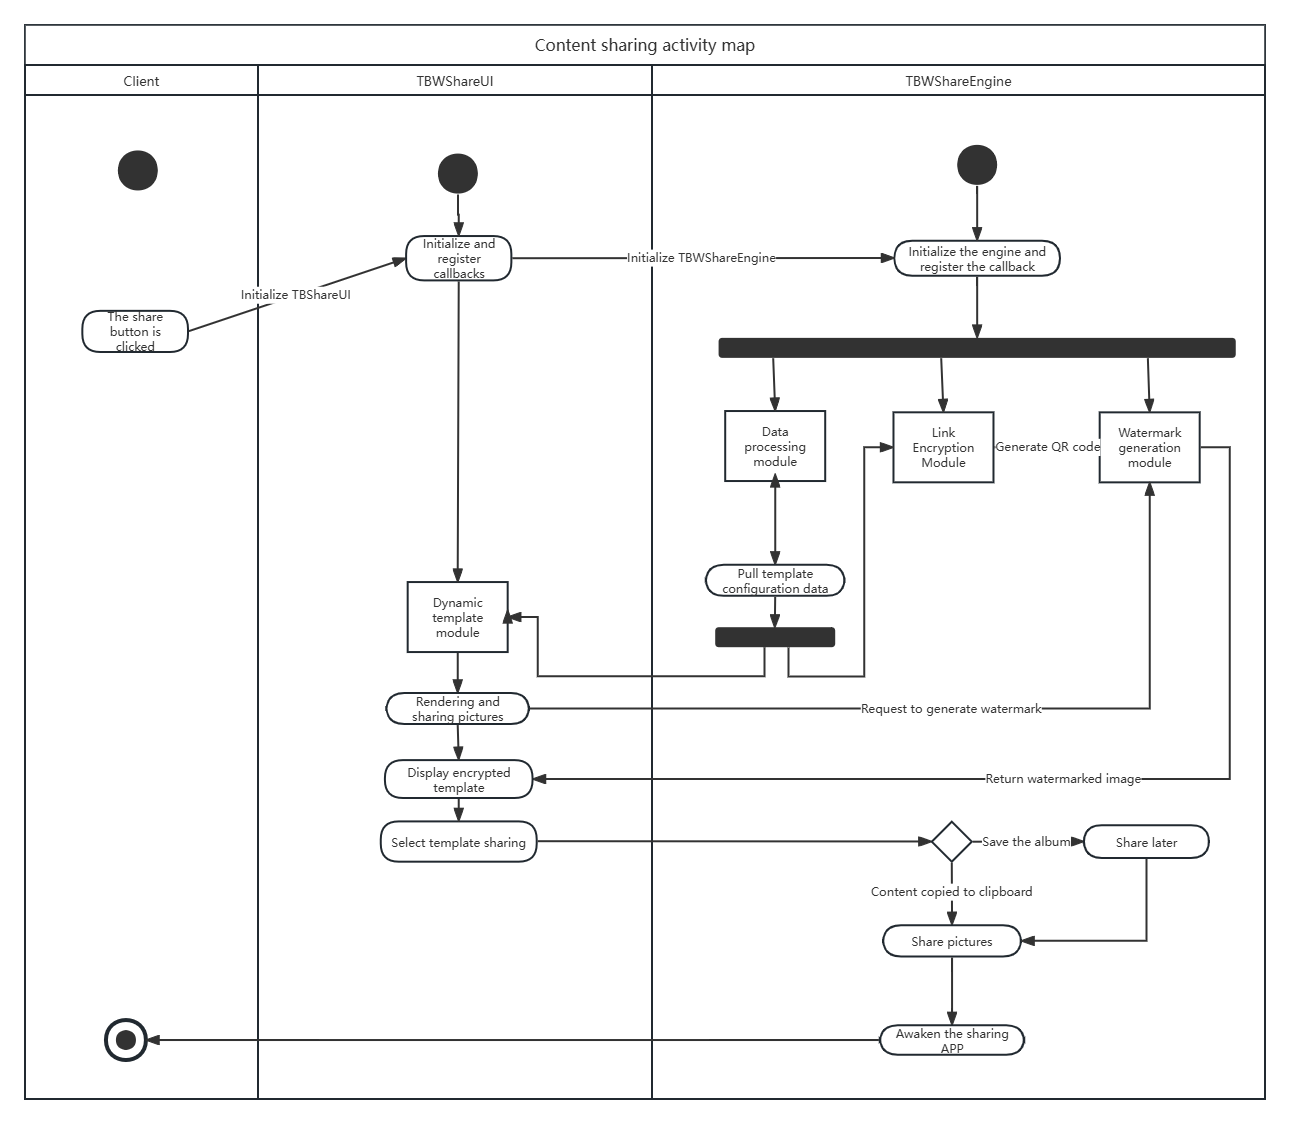
Content sharing activity diagram
In software development, exception handling is an aspect that cannot be ignored. UML activity diagrams can be used to describe the system's processing flow when encountering abnormal situations, including error detection, exception throwing, and exception handling steps, which helps developers ensure the robustness and stability of the software.
As an intuitive graphical representation, UML activity diagrams facilitate collaboration and communication among team members. By viewing activity diagrams, team members in different roles such as development, testing, and project management can more easily understand the functions and processes of the system, thereby collaborating and communicating more effectively.
composed of symbols such as initial nodes, terminal nodes, activities and action flows, judgment nodes, merge nodes, objects and object flows . The following are the common symbols and meanings of activity diagrams.
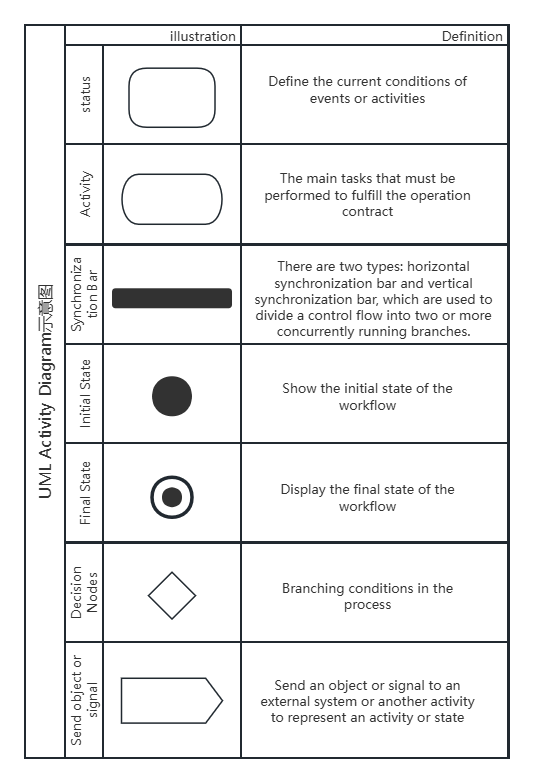
UML activity diagram symbols and meanings
As a flowchart tool, ProcessOn supports drawing professional UML diagrams. It can not only draw activity diagrams, but also sequence diagrams, class diagrams, deployment diagrams , component diagrams, etc. Professional UML graphics can quickly meet your work needs.
Identify the main activities: First, identify the main activities in the system or business process.
Determine the sequence and relationship between activities: analyze the control flow, concurrency relationship, synchronization relationship, etc. between activities.
Add action states and action flows: Add specific action states and action flows to the activity diagram.
Add start and end nodes: Make the process clear where it starts and ends.
Add objects and data storage objects: Add objects and data storage objects in the system as needed.
Add object flow: Indicates the dependency between action states or activity states and objects.
Add elements such as branches and merges, forks and joins: Add these elements as needed for the business process to represent scenarios such as decision points and concurrent execution.
Optimize and adjust: Optimize and adjust the activity diagram to make it clearer and easier to understand.
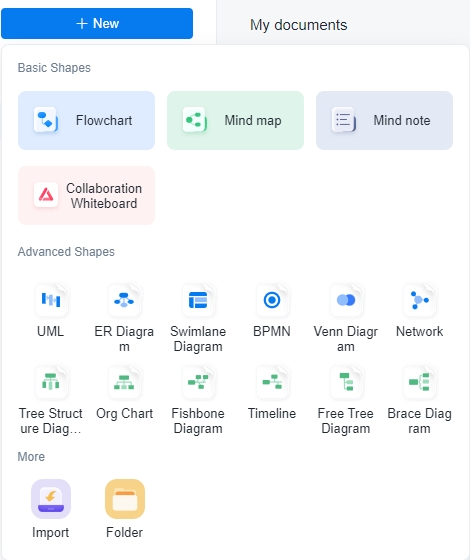
1. Open ProcessOn, go to the Personal Files page, and select New Flowchart .
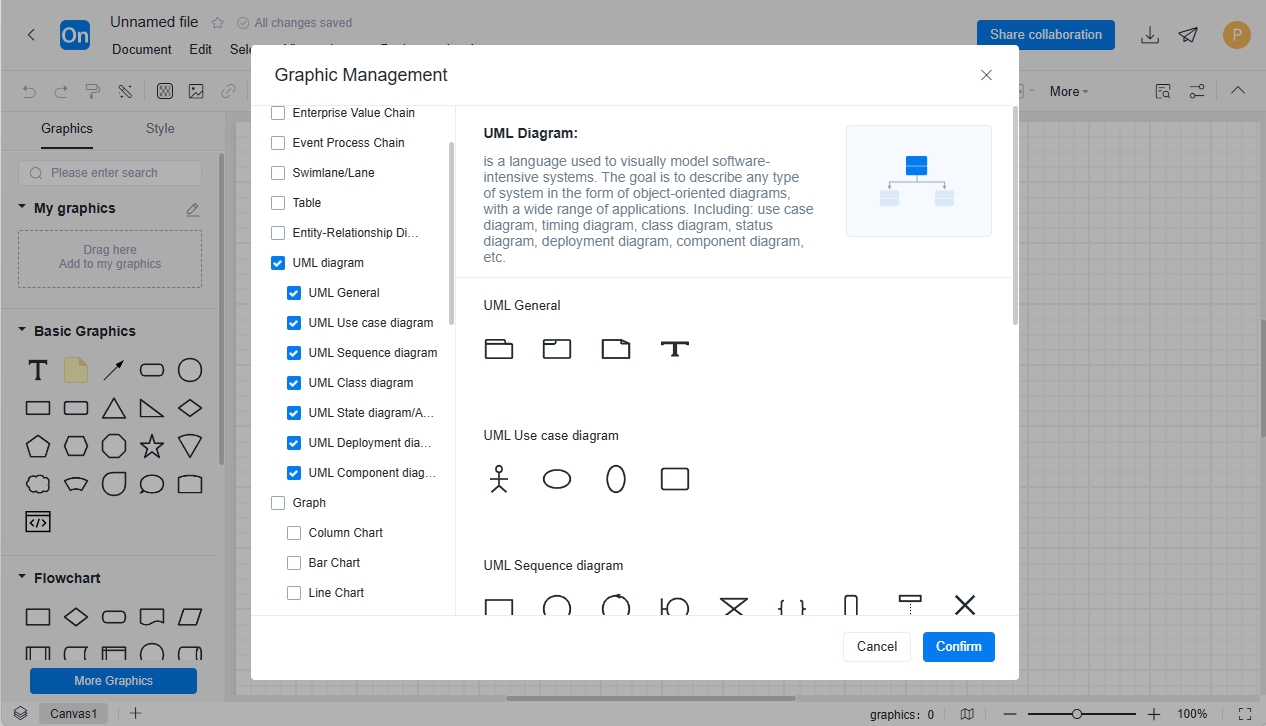
2. Click [More Graphics] below the graphics library to add UML graphics, and then drag and drop related graphics to the editing area for use as needed.
The above article introduces the application scenarios and drawing methods of activity diagrams . Next, let’s deepen our understanding of activity diagrams through several cases .
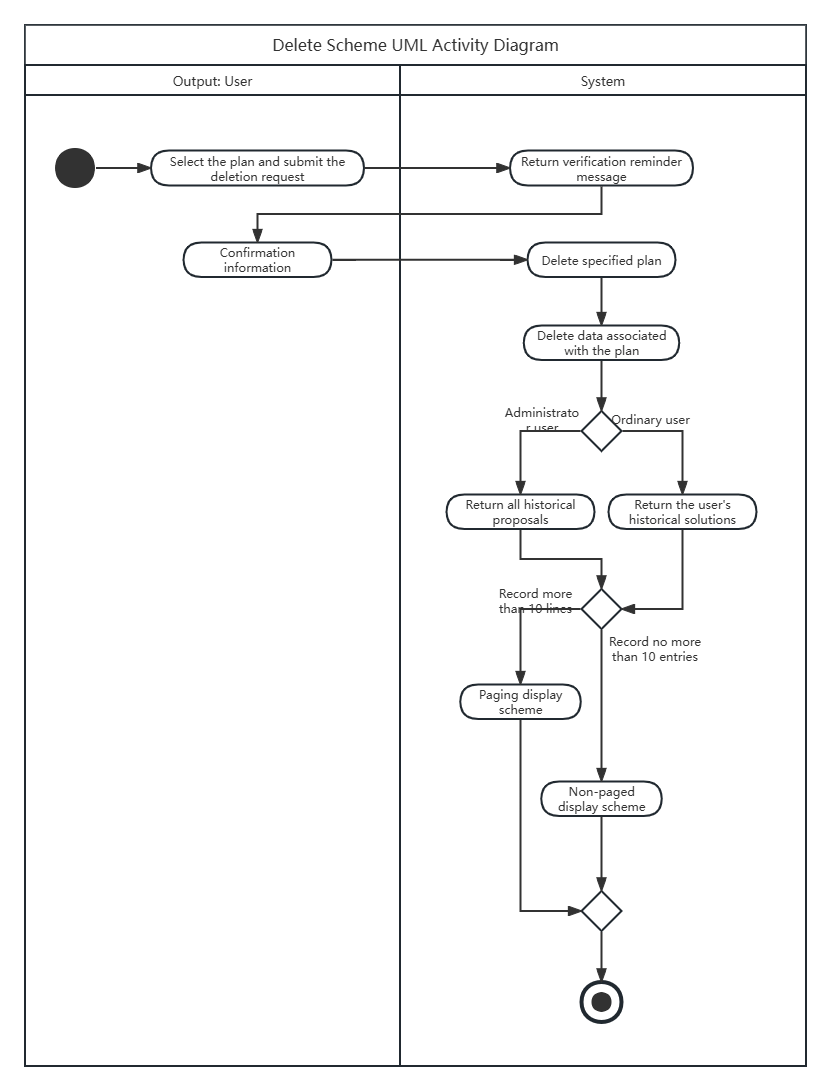
Activity Diagram - Deletion Scheme
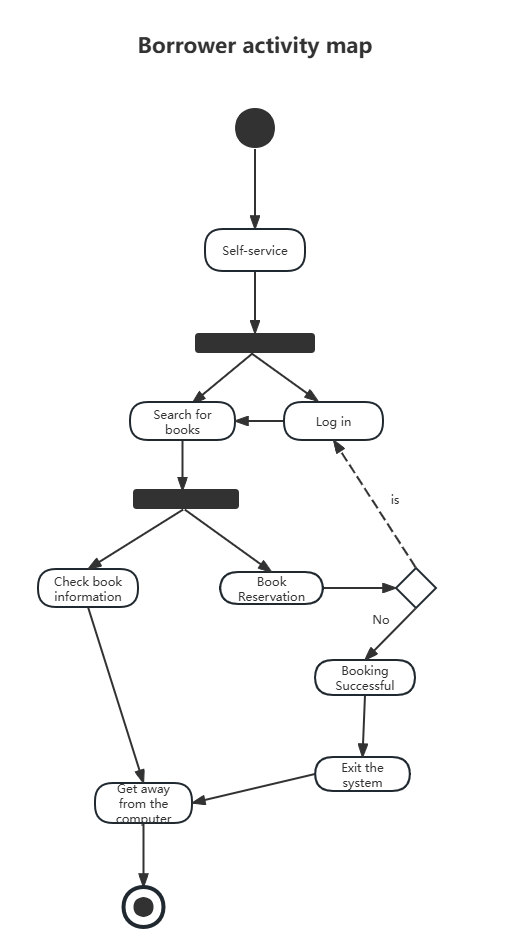
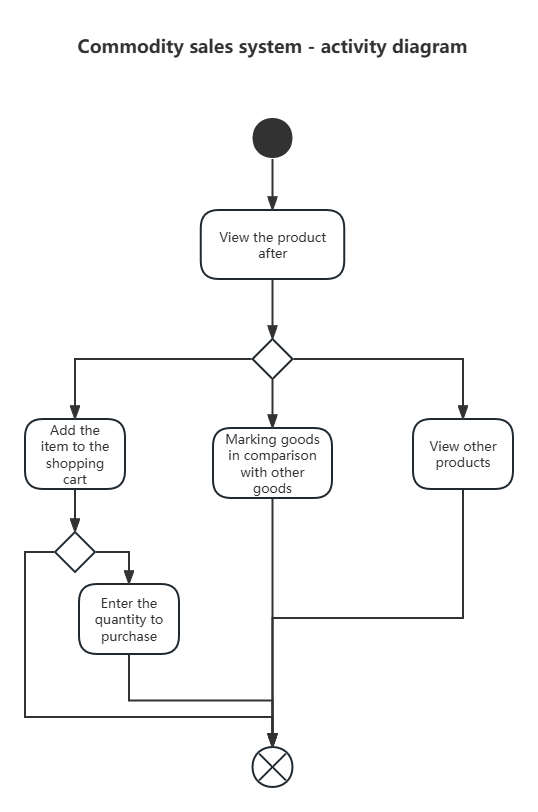
Product Sales System-Product View Activity Diagram
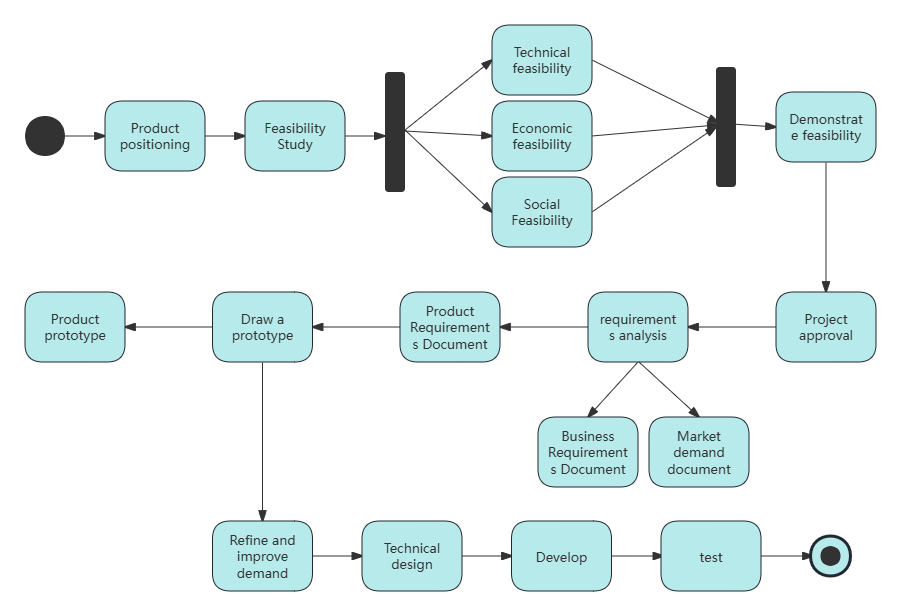
Product life cycle activity diagram
UML activity diagram is a powerful behavioral modeling tool that can clearly describe the activities and operations in a system or business process. By using UML activity diagram properly, developers can better understand the dynamic behavior of the system and design more efficient and reliable systems.
The above UML activity diagram examples are all from the ProcessOn template community . As a professional and powerful drawing tool, ProcessOn supports online editing of UML diagrams, flow charts, mind maps, organizational charts and other graphics. Users can create new content from scratch, or easily edit and modify existing drawing frameworks and templates. The operation is simple and easy to use.
Related reading:
UML diagram complete guide: Master 14 types of UML diagrams in 10 minutes
What is a UML sequence diagram? Attached tutorial and examples
UML use case diagram beginner's guide - concepts, components and examples