As people's understanding of computers deepens, their requirements become more and more stringent, and they hope that computers can do more and more complex things. The simple stand-alone software obviously cannot meet the needs of users. In order to meet these increasingly complex needs, the structure of software has become more and more complex. The use of UML diagrams can well describe the system architecture.
UML , or Unified Modeling Language , is a visual modeling language used for software system analysis and design. UML diagrams are mainly divided into structural behavior diagrams and dynamic behavior diagrams. This article will share the concepts, elements, and drawing tutorials of deployment diagrams in structural UML diagrams, and share application cases.

The above is the classification and basic definition of UML . Before talking about deployment diagrams, let’s first have a preliminary understanding of UML diagrams.
A deployment diagram , also called an implementation diagram, is one of the two diagrams used to model the physical aspects of an object-oriented system, along with a component diagram.
Component diagrams illustrate the logical relationships between components, while deployment diagrams go a step further and describe the physical topology of the system hardware and the software executed on this structure. Deployment diagrams can show the topology and communication paths of computing nodes, and the software components running on the nodes. In UML , deployment diagrams show the system's hardware and the software installed on the hardware, as well as the middleware used to connect heterogeneous computers. Deployment diagrams are usually considered to be a network diagram or a physical architecture diagram.
Example: Deployment diagram of an embedded system (vehicle motherboard) (partial)
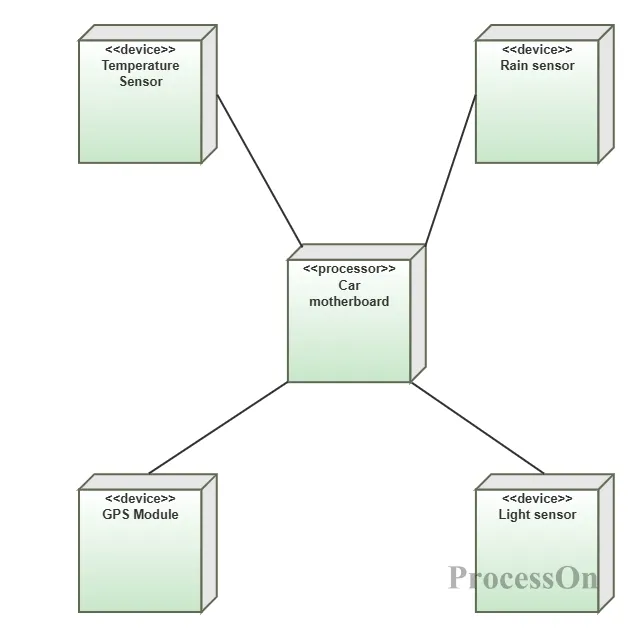
Deployment diagram of an embedded system
After the software is implemented, the deployment diagram is used to draw the physical topology between the software and hardware, and clearly explain the system's usage deployment, environment, etc. Through the deployment diagram, the relevant personnel of the system can know on which specific hardware the software should be installed. Deployment diagrams are mainly used in the following aspects:
1. Explore issues related to system commissioning;
2. Explore the dependencies between your system and other systems in the production environment, which may already exist or be introduced;
3. Describe the main deployment structure of a business application;
4. Design the hardware and software structure of an embedded system;
5.Describe an organization's hardware / network infrastructure.
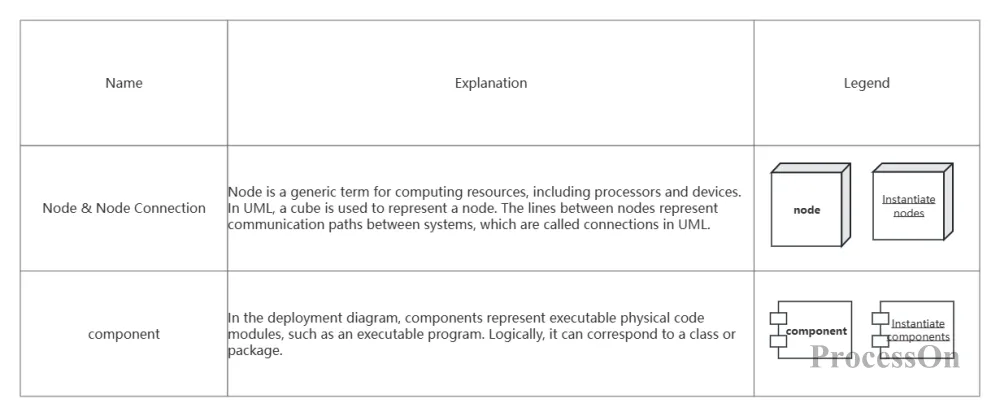
1. Nodes & Node Instances
A node is a physical element that represents a computer resource during its existence and operation. It can be hardware or a software system running on it. It is usually represented by a cube.
Note: Processors are shaded cubes, devices are unshaded cubes.
Unlike nodes, the names of node instances are underlined, and the node type is preceded by a colon (Note: the colon may or may not be preceded by an instance name)
2. Components
Components are the products of the software development process, including process models (such as use case diagrams, design diagrams, etc.), source code, executable programs, design documents, test reports, requirement prototypes, user manuals, etc.
3. Node Connection
The lines between nodes represent the communication path for interaction between systems, and this communication path is called a connection.
ProcessOn supports drawing professional UML diagrams. It can draw not only deployment diagrams, but also sequence diagrams, class diagrams, state diagrams / activity diagrams, and component diagrams. Professional UML graphics can quickly meet your work needs. How to draw a deployment diagram:
Determine the nodes: First determine the main hardware nodes in the system, such as servers, workstations, etc.
Add components: Add corresponding software components on the nodes, which represent the software components running on these nodes.
Establish connections: Use solid lines to represent physical connections between nodes and label the communication protocols and methods used.
Add annotations: Add necessary annotations and explanations to the diagram to help readers better understand the physical architecture and deployment of the system.
How to do it:
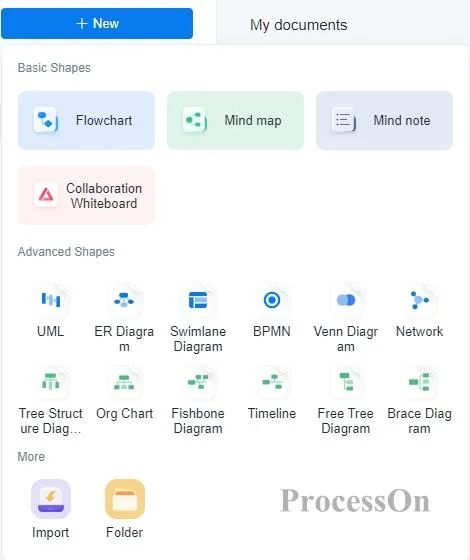
1. Open ProcessOn , go to the Personal Files page, and select New Flowchart.
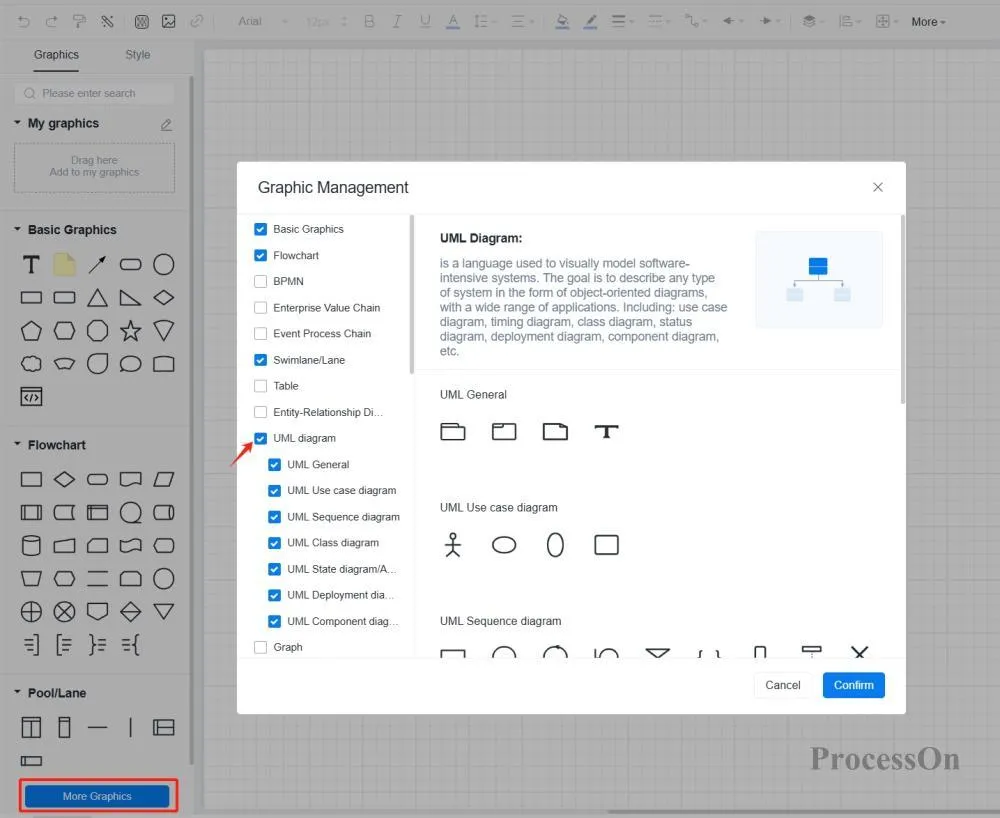
2. Click [More Graphics] below the graphics library to add UML graphics, and then drag and drop related graphics to the editing area for use as needed.
3. Add nodes, links, components, and finally add dependencies between components and objects.
Here are some deployment diagram templates to help you learn more about them. If you want to learn more about deployment diagrams, you can search for related keywords in the ProcessOn template community .
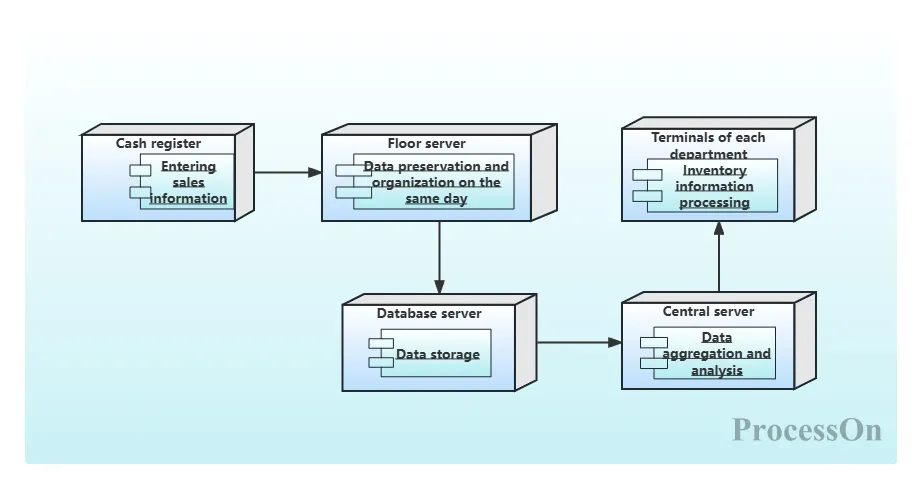
Large shopping mall information management system deployment diagram
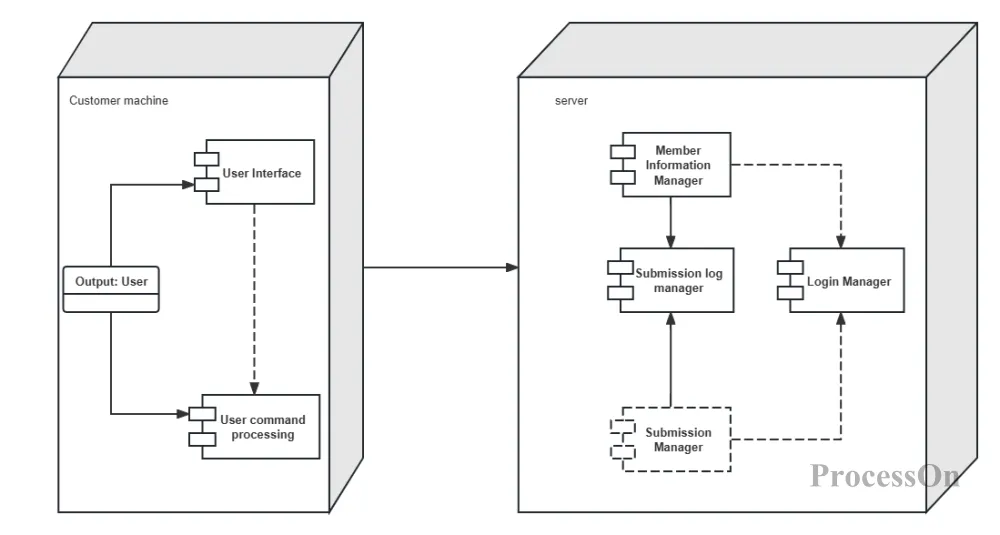
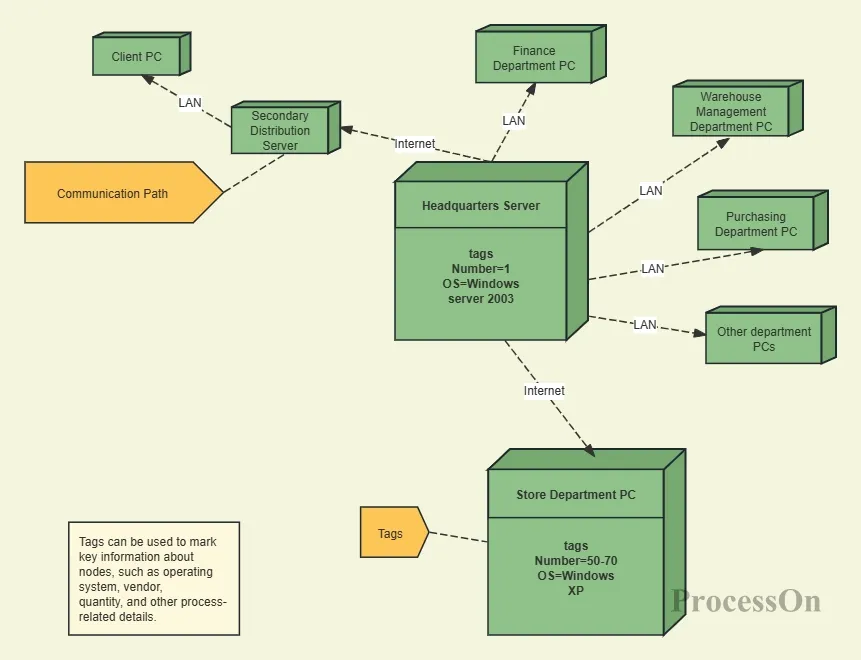
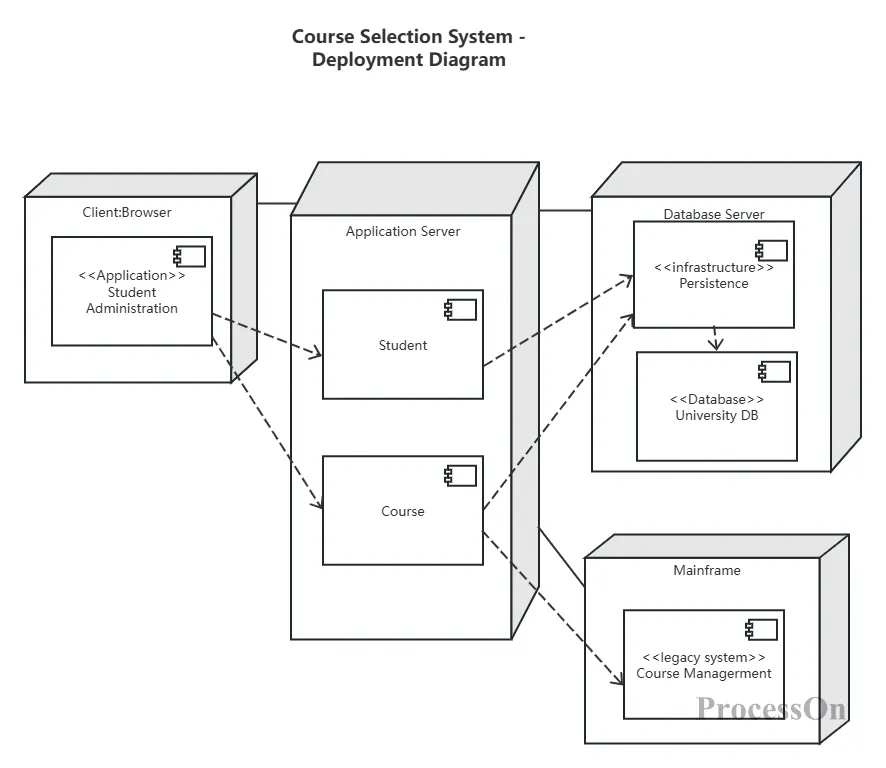
Course Selection System - Deployment Diagram
The above is the relevant content of the deployment diagram. The deployment diagram is a very important graphical representation in UML . It is used to describe the hardware nodes that the system relies on during actual operation and the software components running on these nodes. Through the deployment diagram, you can intuitively understand the physical architecture and deployment of the system, provide strong support for the system's architecture design, deployment planning and communication, and have a very wide range of application scenarios in the field of software engineering.