

Do you know what a Venn diagram is? Or that it can be used in many daily situations? If not, don’t worry! I’m here to help you review it and show you that you’re likely already familiar with this concept.
In fact, most of us know the principle behind Venn diagrams. We learned about set relationships in high school, and a Venn diagram is simply a tool to visualize overlapping areas of sets.
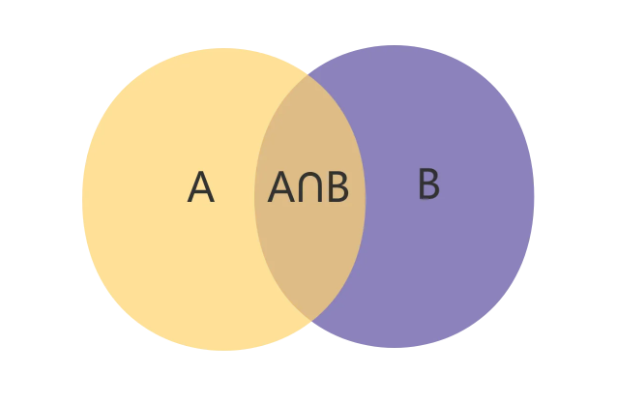
A Venn Diagram, also known as a Venn diagram, Venn chart, or Fan diagram, is a graphical method used to display the logical relationships between sets. This includes their intersections, unions, and differences. The Venn diagram was first proposed by British mathematician John Venn in the late 19th century, hence its name. It is commonly used in fields like mathematics, statistics, and logic.
Components of a Venn Diagram:
Common Venn Diagram Graphics:
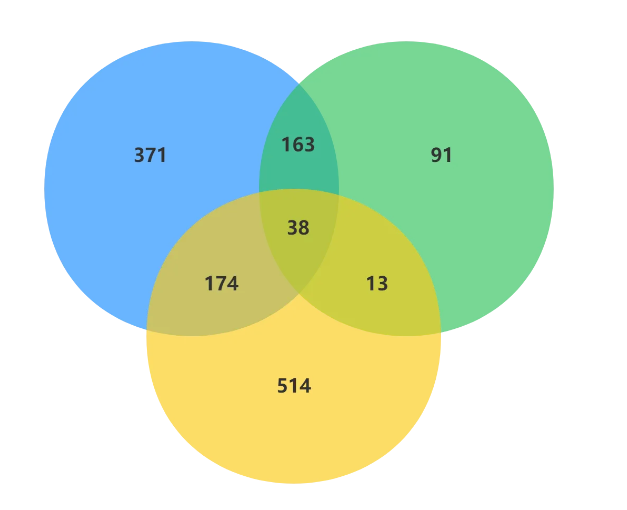

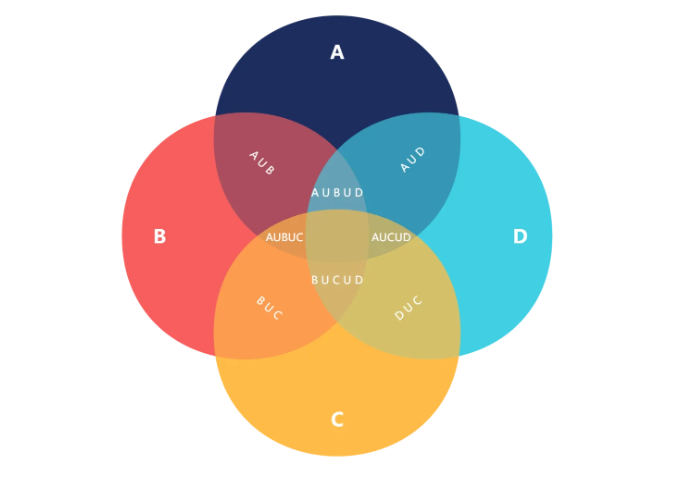
Venn diagrams can be categorized based on the number of sets. As the number of sets increases, the overlaps become more complex.
The advantage of Venn diagrams is that they do not require advanced tools to create. A simple canvas is enough. They are highly effective in visualizing abstract concepts and simplifying complex information by showing the intersections between sets, which helps in identifying similarities, differences, and making informed decisions.
Venn diagrams are widely used in various fields such as mathematics, logic, computer science, and biology. They can be employed for:
1. Choosing a Major for Graduate School: Should You Opt for a Professional Master’s or an Academic Master’s Degree?
Venn Diagram for Selecting a Major for Graduate School
If you’ve taken a graduate school entrance exam, you know the dilemma of choosing between an academic or professional master’s degree. Different choices involve varying levels of difficulty, admission rates, and future career paths. Academic master’s degrees focus more on research, while professional ones are more practical. By using a Venn diagram, you can clearly visualize the pros and cons and make a well-informed decision.
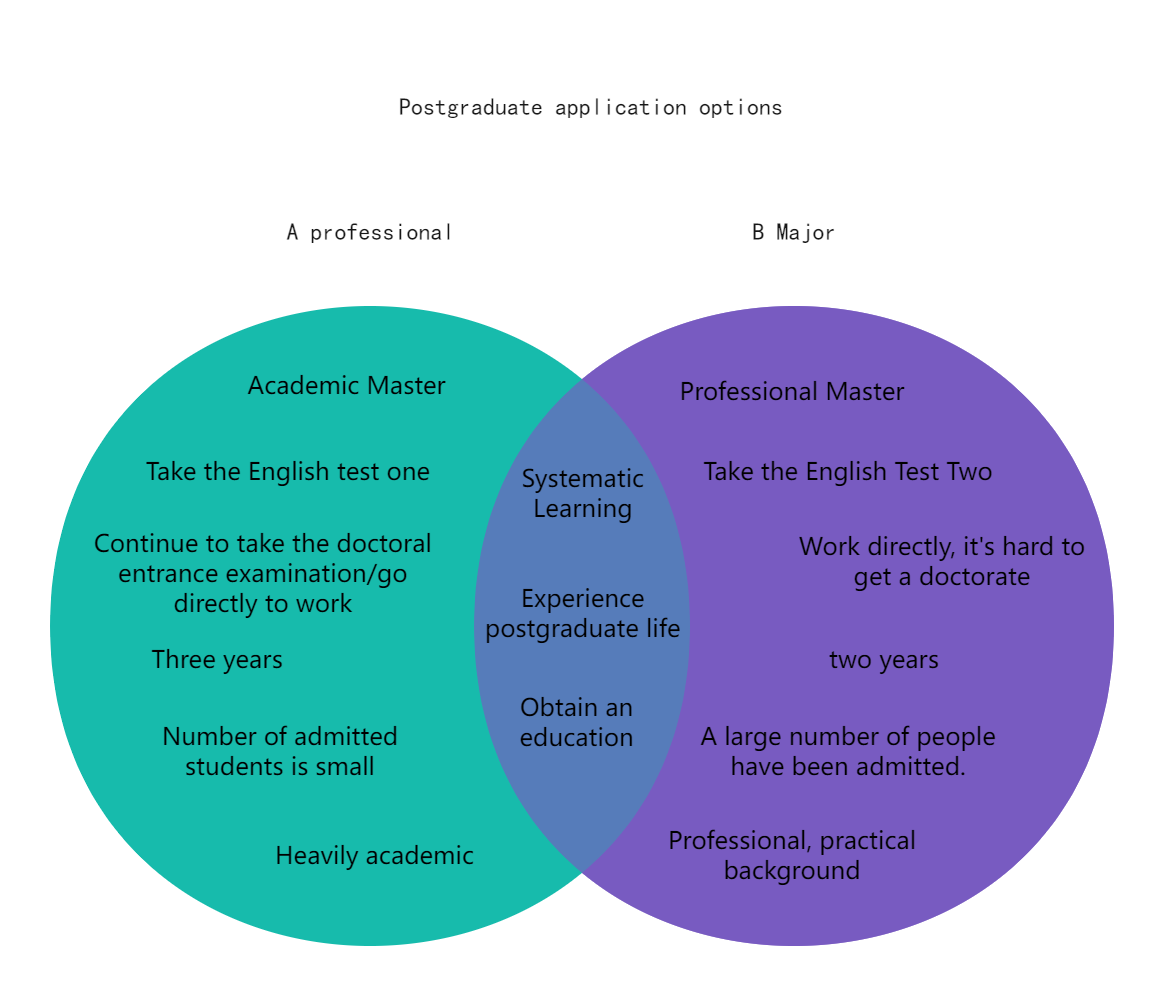
Graduate Enrollment Choice - Venn Diagram (Double Set)
2. Job Selection
Venn Diagram for Job Selection
When about to graduate and seeking a job, you can’t base your choice solely on your major. You need to consider your interests, skills, and the demand in the job market. A Venn diagram can help you list what you excel at, what you enjoy, and what’s feasible for earning a living, leading to the best job choice.
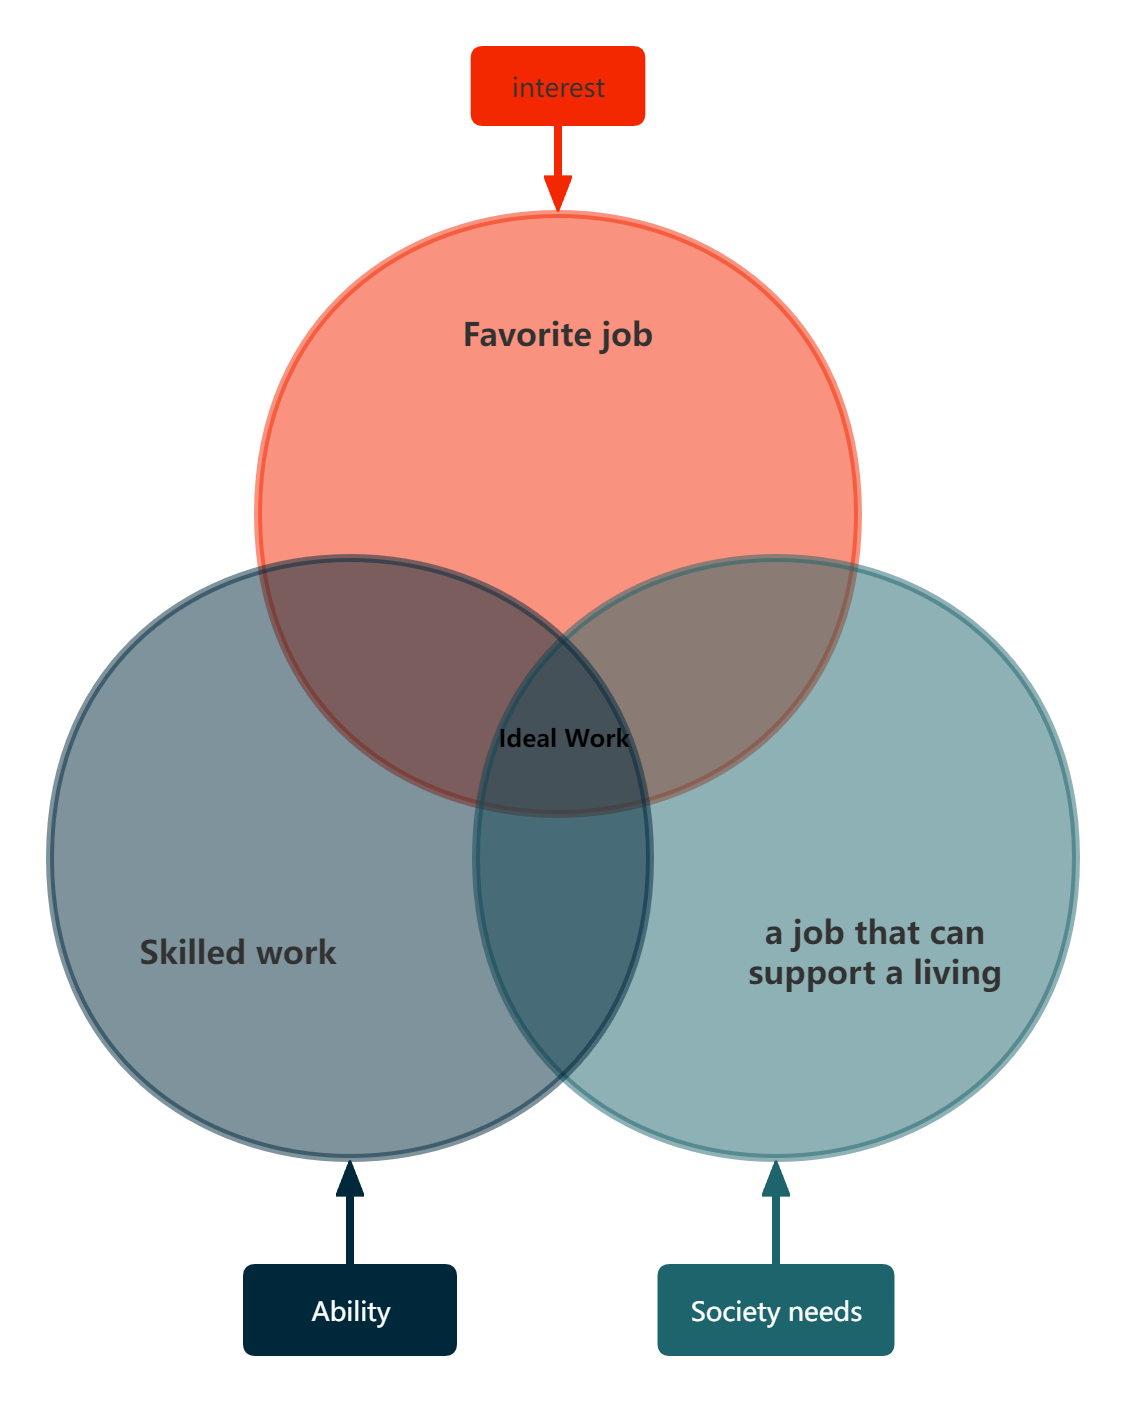
How to choose an ideal career - Venn diagram
3. Selecting Maternal and Infant Products
Venn Diagram for Maternal and Infant Product Selection
Using a Venn diagram to analyze goals and user characteristics can be beneficial. It helps in accurately assessing user psychology and behavior, leading to well-defined goals.
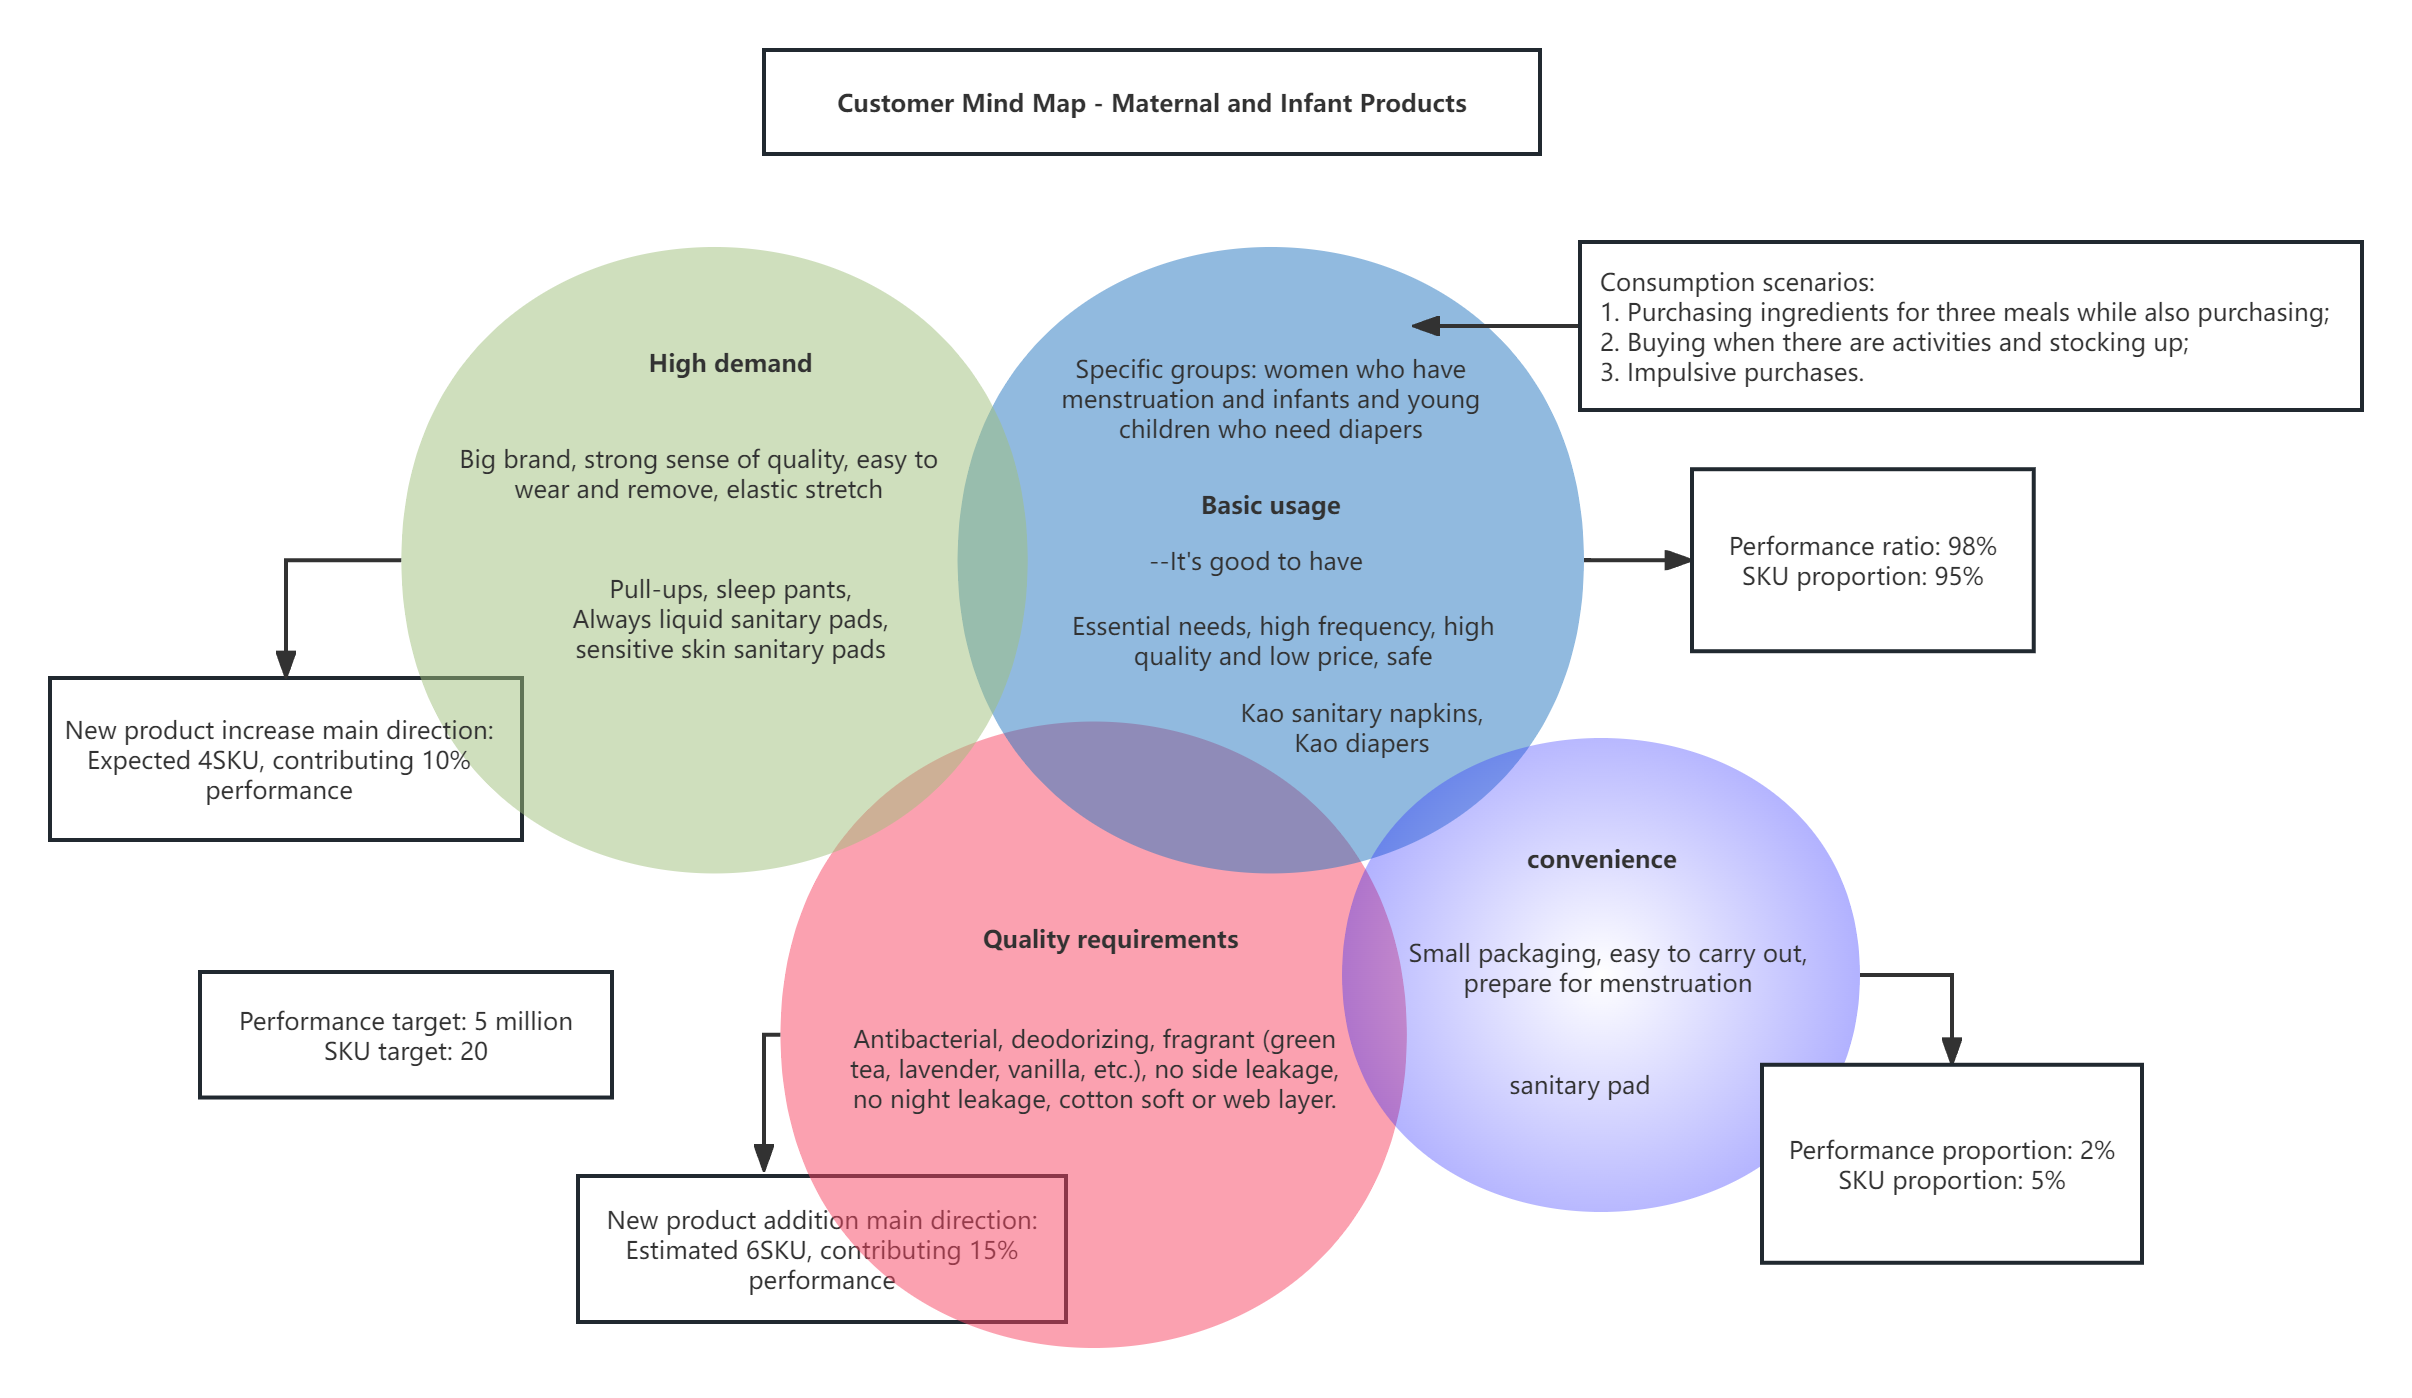
Wayne diagram of maternal and infant product selection
4. Community Group Buying: Reaching the Customer’s Mind
Venn Diagram for Community Group Buying
Essential skills for e-commerce partners include targeting consumer groups based on product prices and customizing operational strategies accordingly.
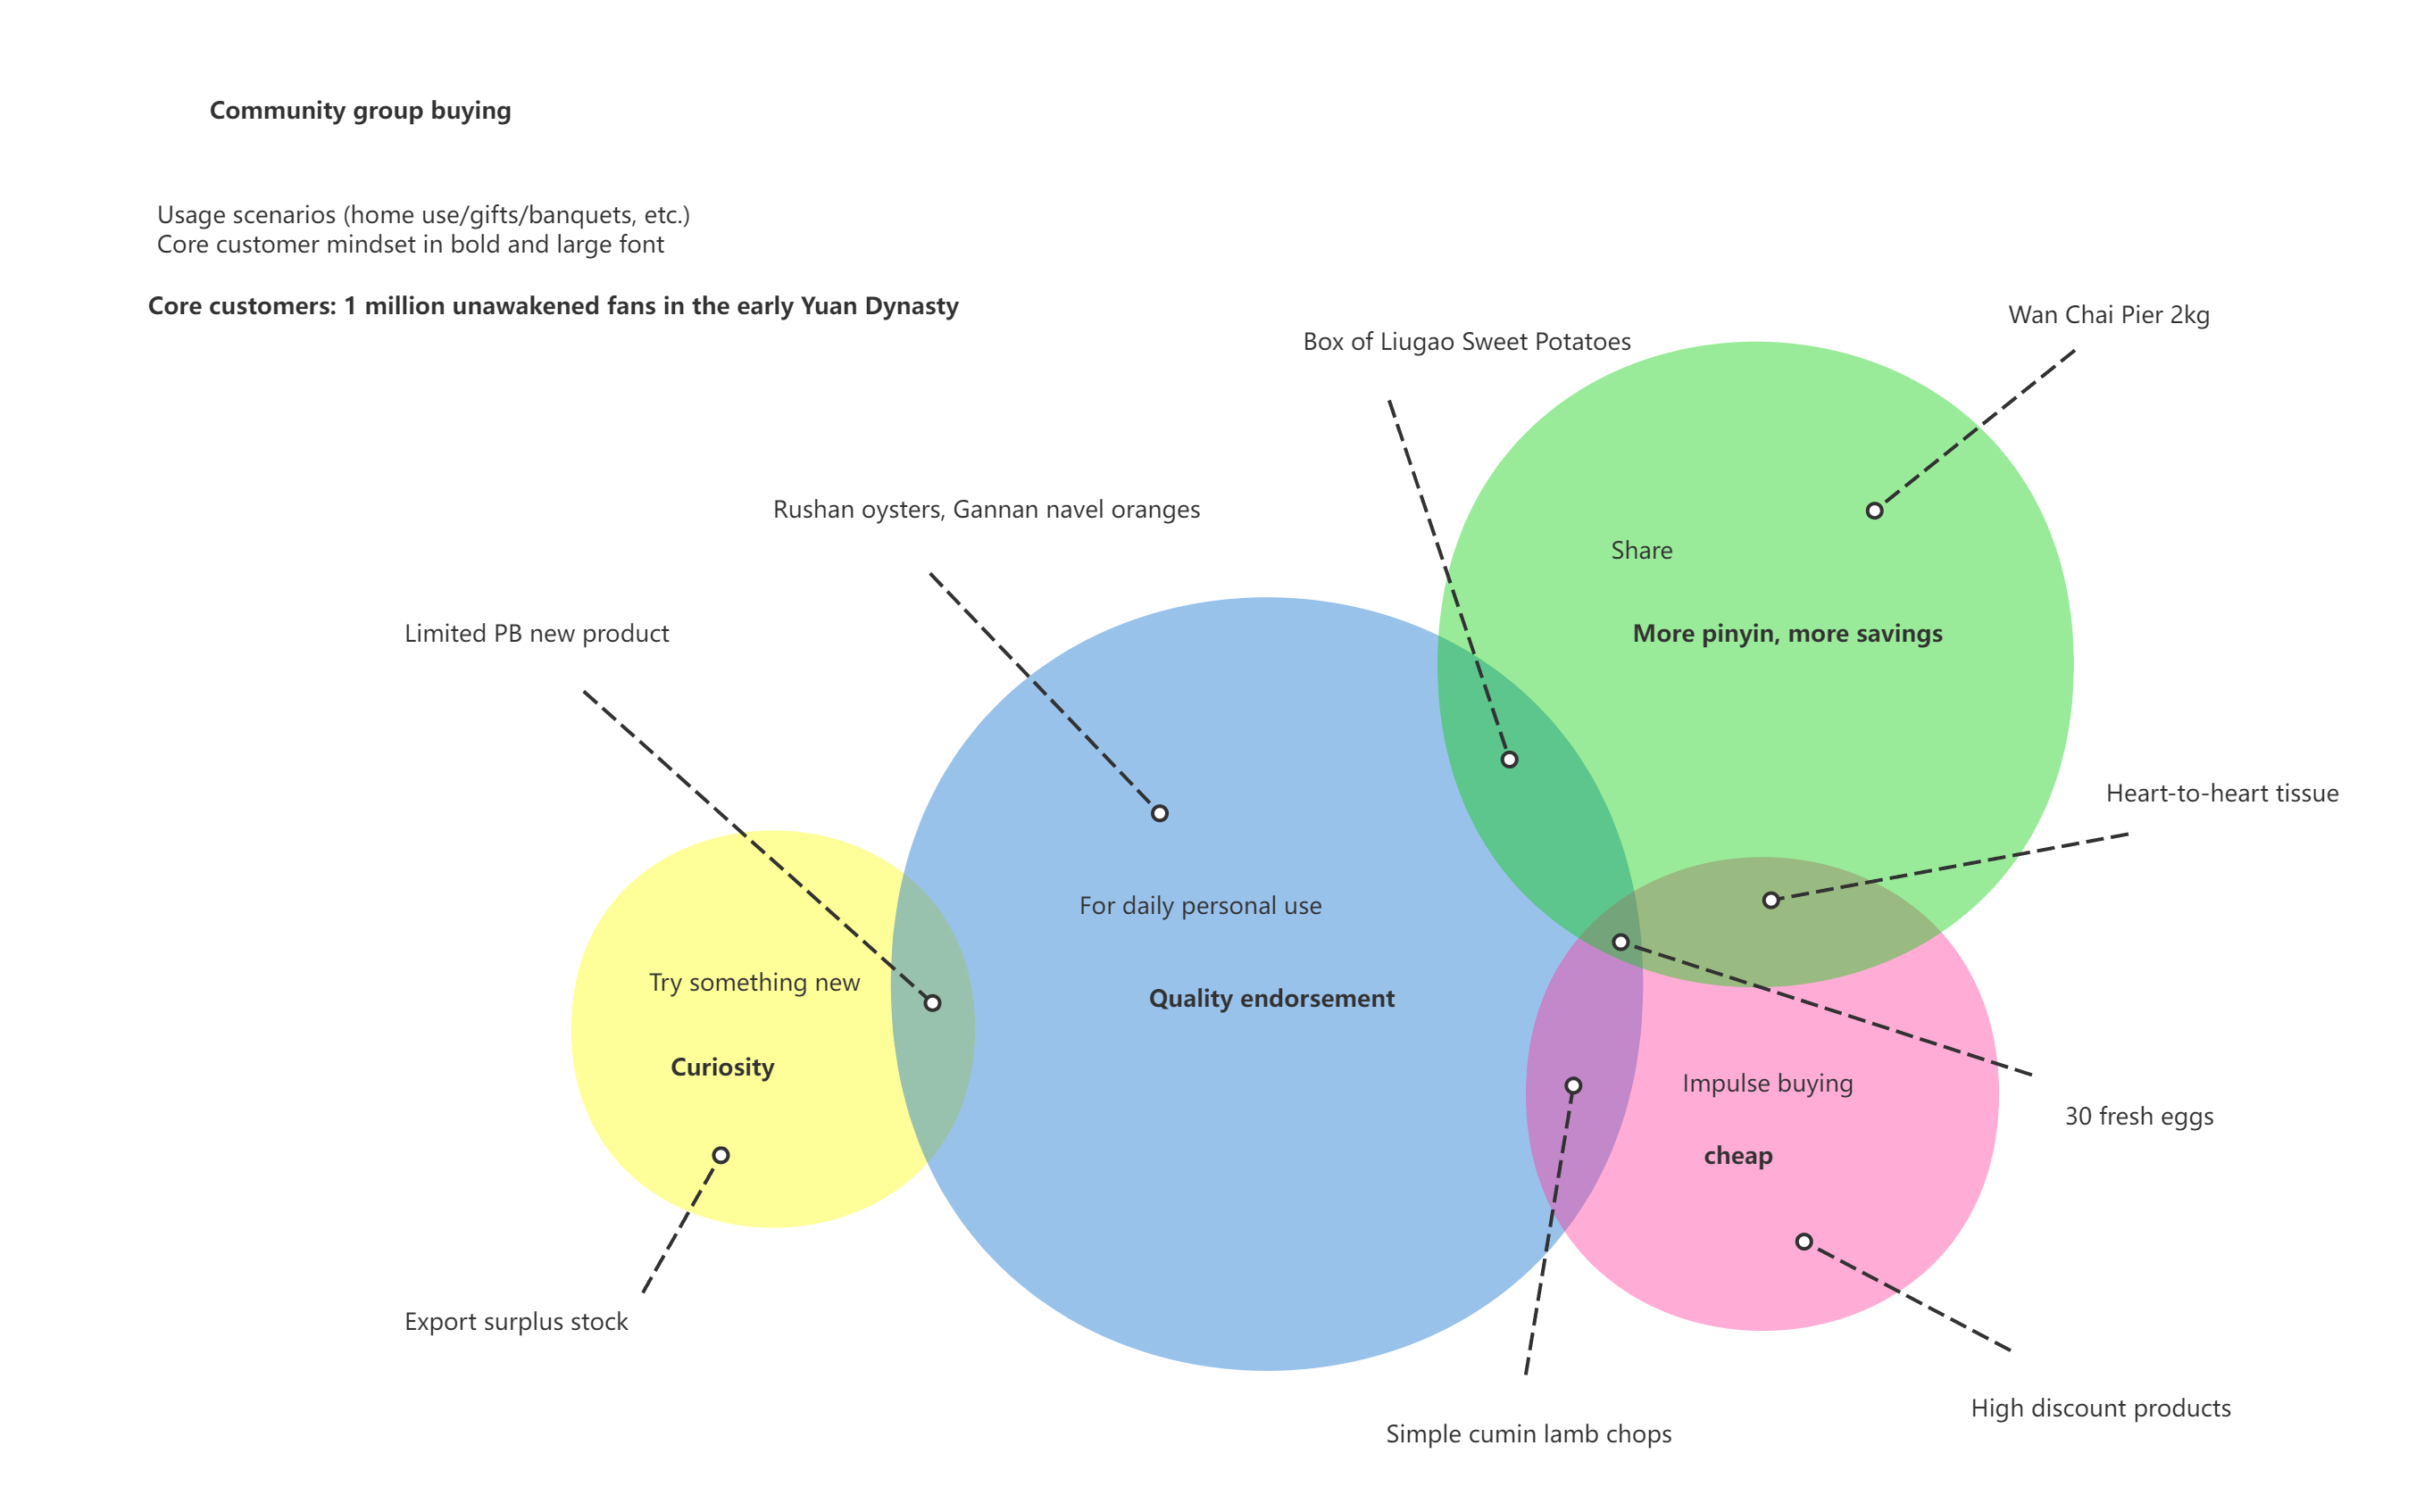
Customer Mind Reach Map [Community Group Buying]
The main elements of Venn diagrams include circles, intersections, and logical expressions. There are two methods to create them:
Method 1:
Step 1: Create a new flowchart and add a Venn diagram to the graphics area.
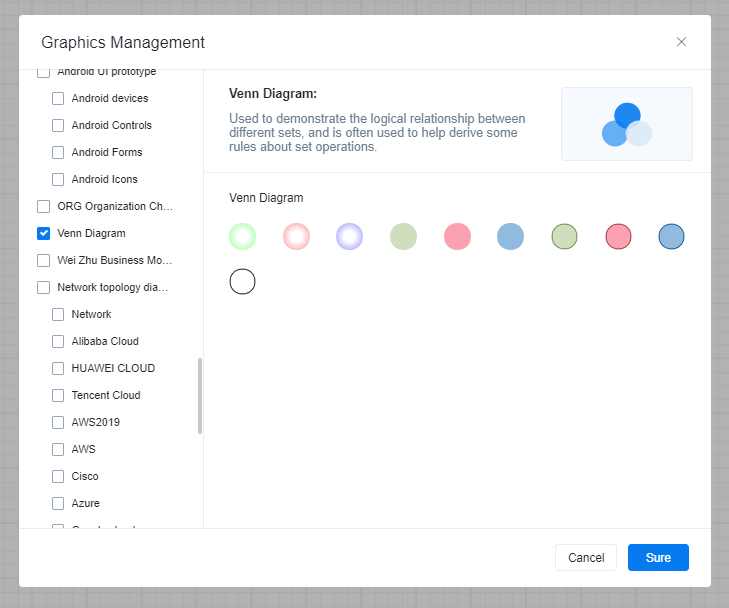
Step 2: Drag and drop the Venn diagram graphic into the editing area.

Step 3: Label the content and perform your analysis.
Method 2:
Step 1: Create a new flowchart and draw circles.
Step 2: Fill the circles with different colors to distinguish each set.
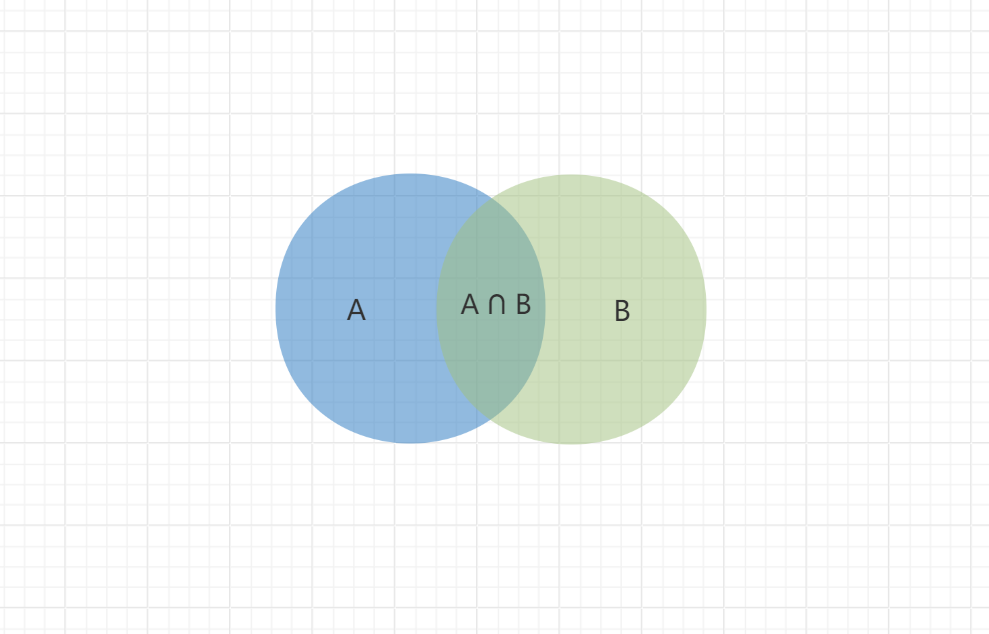
Step 3: Adjust the transparency to highlight intersections.
Step 4: Label the content and perform your analysis.
Venn diagrams are a powerful visualization tool that enhances understanding and communication of set information. Whether for teaching or professional use, they are a simple yet effective tool. Have you mastered drawing Venn diagrams yet?