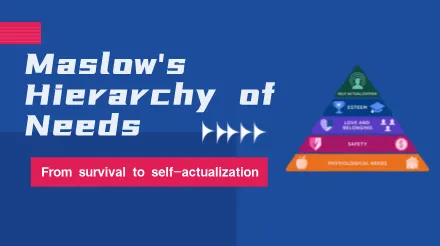
Register
Process Type
Visual Representation
Mind Map Type
Structured Representation
Notes Type
Efficiency Type
Basic Flow Chart
UML
BPMN
Venn Diagram

Blog

Providing Efficient Tutorials from Beginner to Expert
How to easily draw a professional and good-looking Venn diagram? 7 templates to help you get started quickly!

How to easily draw a professional and good-looking Venn diagram? 7 templates to help you get started quickly!

In today's information age, network topology plays a crucial role. It is not only a visual representation of the network structure, but also an important tool to help us understand and optimize network design. Whether you are an IT novice or a senior network engineer, it is very necessary to master the production of network topology diagrams. So what is network topology, what are the types of network topology diagrams, and what are the network topology diagram drawing tools? The editor will take you to understand. Basic knowledge of network topology diagrams, common types and how to efficiently use ProcessOn to draw network topology diagrams, helping you to be comfortable in network design and management.
How to Draw a Process Flow Diagram? A Few Simple Steps to Teach You the Skills and Methods

How to Draw a Process Flow Diagram? A Few Simple Steps to Teach You the Skills and Methods

Process Flow Diagrams (PFD) play an important role in the production process. By providing an overview of the production process, they help identify and optimize various links and improve efficiency. This article mainly introduces the drawing method of process flow diagram and discusses the difference between PFD and piping and instrumentation diagram (PID). By reading this article, readers will learn how to use process flow diagrams to simplify and improve production processes and achieve higher productivity and efficiency.
How to use Gantt chart for time and project management? High definition template sharing

How to use Gantt chart for time and project management? High definition template sharing

Gantt chart, also known as bar chart or Gantt chart, is a commonly used type of chart in project and task management. It represents the order and duration of specific projects through activity lists and time scales, making it very suitable for optimizing our long-term plans. By using Gantt chart, we can break down the medium and long-term goals into more controllable short-term plans, thus enabling the implementation of plans and improving the efficiency of actions. This article will explain how to use ProcessOn to draw a high-quality Gantt chart.
1 2 3