Data flow diagram (DFD) is a graphical representation method used to depict the flow, storage, processing and interaction between external entities of data in a system. It helps developers, analysts and stakeholders to intuitively understand the data flow and logical structure of the system by breaking down complex systems into easy-to-understand components and processes.
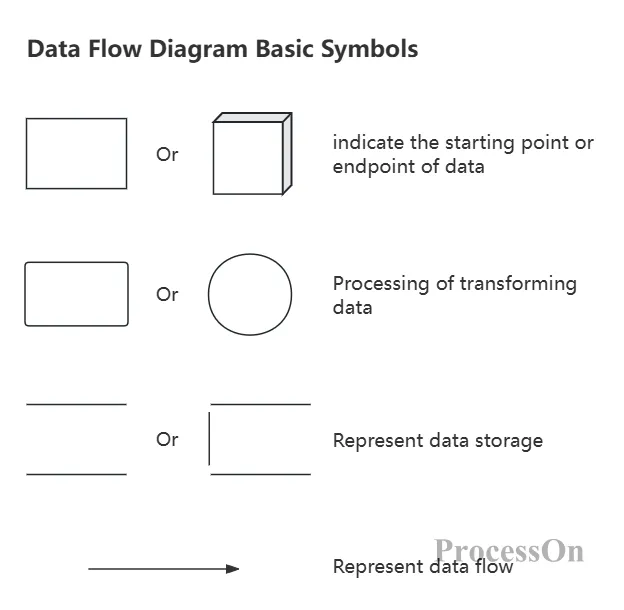
Data flow diagram basic symbols
External entities: Represent elements outside the system, such as users, other systems, or data sources. They are the source or destination of data.
Data storage: refers to the components in the system used to store data, such as databases, file systems, etc.
Process/Processing: Describes the steps in the system to operate or transform data, such as calculation, filtering, formatting, etc.
Data flow: Directed arrows connecting various elements indicate the direction of data flow.
Data flow diagrams are generally divided into two categories, depending on the level of detail and purpose:
Logical data flow diagram: focuses on describing what the system "should do", mainly expresses business and business operations, and emphasizes data processing logic, such as data collection, data and information conversion, and information reporting, without involving specific physical implementations , such as computer configuration, data storage technology, information transmission methods, etc.
Physical data flow diagram: More specific, showing how the system "actually works", including hardware, software components and the physical connections between them. It enables the program described in the logical data flow diagram to accurately achieve the business goals that have been achieved.
System design: In the early stages of software or information system development, data flow diagrams are key tools for planning system architecture and defining functional modules and interfaces.
Problem diagnosis: When a system failure or performance bottleneck occurs, the data flow graph can be used to trace the data path and quickly locate the problem.
Optimize processes: By visualizing data flows, identifying redundant steps or bottlenecks, and optimizing data processing processes, efficiency can be improved.
Training and education: For new members joining the team, data flow diagrams are an effective way to understand the working principles of the system and get started quickly.
1. Top-level data flow diagram
It determines the scope of the system and determines the input and output data flows. It describes the boundaries of the system and abstracts the functions of the entire system into a process. It mainly highlights the source and destination of the data.
There is only one top-level DFD, which represents the relationship between the entire system and external entities, but does not go deep into the internal system.
In this layer, usually only a system box and the external entities that interact with it are shown, as well as the main data flow between them.
For example, the following figure is the top-level data flow diagram of an e-commerce platform system:
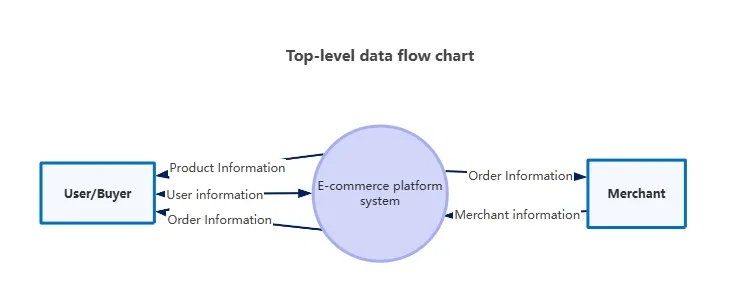
E-commerce platform system data flow diagram
2. Layer 0 data flow diagram
top-level data flow diagram is relatively general. It is impossible to understand the specific data and relationships within the system from this diagram alone. The next step is to decompose and refine the basic system model to form a 0th-level data flow diagram.
For example, in an online shopping system, the main functions of the system are divided into user login management, transaction management, order management, etc., and multiple data storages such as shopping cart lists and order tables are added under these functions.
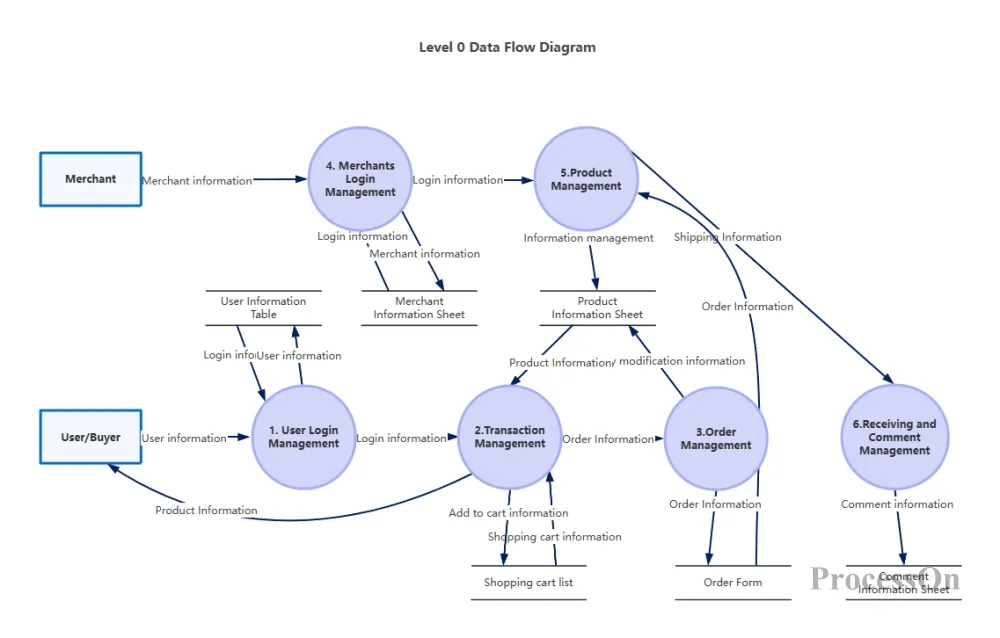
E-commerce platform system data flow diagram
3. Layer 1 Data Flow Diagram
The next step is to further refine the system functions in the functional level (0-layer) data flow diagram. For example, the user login management, transaction management and other functions in the above 0-layer data flow diagram are further decomposed to expand the internal details of each main function.
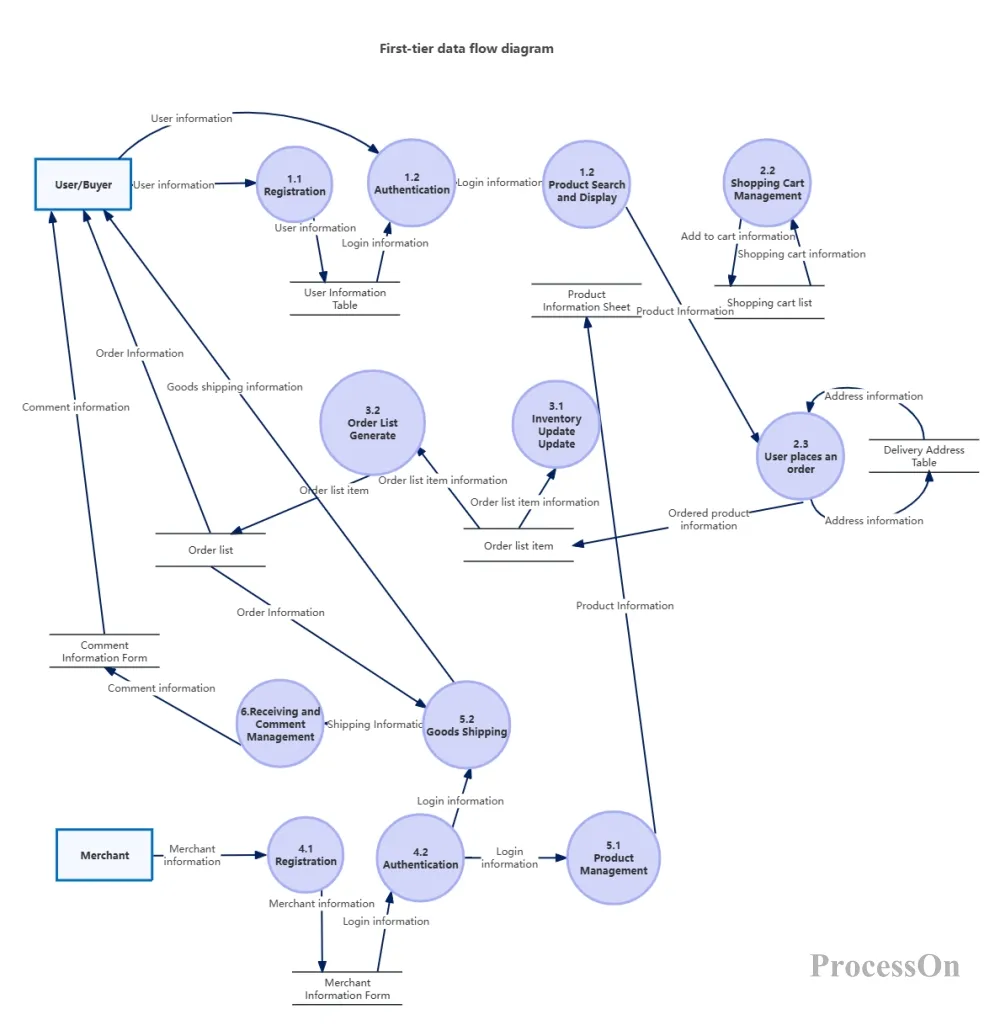
E-commerce platform system data flow diagram
The number of intermediate levels generally depends on the complexity of the system. For example, based on the 0th level, you can create a 0th level data flow diagram to further expand the main components of the system; and for the main processes in the 1st level, you can create a 2nd level data flow diagram to further expand the internal details of each main process.
Within these levels, the system is subdivided into smaller functional units (i.e. processes) and connected to each other via data flows.
4. Low-level data flow diagram
The low-level data flow graph refers to the data flow graph whose processing cannot be further decomposed.
The processing is called "atomic processing", which is the most basic processing process that cannot be decomposed any further. In this layer, the detailed data flow of each processing node is displayed.
Using professional drawing tools can improve drawing efficiency and focus more on thinking. Here we recommend using ProcessOn to make data flow diagrams. ProcessOn is a free online professional drawing tool for flowcharts, mind maps, UML, network topology diagrams, etc.
1. Log in to ProcessOn , go to the Personal Files page, and select Create New Flowchart.
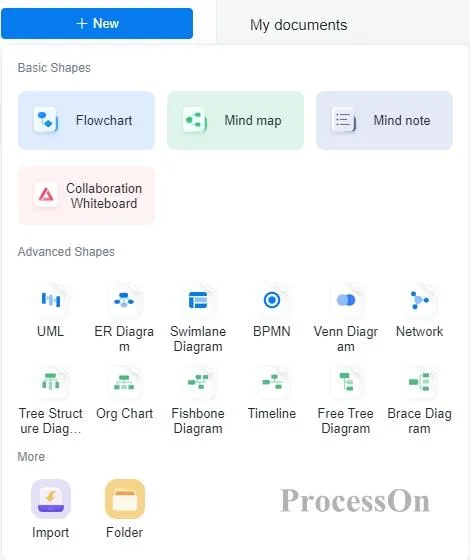
2. Determine the input and output of the system: At this stage, you should understand as much as possible what data the system receives or outputs from the outside world. Therefore, when drawing, you need to draw as many data flows as possible, delete the redundant ones, and add the missing ones.
3. Draw the top-level data flow diagram of the system from the outside to the inside: After determining the input and output of the system, connect them with processing. Where the value of the data flow changes is a processing. You can draw from the input data flow to the output data flow, or you can draw from the middle data flow. Then name it in the order of processing → data between processing → file.
4. Decompose layer by layer from the top to the bottom and draw a hierarchical data flow diagram: For large systems, in order to control complexity and facilitate understanding, it is necessary to adopt a top-down layer-by-layer decomposition method. When further decomposition will involve how to specifically implement a function, decomposition should not be continued .
You should also pay attention to the way the processes are numbered in the data flow diagram. The process elements of the top-level data flow diagram can be numbered as 1, 2, 3... When process 1 is further decomposed, its components will be numbered 1.1, 1.2, 1.3... If 1.1 is further decomposed, you will get processes numbered 1.1.1, 1.1.2... The process naming rule is followed and so on.
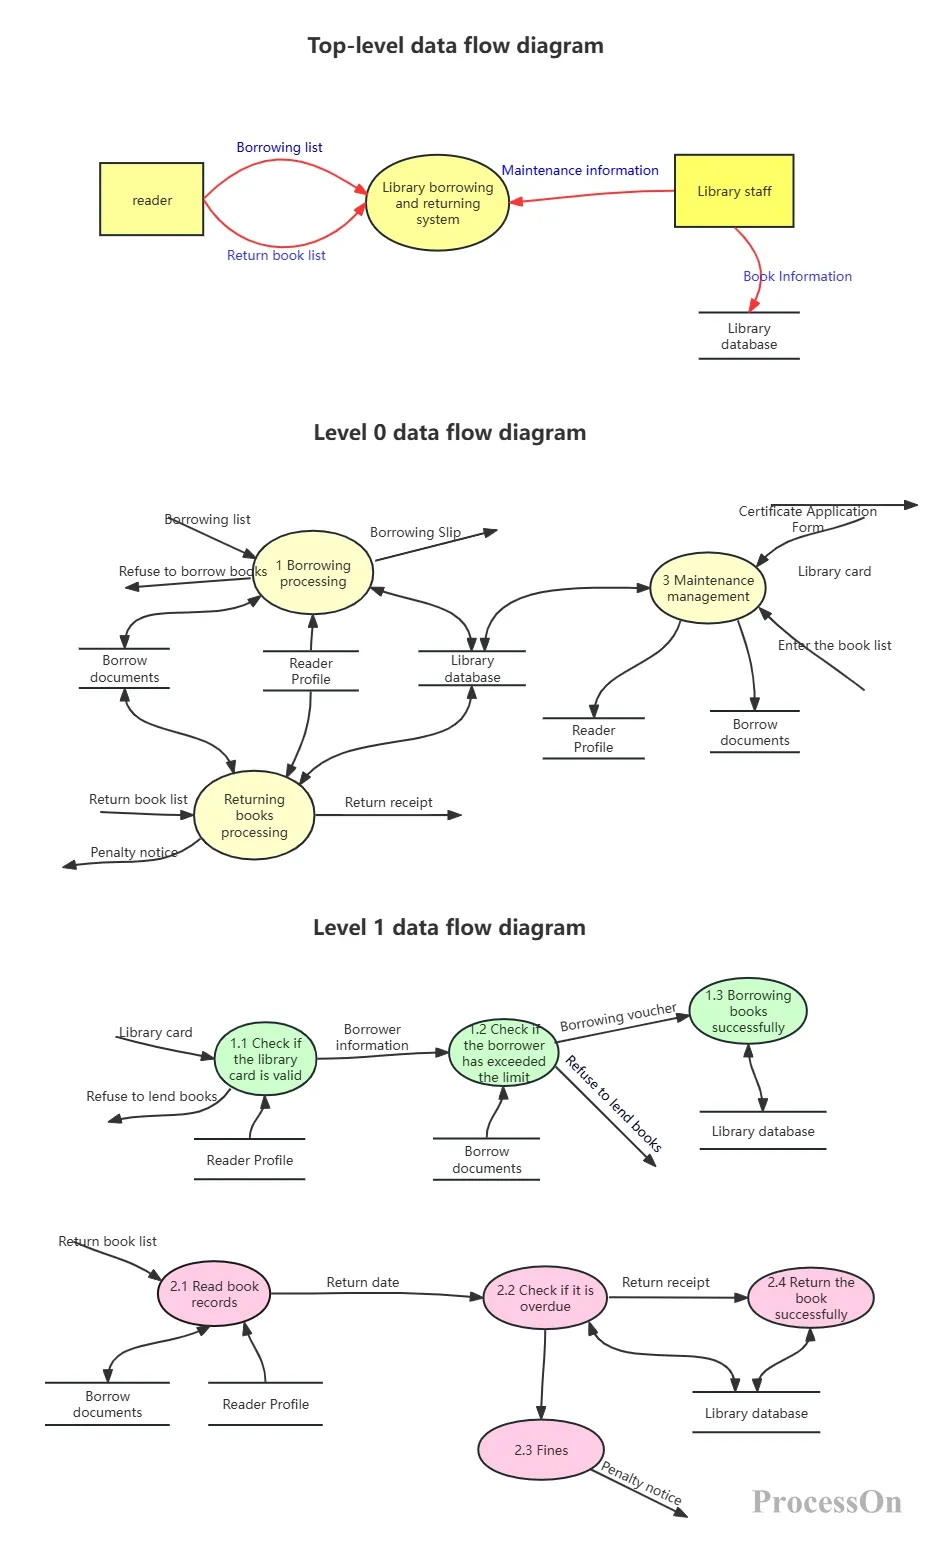
Book borrowing and returning system_data flow diagram
5. To make the data flow diagram easier to understand, you can add necessary comments or descriptions to explain the role of the elements.
6. Arrange the elements reasonably to ensure clear data flow and logical coherence.
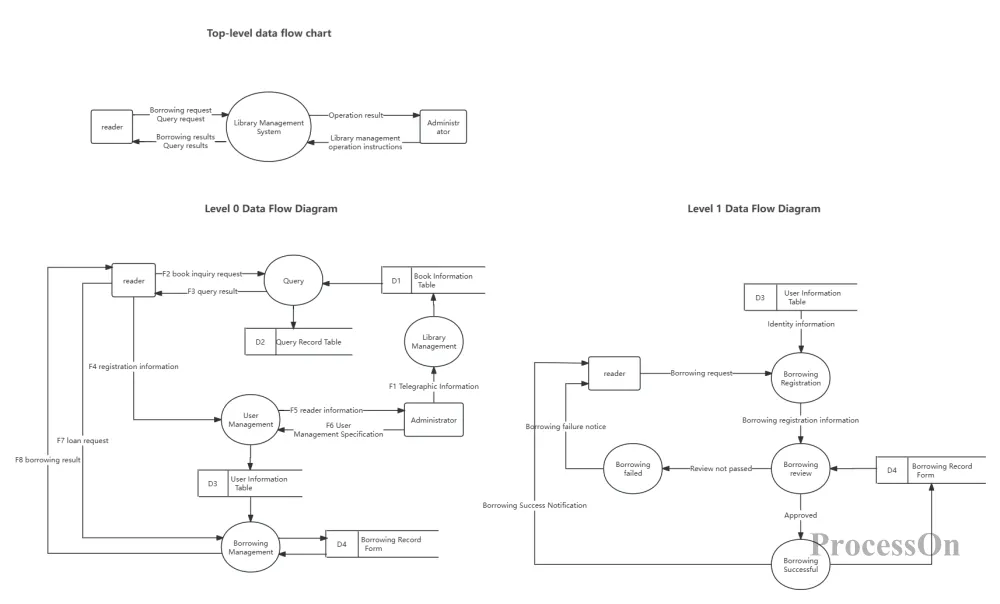
Library management system data flow diagram
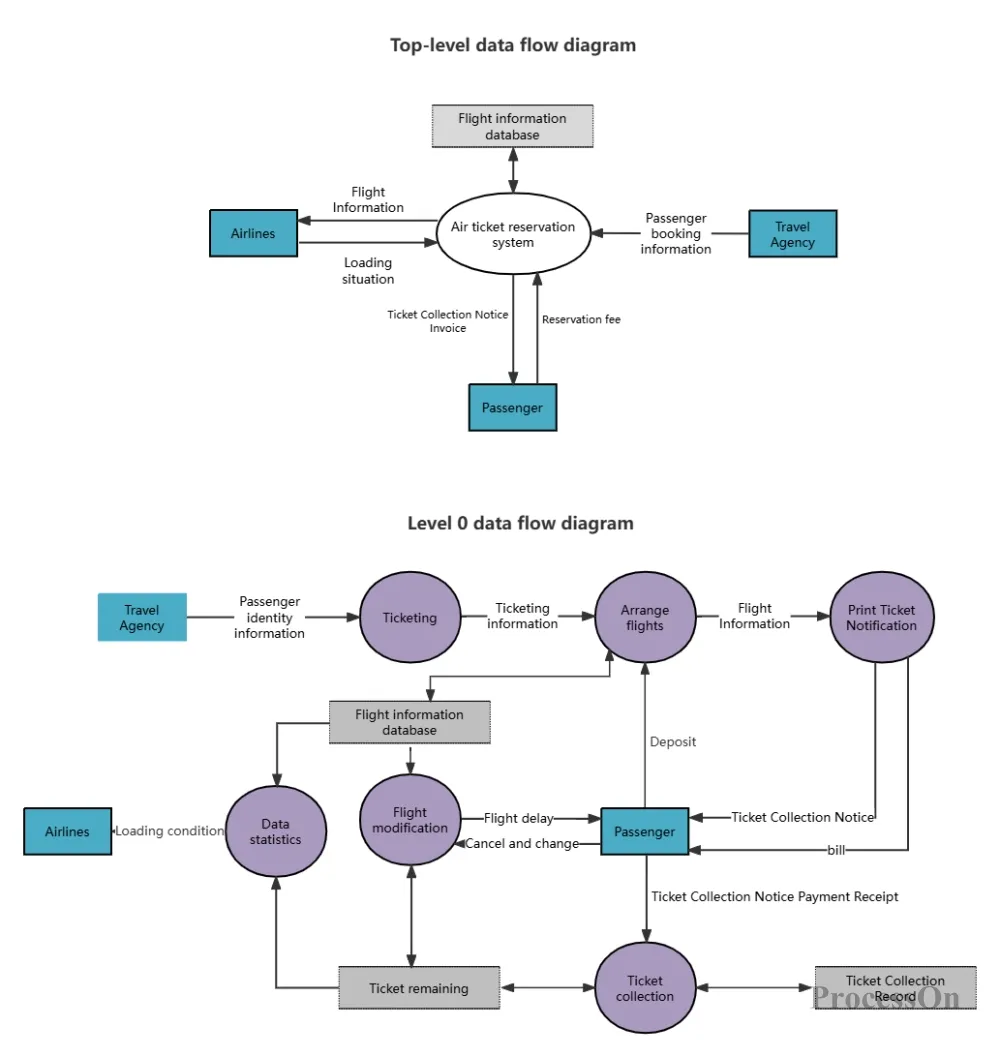
Airline booking system data flow diagram
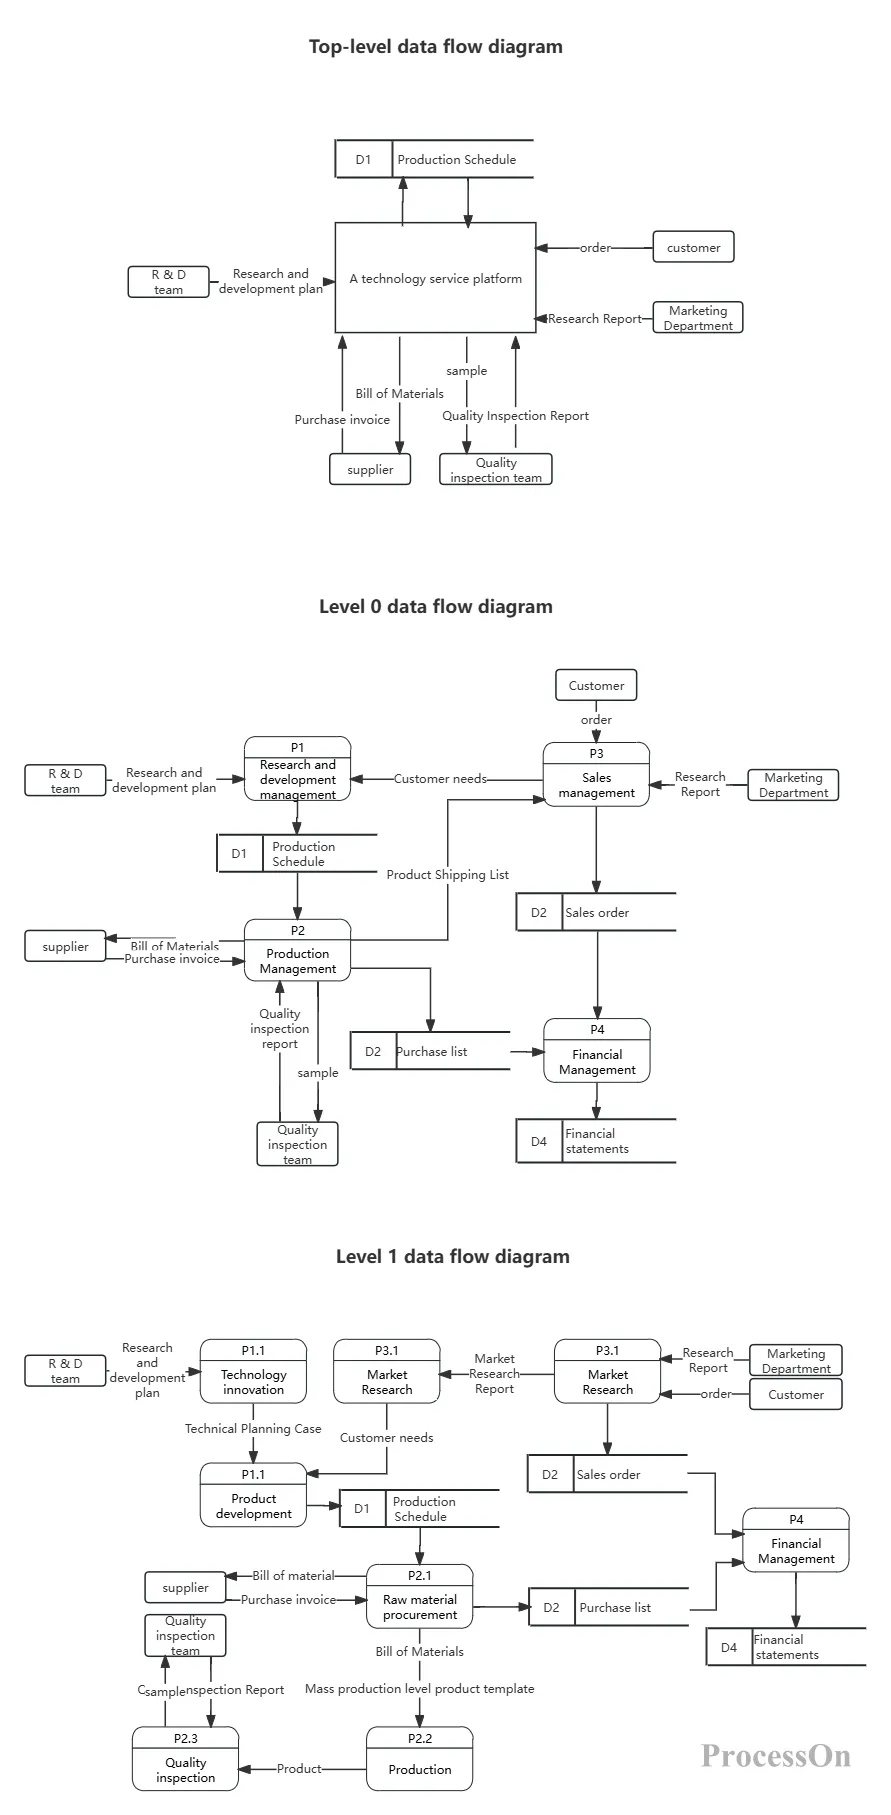
Data flow diagram of a technical service platform
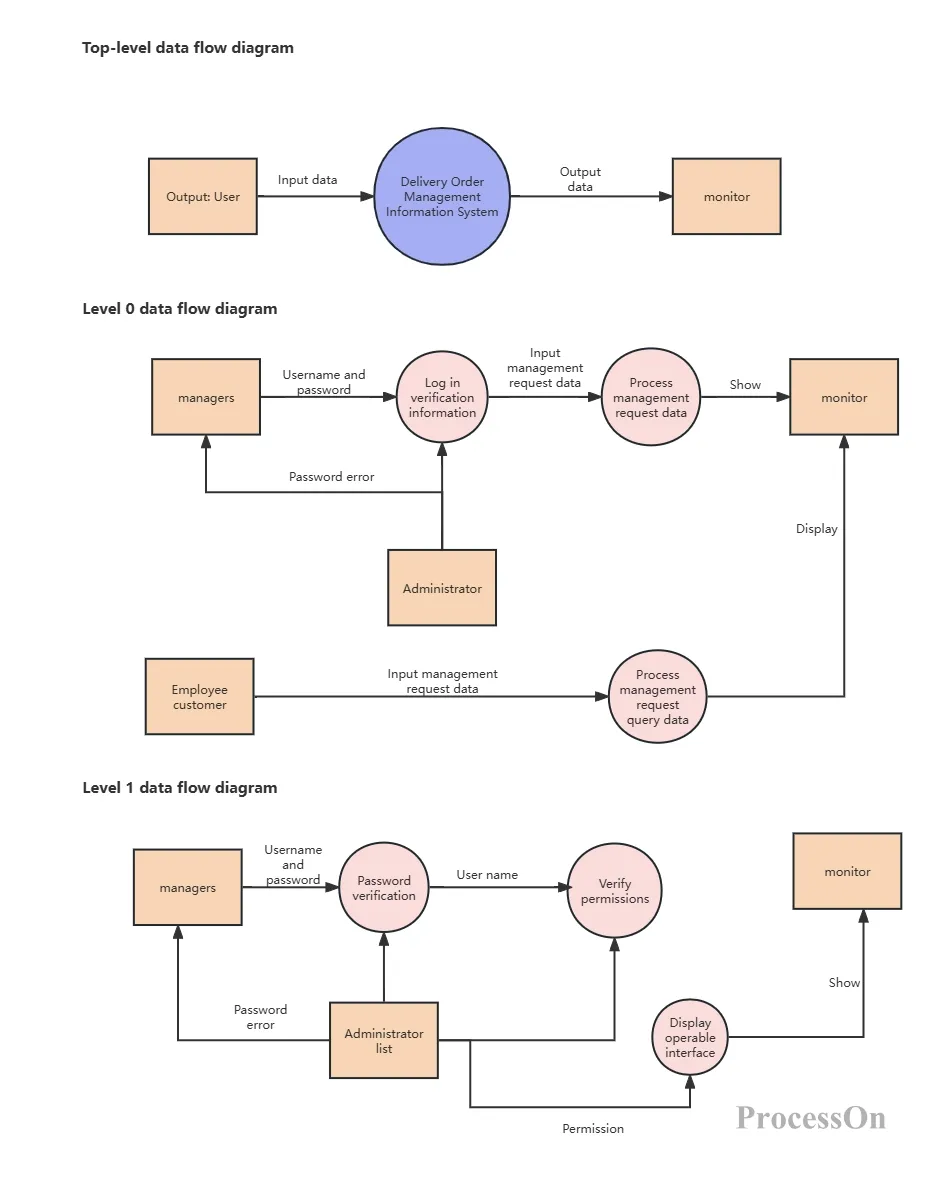
Information System Data Flow Diagram
The above is the relevant content of data flow diagrams. Data flow diagrams can not only guide technical personnel in system design and troubleshooting, but also enable business personnel to better understand data flow and processing processes and deepen their understanding of the business.