EER diagram (Enhanced Entity The Enhanced Entity Relationship Diagram (ERD), also known as the Enhanced Entity Relationship Diagram, is a powerful tool for visual database design. It not only inherits the essence of the traditional ER diagram (Entity Relationship Diagram), but also expands more functions and details, making database design more intuitive and flexible. The following will explain the EER diagram in detail from the aspects of concepts, differences from ER diagrams, symbols, drawing tutorials, examples, etc.
EER diagram is a graphical database design tool that uses graphical symbols and connecting lines to represent entities, attributes, and the relationships between them. Entities represent tables in the database, attributes represent fields in the table, and relationships represent the connections between different tables. EER diagrams are not only used to show the structure of the database, but also help developers better plan and manage the database to meet the needs of the application.
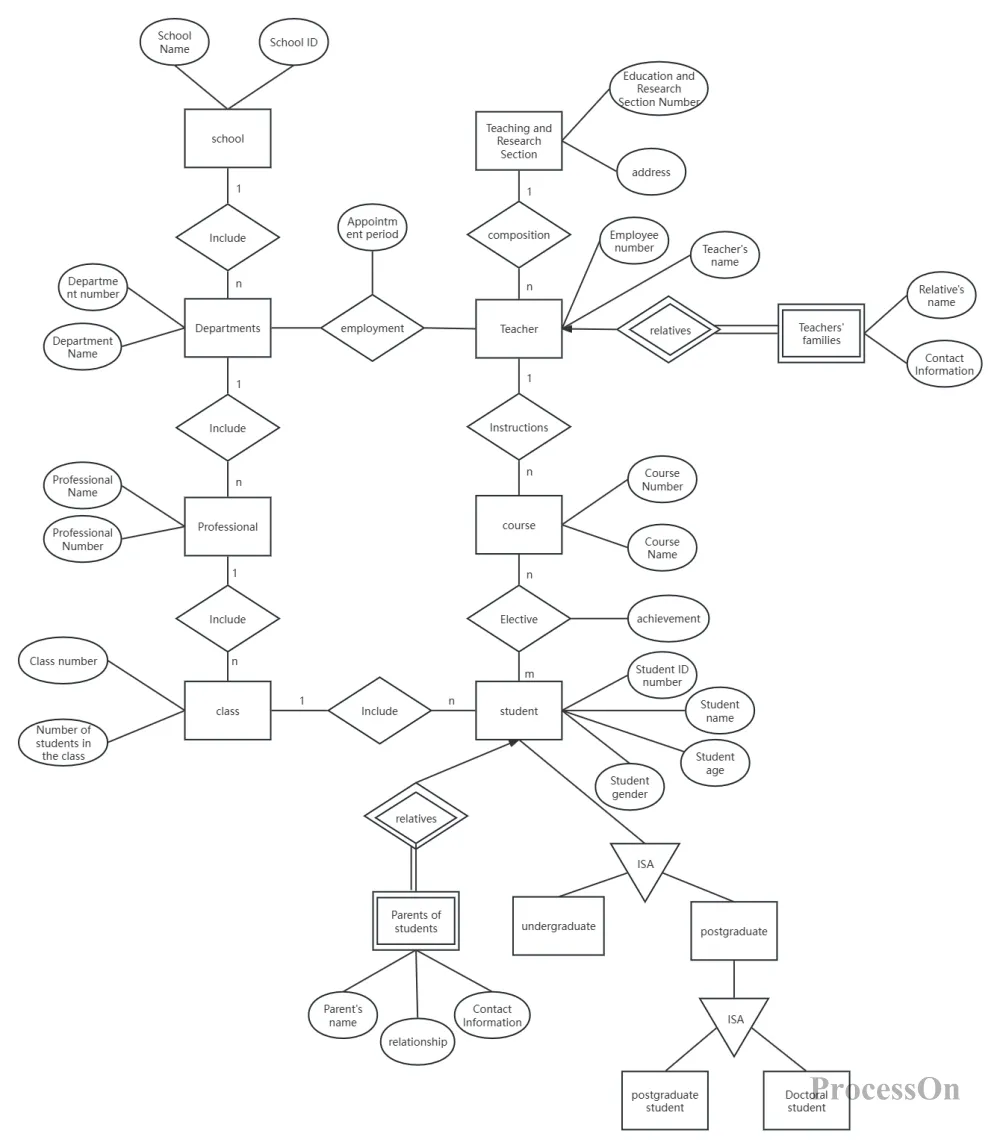
School Management System EER Diagram
EER diagrams play an important role in a variety of database design and management scenarios. It is commonly used for:
Database design: Developers can use EER diagrams to design the database structure, including defining tables, fields, and relationships between them.
Database optimization: Through EER diagrams, developers can visually see the redundancy and complexity in the database and optimize it.
Database documentation: The EER diagram can be used as a document of the database structure to facilitate understanding and communication between developers and database administrators.
Database reverse engineering: EER diagrams can also be used to generate SQL scripts for databases to quickly create databases.
ER diagram is an entity relationship diagram, and EER diagram is an extension of ER diagram. There are significant differences in functions and details between the two:
Functional extension: EER diagram provides more functions and details, such as subclass/superclass, multiple relationships, multi-valued dependencies, etc., making database design more flexible and extensible.
Rich symbols: EER diagrams use more symbols and concepts to better describe data models in the real world.
Wide range of application scenarios: EER diagrams are not only used for database design, but also for database optimization, documentation, reverse engineering and other scenarios.
If you want to know more about ER diagrams, you can check What is an Entity Relationship Diagram (ERD) and How to Draw an ERD? .
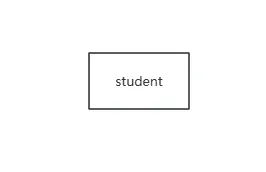
1. Entity
Representation method: Represented by a rectangular frame.
Definition: An entity is an independent, specific thing or object in the real world, which usually corresponds to a table in the database.
Function: Entity is the basic unit of database design and is used to describe objects in the real world.
2. Attribute
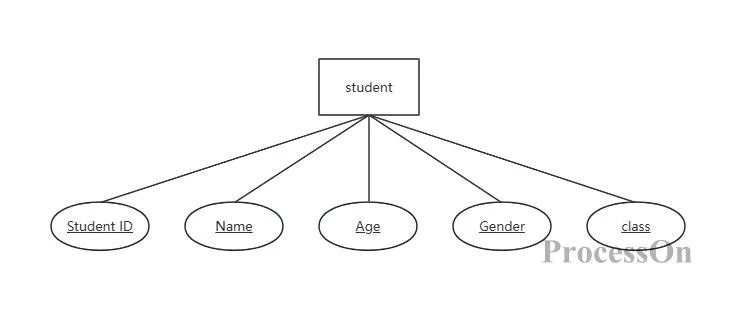
Representation method: Represent it with an elliptical frame and connect it with the corresponding entity with an undirected line.
Definition: An attribute is a characteristic or description of an entity that describes a specific feature or aspect of the entity.
Function: Attributes usually correspond to fields in a table in a database and are used to store specific information about an entity.
3. Relationship
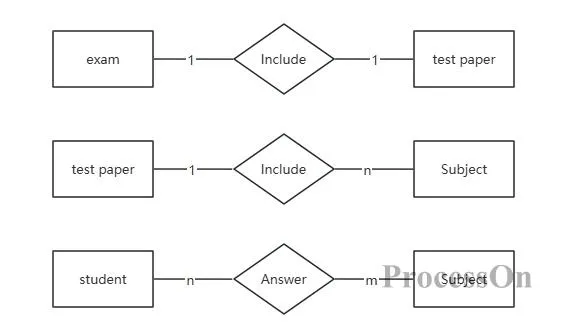
Representation method: Represented by a diamond frame and connected to the relevant entities with undirected lines.
Definition: Relationships represent connections and dependencies between entities.
type:
One-to-one (1:1): There is a unique correspondence between one entity and another entity.
One-to-many (1:n): There is an association between one entity and multiple entities.
Many-to-many (m:n): Multiple entities can be related to each other.
Function: Relationships in databases are usually implemented through foreign keys, which are used to connect different tables.
4. Special elements
Subclass/Superclass:
Definition: A subclass is an entity type that inherits attributes and relationships from a superclass.
Representation method: In the EER diagram, subclasses are usually located below the superclass, and a line connects them to indicate the inheritance relationship.
Multivalued Relationship:
Definition: An entity can have multiple instances of a relationship with another entity. These entities are subclasses of multiple entities and have multiple superclasses. In multiple inheritance , the attributes of the subclass are the union of the attributes of all superclasses.
Representation method: In EER diagrams, multiple relationships are usually represented by adding special symbols or comments inside the relationship diamond box.
5. Other Elements
Connecting lines: used to connect entities, attributes, and relationships to indicate the association between them.
Comments and descriptions: Used to provide further explanation and description of entities, attributes, and relationships for a better understanding of the database design.
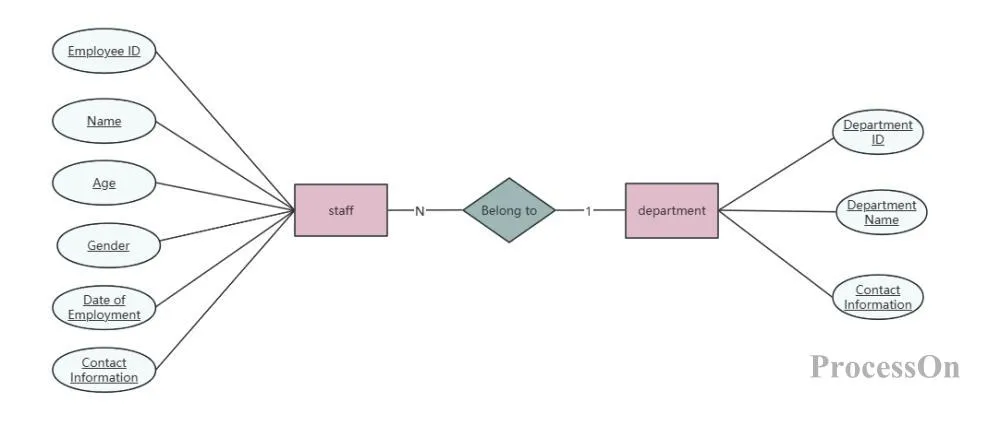
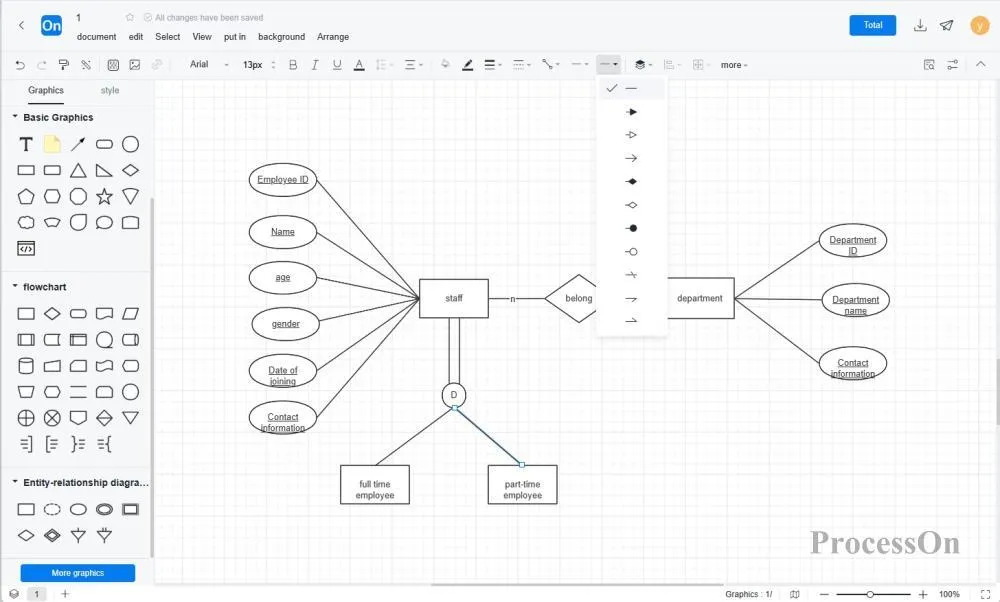
Suppose we have a simple ER diagram with two entities: Employee and Department. The Employee entity has attributes such as employee ID, name, age , date of employment, and contact information , and the Department entity has attributes such as department name , department ID, and contact information . There is a "belongs to" relationship between Employee and Department, indicating that the employee belongs to a department. The following relationships can be sorted out:
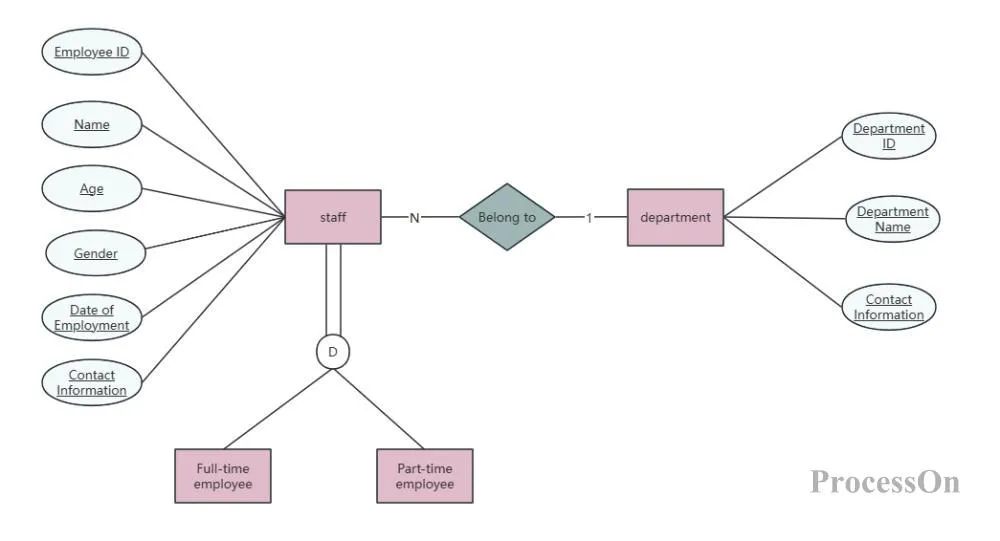
If we expand it into an EER diagram, we can introduce the concept of supertypes and subtypes. For example, we can further subdivide the employee entity into two subtypes: full-time employees and part-time employees. At this point, full-time employees and part-time employees will be subtypes of the employee entity .
1. Open the ProcessOn official website, go to the personal file page, and click New to create a flowchart .
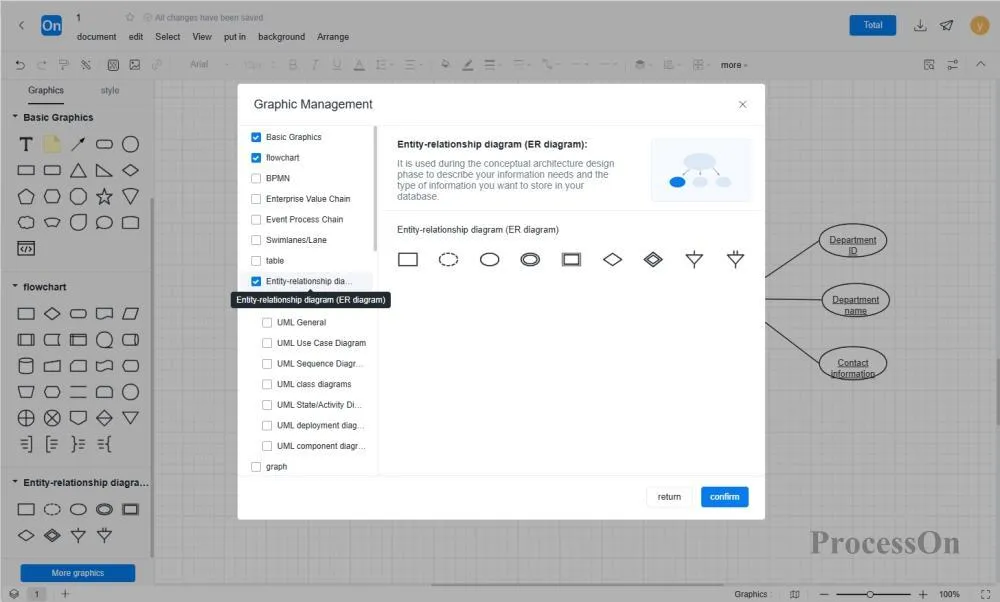
2. Click More Graphics in the graphics library on the left, find the ER diagram, and click OK.
3. ER diagram symbol from the graphic library on the left side of the flowchart maker to the canvas, double-click the graphic to add text, and click "+" on the graphic to create lines to connect different ER symbols.
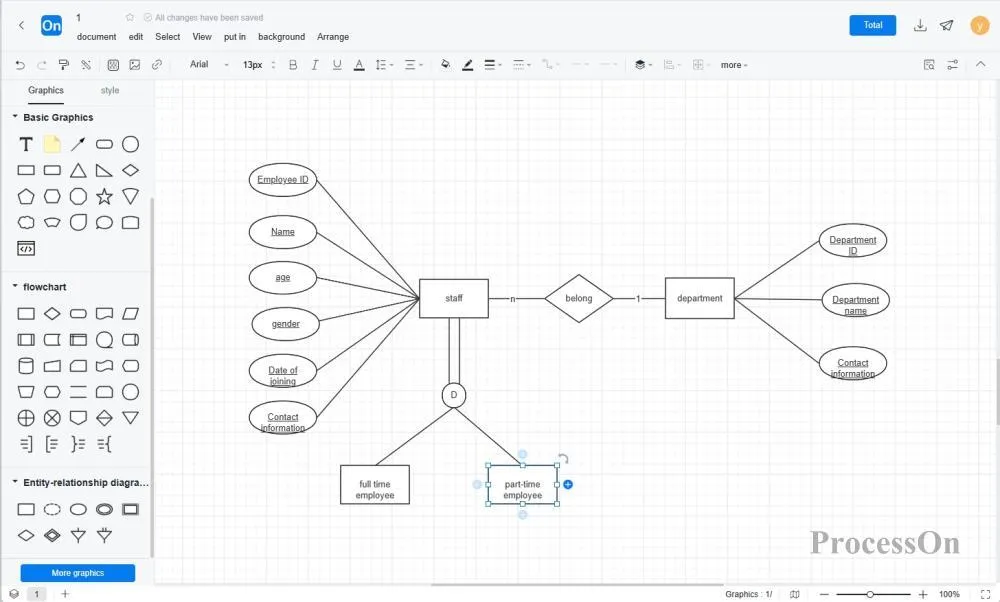
4. Select the connection and click on the top toolbar to modify the connection type.
The ProcessOn community contains a variety of EER diagram templates for reference, and supports cloning to improve drawing efficiency. The following are some templates for sharing.
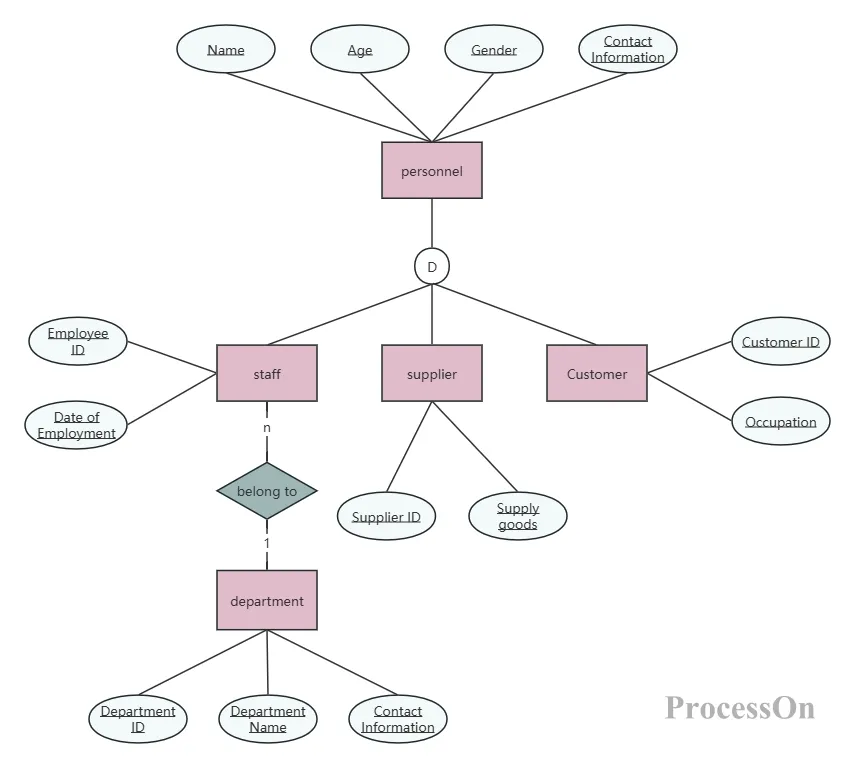
Enterprise Personnel Management System EER Diagram
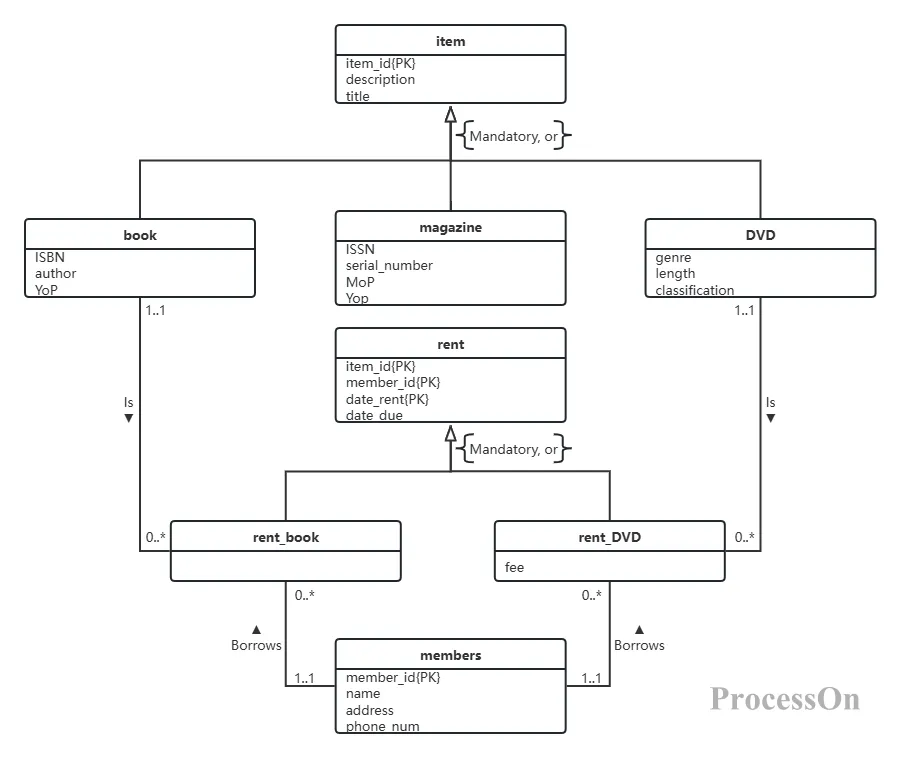
EER diagram of library lending system
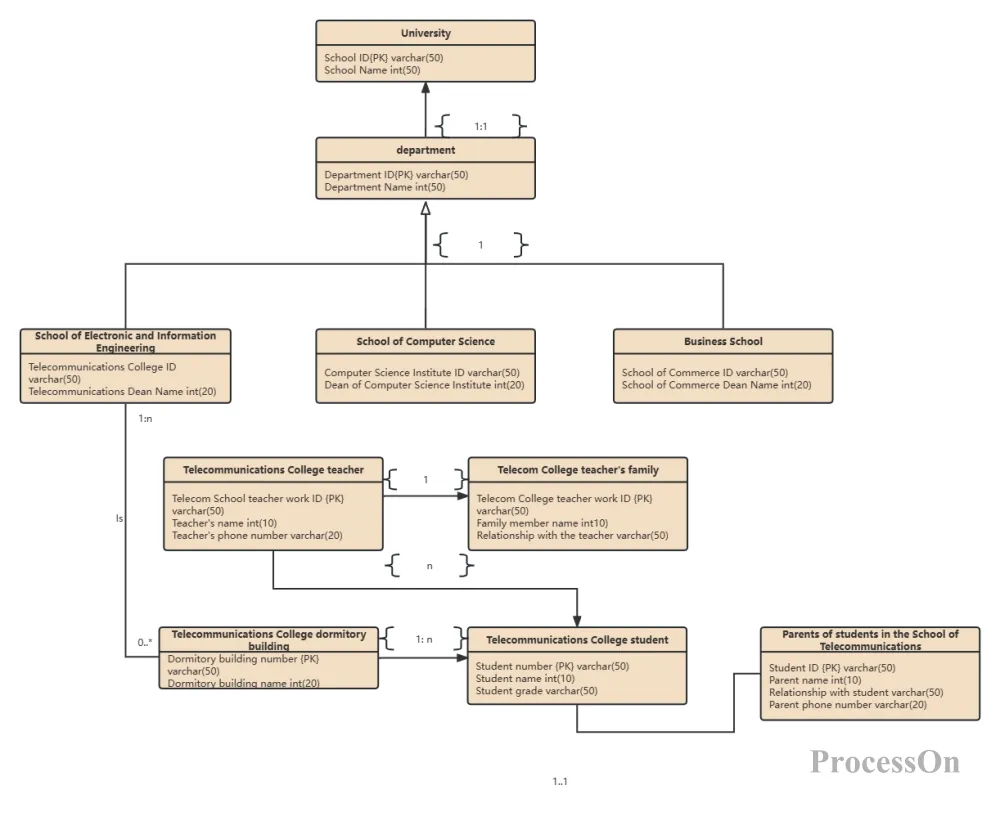
EER diagram of university department management system
In short, EER diagram is a powerful database design tool. It not only inherits the advantages of traditional ER diagram, but also expands more functions and details. By using EER diagram, developers can better plan and manage database structure and improve development efficiency. Whether in database design, optimization, documentation and other scenarios, EER diagram plays an important role. I hope this article can provide you with useful reference and guidance for applying EER diagram in actual work .