

In today's data-driven society, data modeling is essential for understanding and managing complex data structures. ER diagrams are a powerful visualization tool for describing entities and the relationships between them. Whether building a new information system or improving an existing data model, ER diagrams can help developers and stakeholders clearly understand data requirements and structures.
This article aims to introduce the basic concepts, drawing methods and user cases of ER diagrams. Through this article, you can understand and master the basic skills of drawing ER diagrams, laying a solid foundation for developing efficient and reliable applications.
ER diagram (Entity-Relationship Diagram), also known as entity-relationship diagram, is a conceptual diagram used to describe data models, mainly used in the database design phase. ER diagram can help designers and developers understand data requirements and build corresponding database structures.
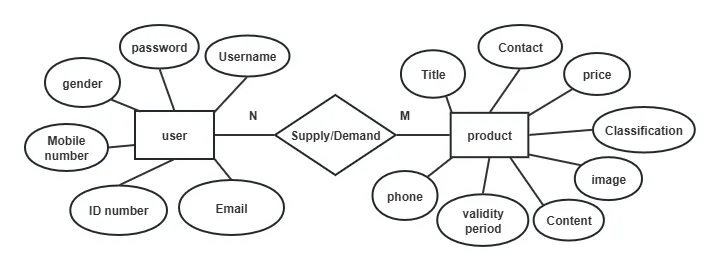
ER diagrams are widely used in many scenarios. When should we draw ER diagrams? Here are some main usage scenarios:
1. System analysis and design. In the early stages of system development, ER diagrams are used to capture business requirements and define data structures. They can also help analysts and designers understand the data elements in business processes and the relationships between them.
2. Database design. ER diagrams can be used to define the logical structure of a database, including entities, attributes, and relationships. Based on ER diagrams, the physical structure of the database, such as table structure, indexes, etc., can also be further designed.
3. Software Engineering. ER diagrams also play a key role in helping developers understand the data requirements of each module and promoting the interface design between modules. During the integration testing phase, ER diagrams can be used to verify the consistency and integrity of data.
4. Data warehouse and business intelligence. ER diagrams can be used to build the architecture of data warehouses and define the relationship between fact tables and dimension tables. At the same time, it can also be used for report and dashboard design. The data model built based on ER diagrams can support advanced data analysis and report generation.
5. Data governance and management. ER diagrams provide metadata information about data elements, which helps with data governance and documentation; when performing data quality control, ER diagrams make it easier to discover and resolve data quality issues.
6. Project management and collaboration. ER diagrams, as a shared language, help people from different backgrounds (such as business analysts and IT experts) communicate effectively; when business requirements change, ER diagrams can be used to assess the scope of impact and plan corresponding data structure adjustments.
7. Teaching and training. ER diagrams are often used as a basic tool for teaching database principles and techniques. For new employees or students, ER diagrams can be an important tool for learning database design.
It is not difficult to see from these application scenarios that ER diagrams not only play a core role in database design, but also play an important role in the entire software development life cycle. Whether from a technical perspective or a business perspective, ER diagrams are a very valuable tool. I hope you can spend some time studying and learning them, and I believe that they will be of immediate help to your work.
ER diagram consists of three parts: entity, attribute and relationship.
1. Entity
Entities represent objects or concepts in the real world, such as "customer", "product" or "order". Each entity has some attributes, which are used to describe the characteristics of the entity, such as "customer's name" and "product price".
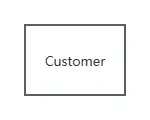
Entities are usually represented by a rectangular box with the name of the entity written inside the box. For example:
2. Attribute
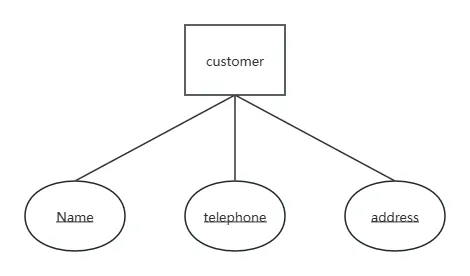
A characteristic of an entity. An entity can be characterized by several attributes. Attributes cannot be separated from entities. Attributes are relative to entities . For example, the attributes of "customer" can include "name", "telephone", "address", etc.
Attributes are usually represented by ovals or underscores , and are connected to the corresponding entities by undirected edges .
3. Relationship
A connection, also called a relationship, represents how two or more entities are related. For example, a "Create" connection between "Customer" and "Order".
Contacts are usually represented by a diamond with the name of the contact written inside.
For example: 1 customer has multiple orders

Relationships and entities are connected by lines, and the relationship type is marked on the connecting line, such as one-to-one (1:1), one-to-many (1:N), and many-to-many (M:N).
Next, let’s share the relationship between entities and connections.
In the ER diagram, there are three basic types of relationships between entities and relationships: one-to-one (1:1), one-to-many (1:N), and many-to-many (M:N).
The following are the three types of relationships:
1. One - to-one relationship (1:1)
Indicates that each entity in two entity sets can only be associated with at most one entity in the other entity set. For example, the relationship between "student" and "student status". A student can only have one student status, and a student status can only correspond to one student.

2. One-to-many relationship (1:N)
Indicates that each entity in one entity set can be associated with multiple entities in another entity set, while each entity in another entity set can only be associated with at most one entity in the previous entity set. For example, the relationship between "class" and "student". A class can have multiple students, but each student can only belong to one class.

3. Many-to-Many Relationship (M:N)
Indicates that each entity in two entity sets can be associated with multiple entities in the other entity set, and vice versa. For example, the relationship between "student" and "course". A student can take multiple courses, and a course can be taken by multiple students.

Now that you have learned the basic information about ER diagrams, we will use four user cases found in the template library to help you integrate this information and master the drawing of ER diagrams quickly and efficiently.
1. ER diagram of student elective courses
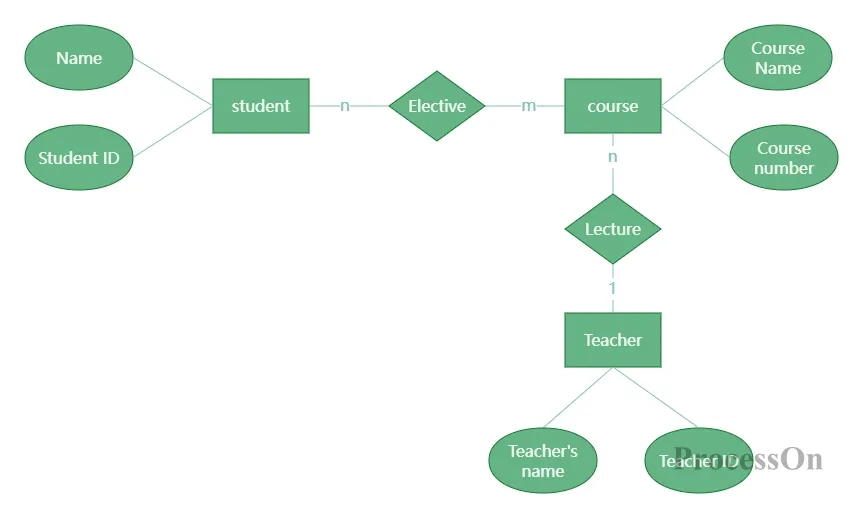
Student elective course ER diagram
2. ER diagram of garbage classification system
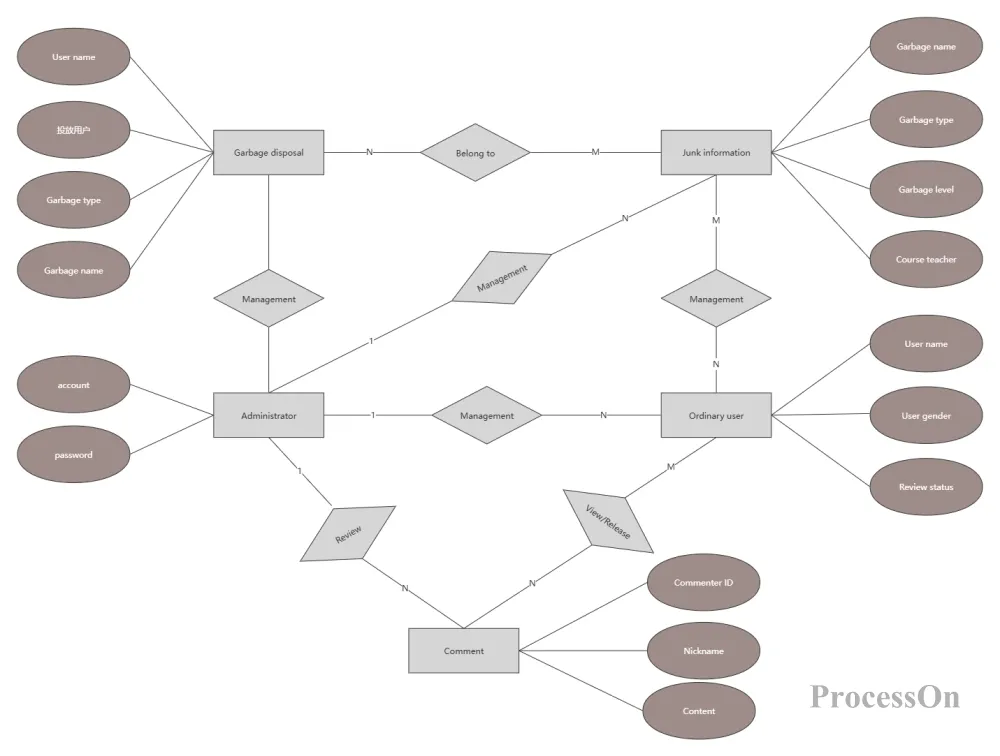
Garbage classification system ER diagram
3. Blog ER Diagram
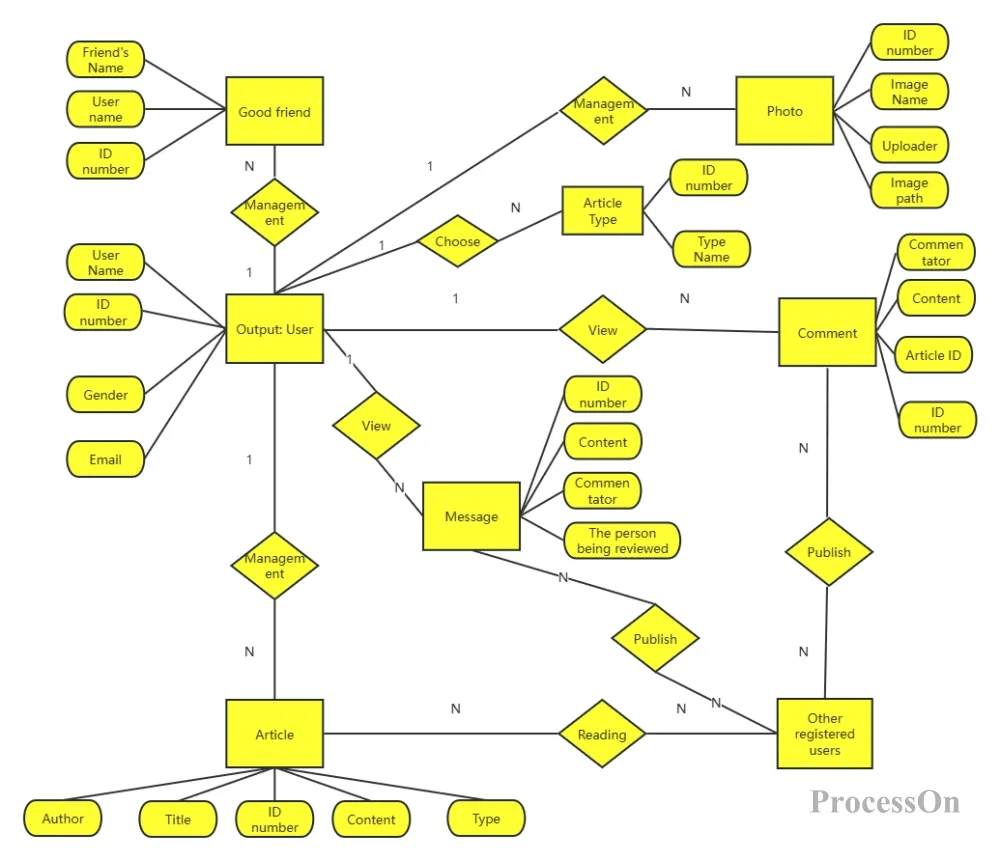
4. Mine ER diagram
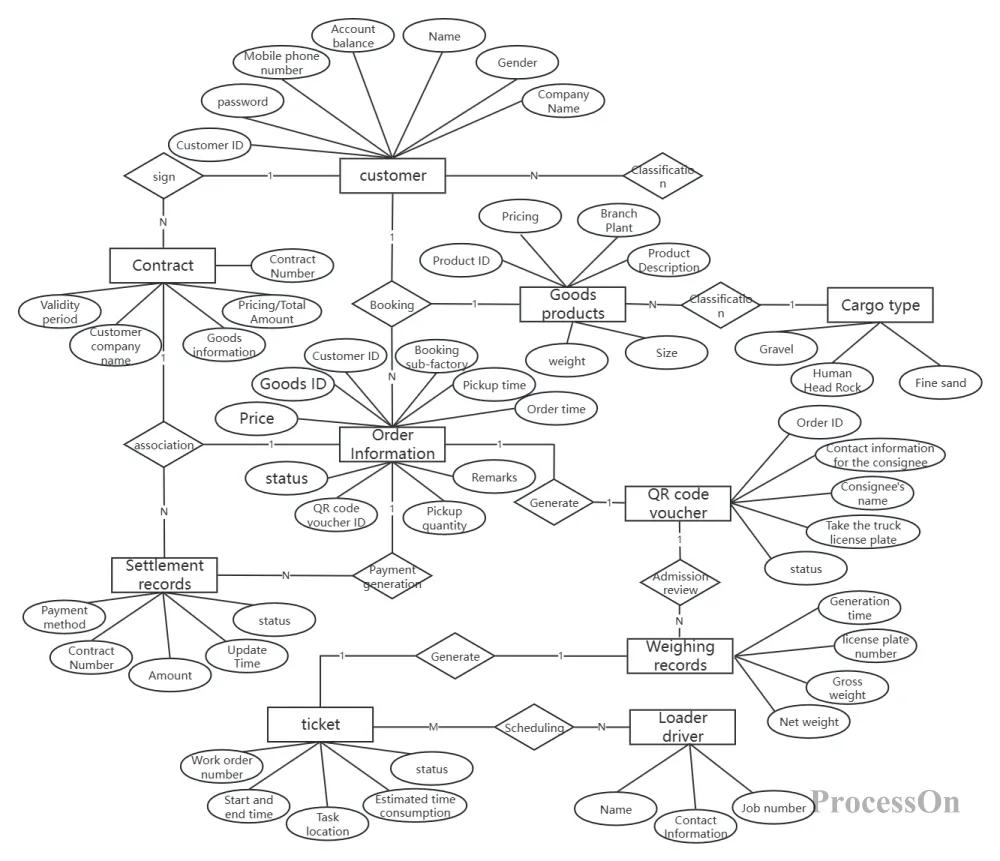
Drawing ER diagram is a basic step in database design, which can help us clearly define the data model. Here are some basic steps to use ProcessOn to help you draw ER diagram :
Step 1 : Log in to the ProcessOn account and create a new flowchart.
Step 2 : Click [More Graphics] in the lower left corner, check [Entity Relationship Diagram], and add the ER diagram icon to the graphics library on the left.
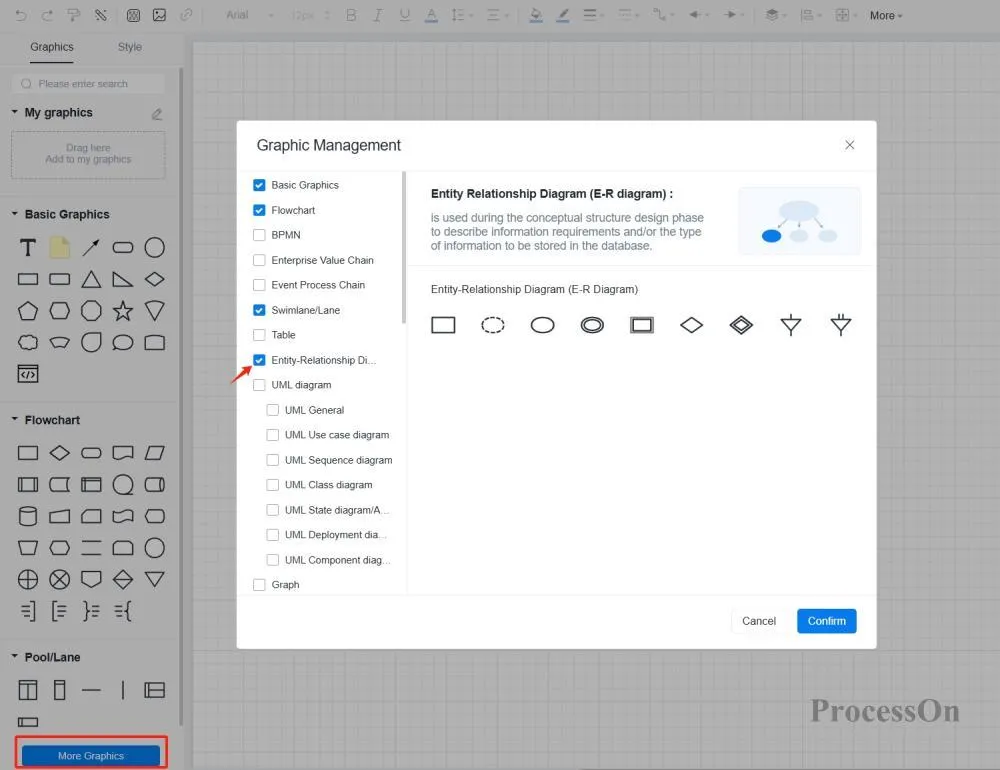
Step 3: Define the entity. Drag a rectangular shape to the editing area and write the name of the entity in the box.
Step 4: Define attributes. Attributes are represented by ovals, placed next to the corresponding entity box, and connected to the entity through lines.
Step 5: Define the relationship. The relationship is represented by a diamond, and the type of relationship is written on the connecting line, such as 1:1, 1:N, M:N.
Step 6: Adjust the details. Make sure all entities and attributes are listed correctly; check that all necessary connections have been defined; adjust the positions of entities to make the ER diagram layout clear and beautiful. You can also use the [Style] function of the flowchart to beautify the ER diagram as a whole.
ER diagrams not only present the entities, attributes and their complex relationships in a database in an intuitive and graphical way, but also provide a solid foundation for database logical modeling through clear association types and hierarchical structures. There are more beautiful and practical ER diagram templates in the ProcessOn template library to help you complete database modeling simply and conveniently.