In today's fast-paced business environment, project management flowcharts have become an important tool to ensure the smooth progress and efficient completion of projects. As a project manager, mastering the drawing and application of relevant flowcharts is essential to improving team collaboration efficiency, optimizing resource allocation, and ensuring the achievement of project goals. This article aims to provide project managers with a comprehensive guide to project management flowcharts.
A project management flowchart is a graphical tool used to show the relationship between various stages and tasks of a project during the project management process. It graphically displays the overall structure of the project, task decomposition, dependencies, time nodes and other information. Through the project management flowchart, project team members can clearly understand the progress of the project, clarify their respective responsibilities and tasks, and effectively avoid waste of resources and duplication of work.
Project managers use flowcharts in a variety of ways, mainly in the following aspects:
Clarify project goals: Through flowcharts, project managers can clarify the ultimate goals of the project and the specific goals of each stage before the project starts, providing a basis for subsequent task decomposition and time scheduling.
Clarify work steps: Flowcharts can clearly show the various stages and tasks of a project, as well as the dependencies between them. Project managers can use this feature to carefully sort out the work steps of the project to ensure that each step is effectively executed by personnel from all departments .
Improve team collaboration efficiency: Through flowcharts, team members can clearly understand their roles and responsibilities, as well as their collaboration with other members. This helps improve team collaboration efficiency and ensure that projects are completed on time and with quality.
Optimize resource allocation: Flowcharts can also help project managers rationally arrange project resources and time, ensuring that resources are fully utilized and avoiding waste and idleness.
There are many types of project management flowcharts, each with its own specific uses and advantages. Common types of project management flowcharts include:
The Gantt chart shows the start and end dates of project tasks and the progress of completion in the form of a timeline. It is one of the most common project management tools and is suitable for situations where a visual display of project progress is needed.
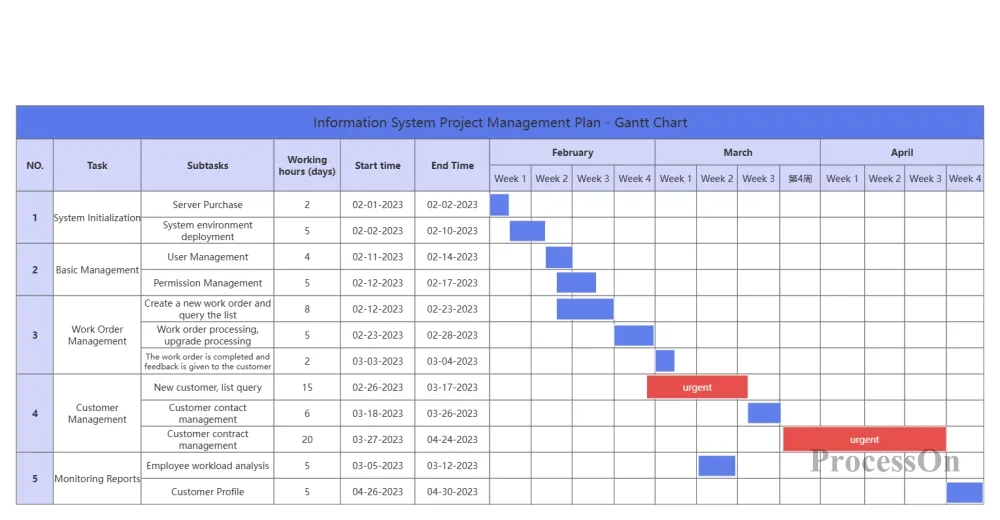
Project Gantt Chart-Go to Edit
The PERT chart is a network diagram that shows the dependencies between tasks and predicts the shortest completion time for the project. It is suitable for projects that need to assess task time and risk.
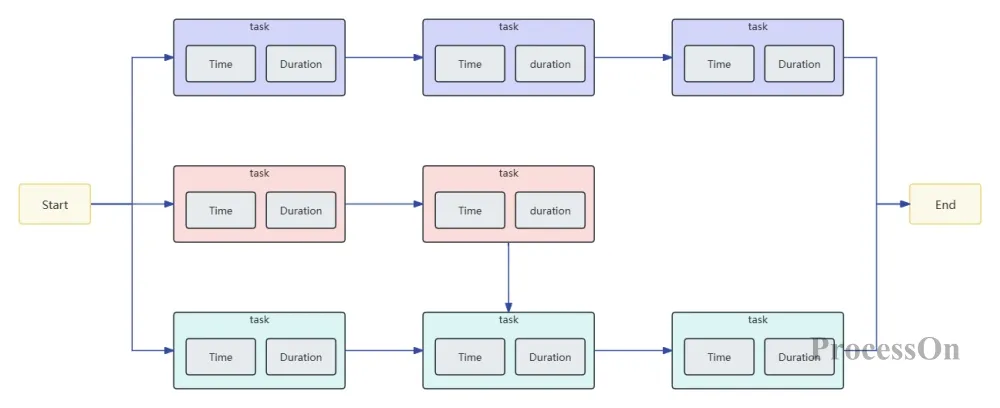
PERT Chart Template-Go to Edit
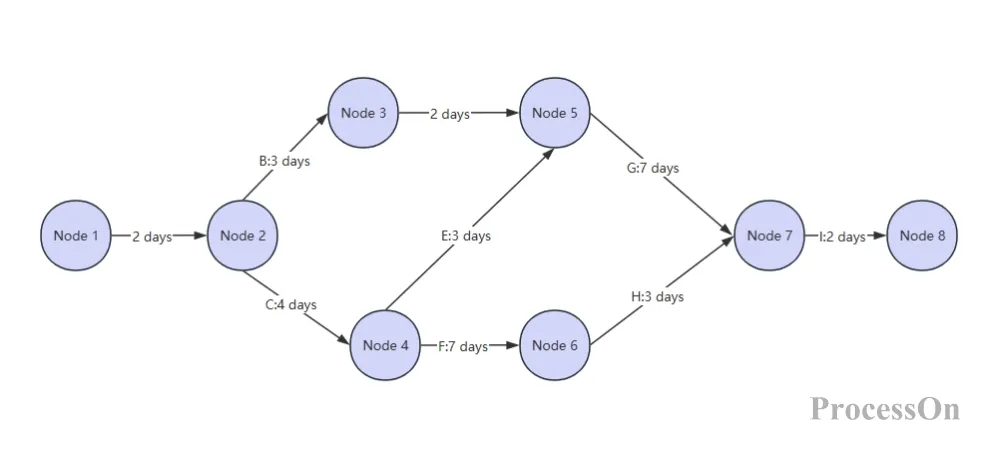
A CPM diagram is also a network diagram that shows all the tasks of a project and the dependencies between them. It helps project managers determine the critical path of the project and how to optimize the execution of the project.
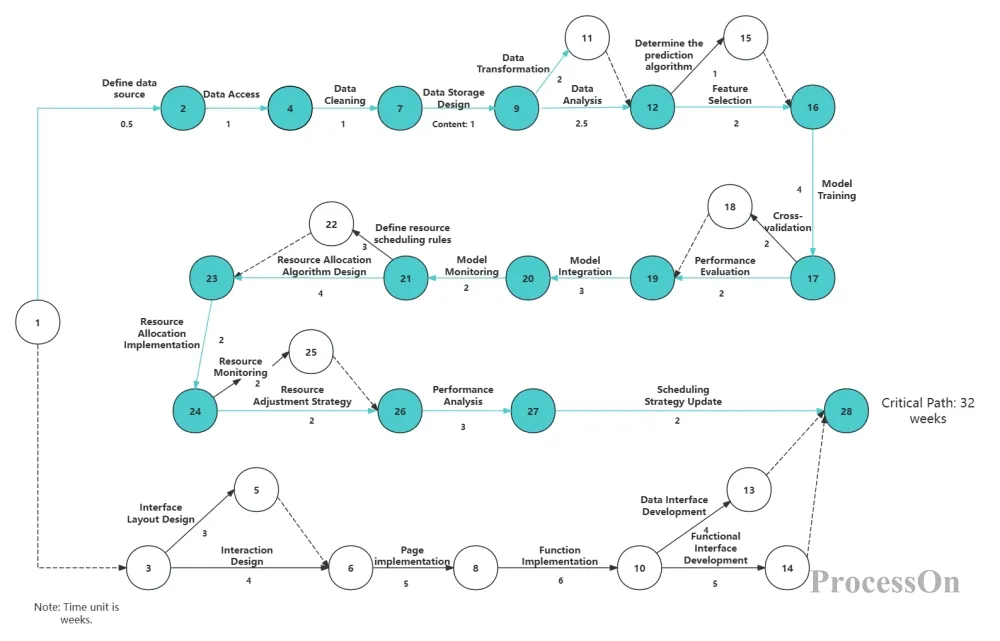
Critical Path Method Diagram - Go to Edit
A work breakdown structure (WBS) diagram is a tree diagram that breaks down a project into smaller, more manageable tasks. It is useful when you need to clarify the scope of the project and allocate resources effectively.
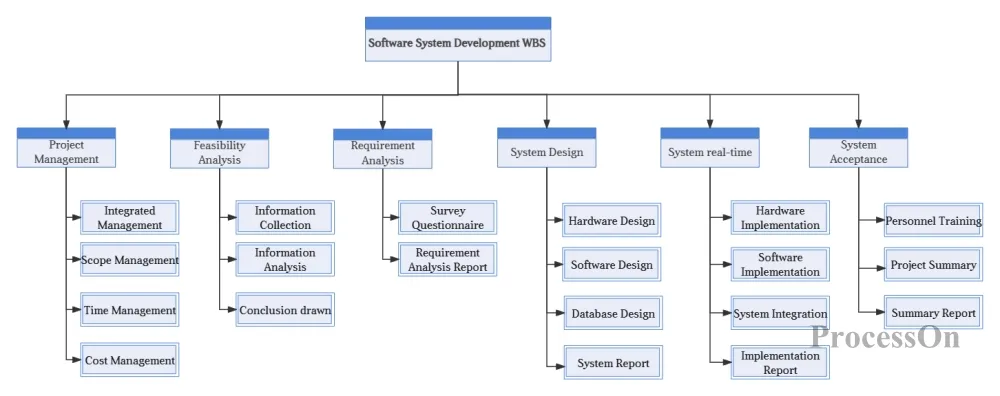
System Development Project WBS Diagram - Go to Edit
A flowchart shows the order in which tasks are performed and the interdependencies between these tasks. It is suitable for situations where you need to visually display the project flow and task dependencies.
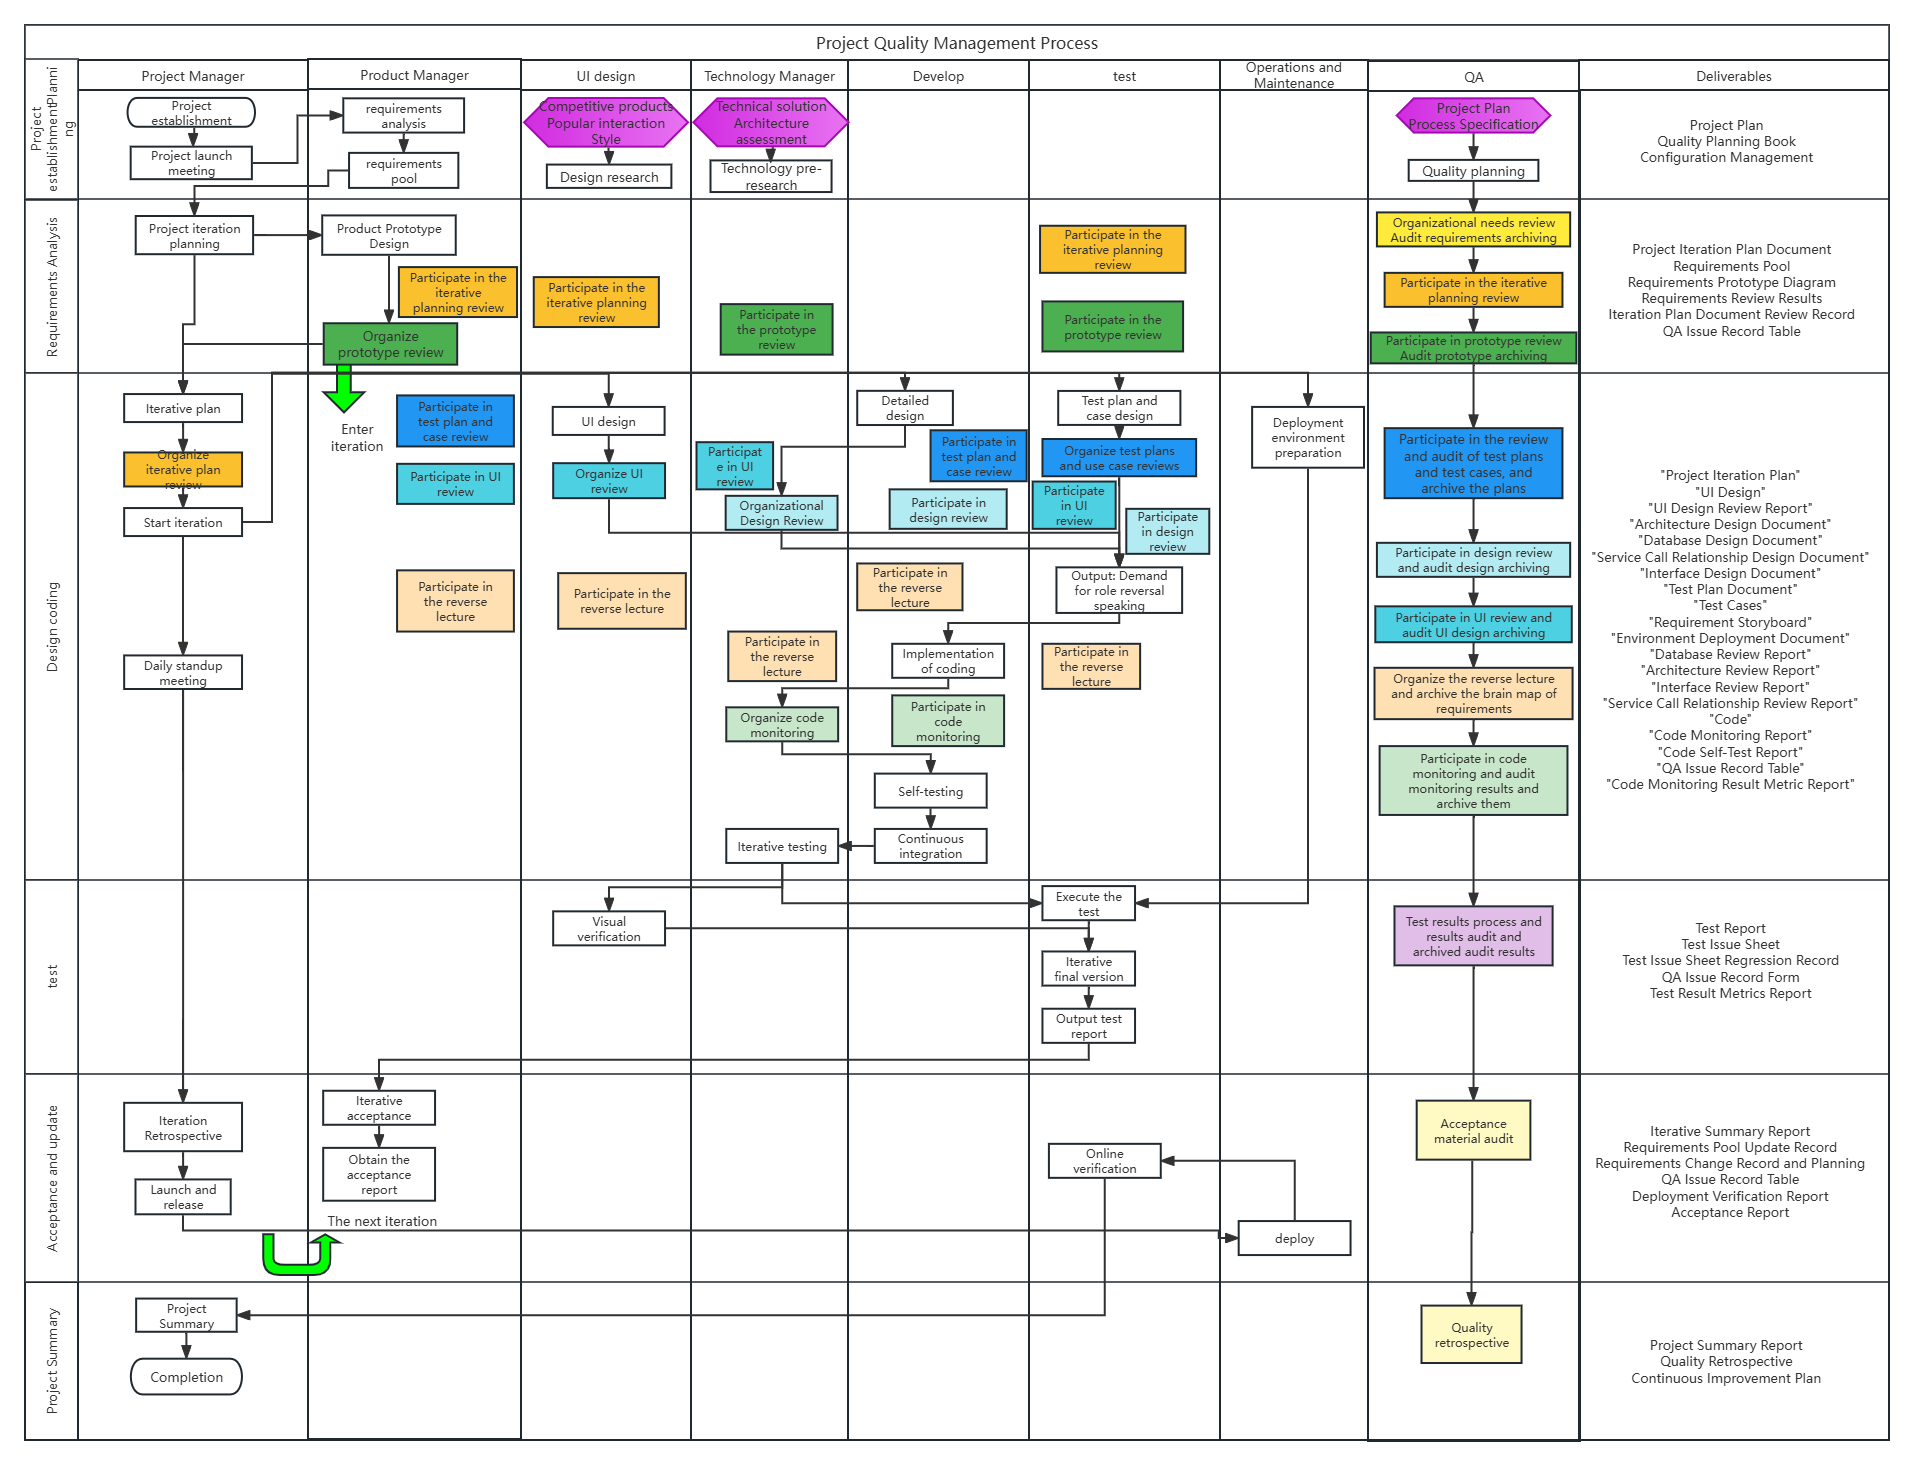
Project Quality Management Process-Go to Edit
Drawing a project management flowchart usually follows these steps :
Determine project goals: clarify the ultimate goal of the project and the specific goals of each stage to provide a basis for subsequent task decomposition and time scheduling.
Decompose project tasks: Break down project goals into several specific tasks to ensure that project management is more detailed and clear.
Clarify task dependencies: Determine the dependencies between tasks to provide a basis for subsequent time arrangement and task scheduling.
Set milestones and time nodes: By setting milestones and time nodes, project management can be more orderly and controllable.
Draw a flowchart: Use a flowchart maker (such as ProcessOn ) to display each task, milestone, and time node in a graphical way. When drawing, pay attention to using appropriate graphic symbols and flow lines to represent the execution order and dependency of tasks. At the same time, you can also use themes, node styles and other functions to beautify the flowchart.
Save and share: Save the drawn project management flowchart to the cloud or export it to PNG, PDF and other formats and store it locally on the device. If necessary, you can also share it with team members for review and discussion.
drawing a project management flowchart , you can choose to draw it manually or use professional flowchart software, such as Visio, Draw.io , ProcessOn , etc. ProcessOn is an online flowchart tool that supports free creation of flowcharts, mind maps, UML, network diagrams, etc. The following is a method for drawing a project management flowchart using ProcessOn as an example:
1. Go to the file page, create a new flowchart, or search for the keyword [project management] in the template community to create a flowchart.
2. Drag the flowchart symbols in the graphic library on the left to the canvas to combine them into flowcharts, Gantt charts, PERT charts, etc. Click the "+" on the graphic to create lines to connect different processes.
3. Select the graphic symbol and in the top style toolbar , you can modify the style of the chart, such as color, line, font, etc. The color matching should be reasonable, and different categories of blocks should be distinguished by different colors, while maintaining the harmony and unity of the overall tone.

The ProcessOn template community contains many industry-rich project management flowchart free templates for reference, and supports cloning to improve drawing efficiency. The following are some templates shared.
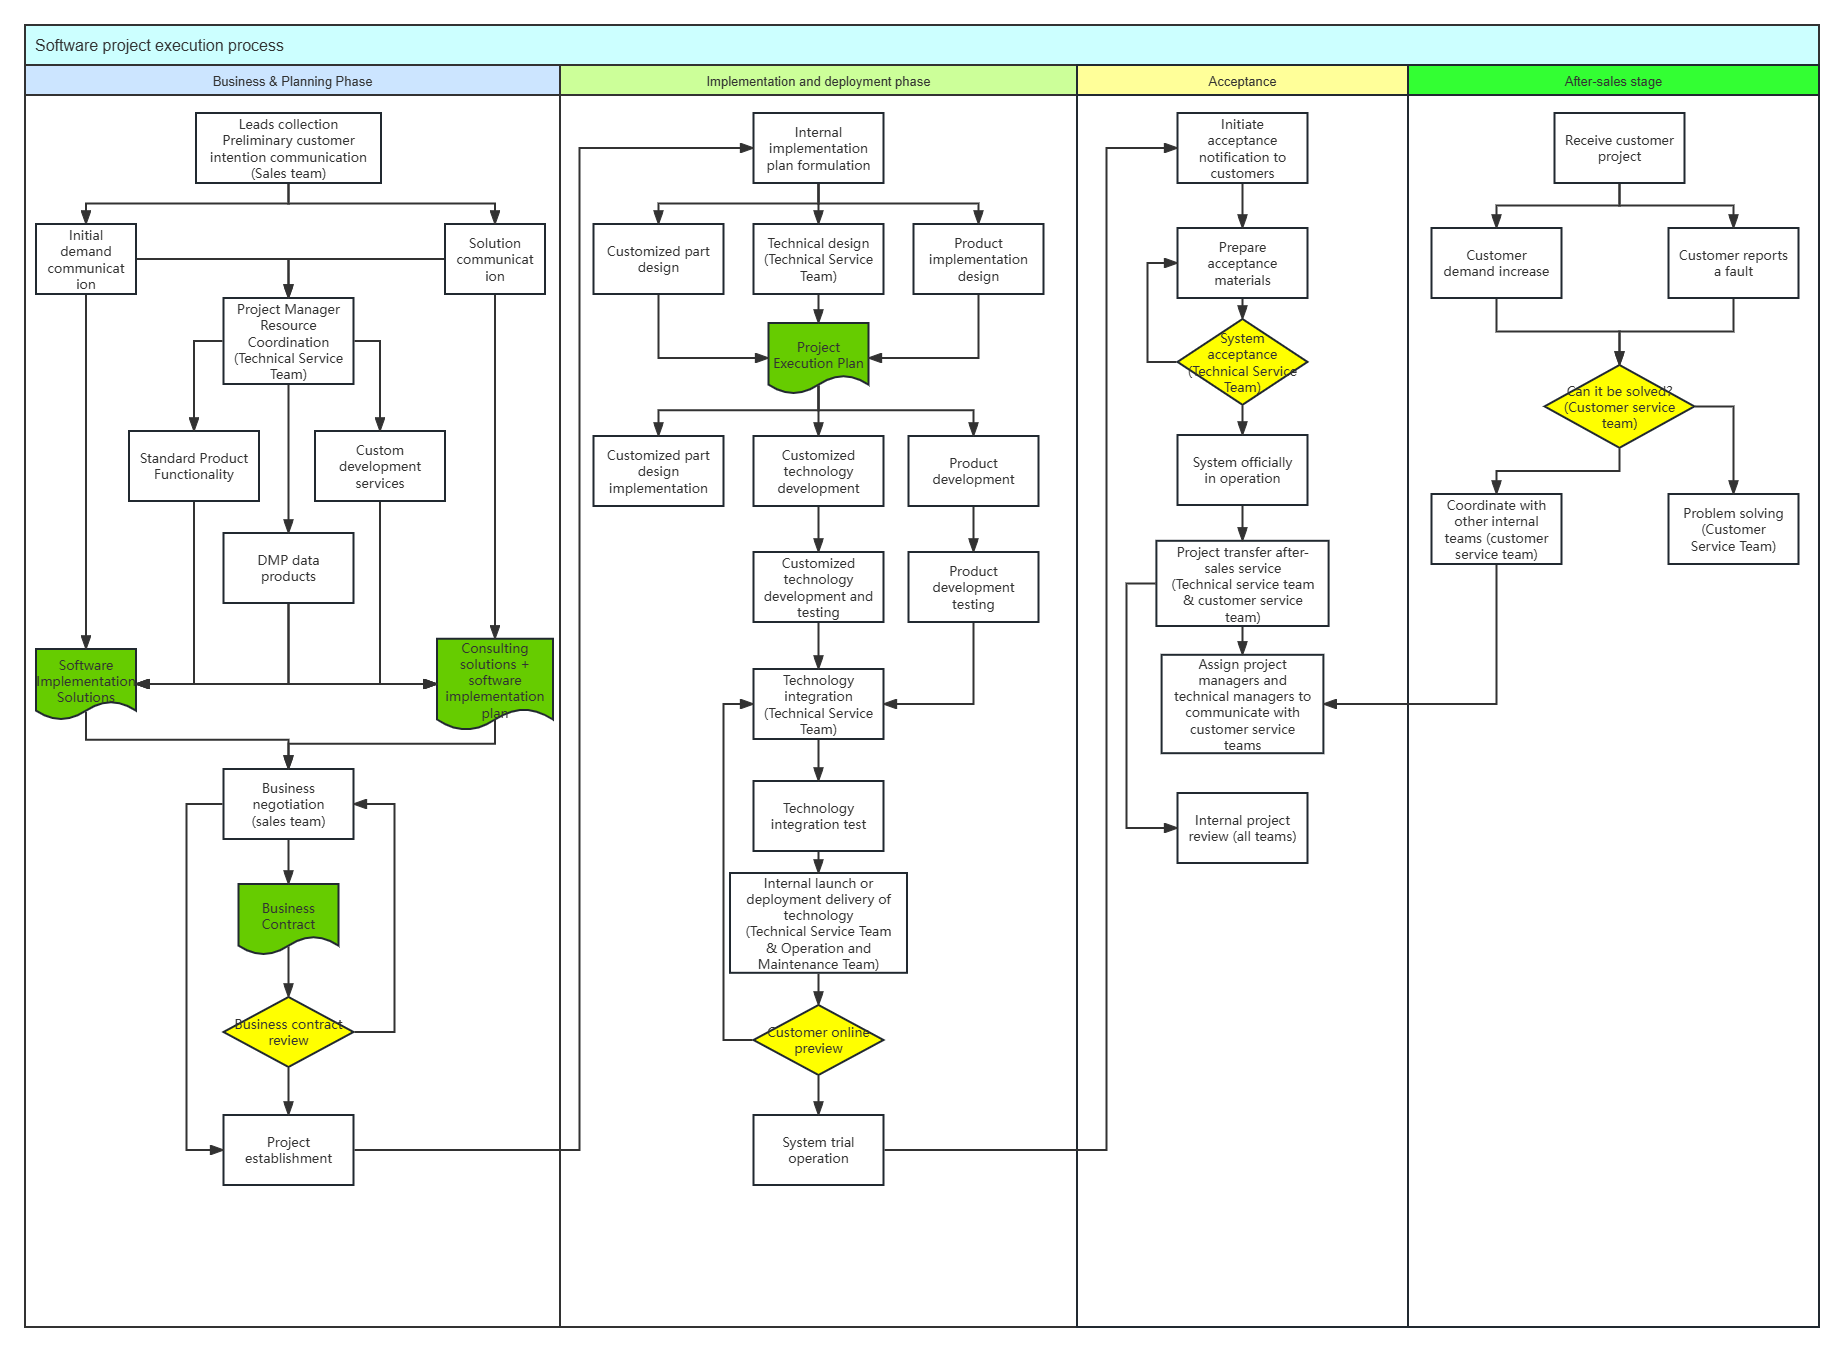
Software Project Process-Go to Edit
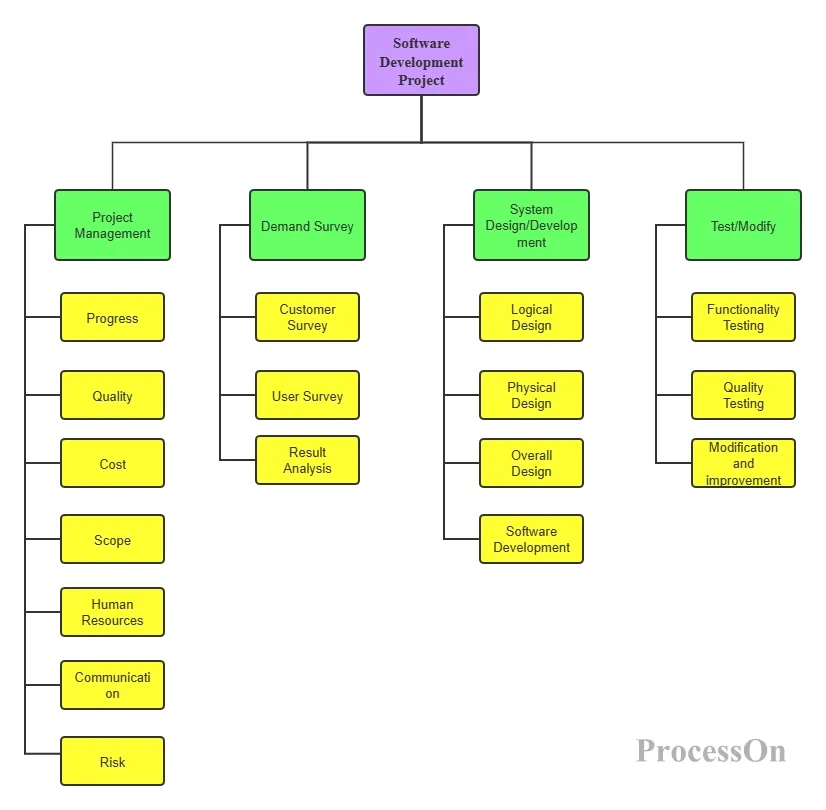
Software Development Project WBS Diagram - Go to Edit
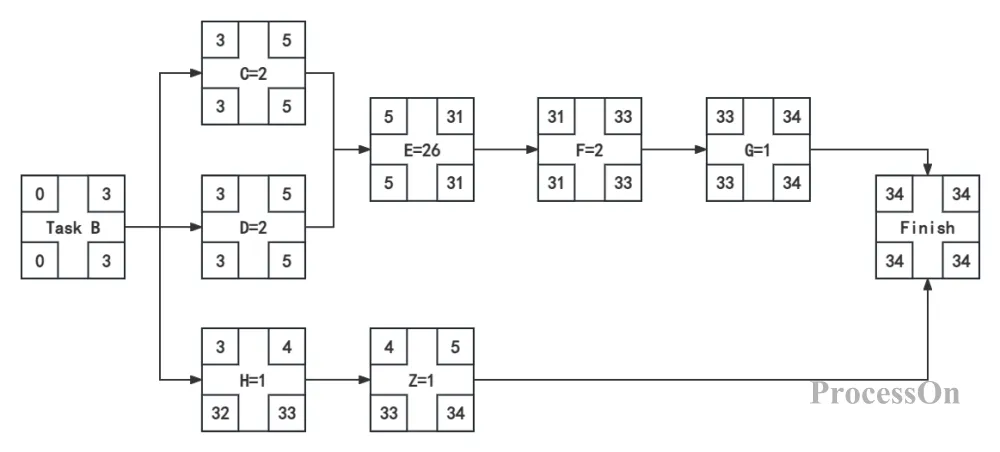
Critical Path Method Flowchart - Go to Edit
In summary, the project management flowchart is one of the indispensable tools for project managers. By mastering the drawing and application skills of the project management flowchart, project managers can manage projects more efficiently, optimize resource allocation, and improve team collaboration efficiency, thereby ensuring the smooth achievement of project goals.