

Functional decomposition diagram is an indispensable tool in project management, system design and business analysis. It not only helps to clearly display the components of a complex system, but also simplifies the analysis process by decomposing functions, improving efficiency and accuracy. This article will explore the meaning, basic composition, drawing tutorials, etc. of functional decomposition diagram , and share relevant examples of functional decomposition diagram.
A functional decomposition diagram is a graphical representation of a system or process broken down into its functions. It shows the connections and dependencies between the various functions, helping to understand the overall structure of the system and the functions of each part. This decomposition method helps manage complexity and reduce uncertainty by simplifying complex systems and breaking them down into independent parts for analysis.
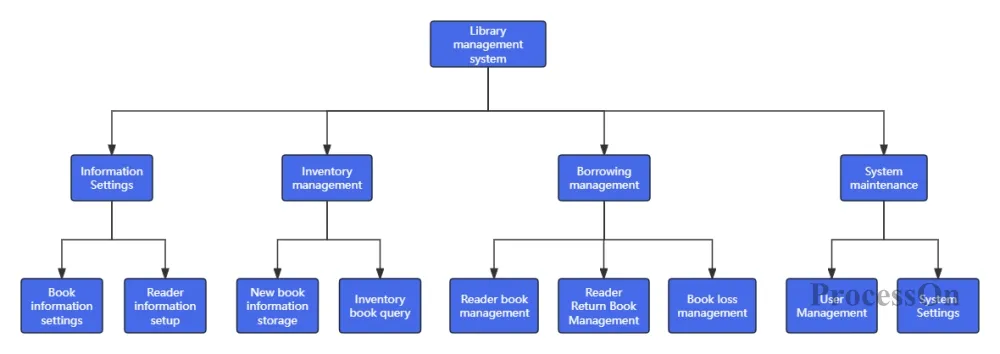
Functional decomposition diagram of library management system
A functional decomposition diagram usually consists of the following basic elements:
Functional module: represents each independent function or component in a system or process.
Connection lines: Display the connection and dependency relationships between functional modules.
Hierarchical structure: The degree of decomposition of functions is displayed through different levels, gradually refining from high to low.
Together, these elements form a clear, organized functional decomposition diagram that enables analysts and decision makers to intuitively understand the overall structure and function of the system.
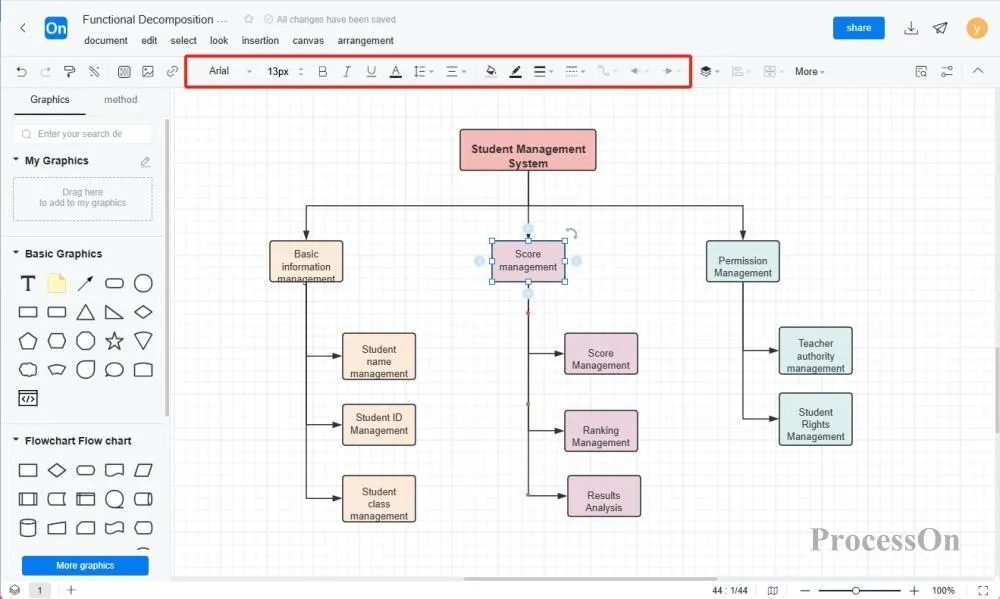
Taking a simple student management system as an example, the functional decomposition diagram can decompose it into the following functional modules:
Basic information management: including entry, modification and query of student information.
Grade and score management: including grade entry, calculation and statistical analysis.
Permission management: including the allocation of user roles, setting and modification of permissions.
Each functional module can be further broken down into more specific sub-modules. For example, basic information management can be subdivided into student name management, student number management, and class management .
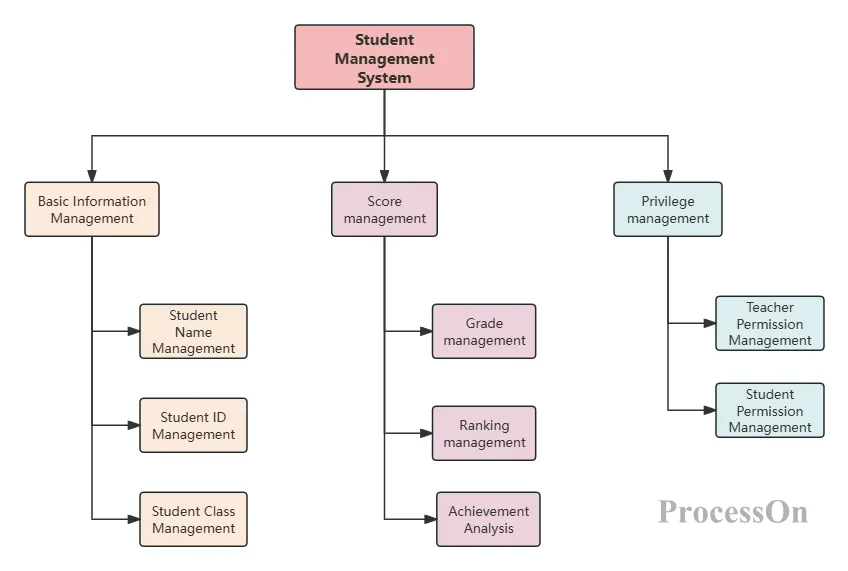
Student Management System Functional Decomposition Diagram
1. Clarify goals and scope
Determine the theme and purpose of the functional decomposition diagram to be drawn, whether it is to show the overall function of the system, analyze the structure of the system, or to assist in decision-making, etc. Think about which functions or system components need to be shown and the relationship between them.
2. Understand system functionality and structure
Analysis system functions:
First, define the functions of the system. Clarify what functions the system needs to achieve and how these functions are related to user needs or business goals. Then decompose the overall functions of the system into smaller and more specific sub-functions. At the same time, analyze the relationship between each function, including the dependencies, interactions and constraints between them.
Understanding the system structure:
Grasp the overall structure of the system, including the hierarchical relationship and interaction methods between various functional modules.
3. Determine the level and granularity of decomposition
Decomposition level:
Determine the number of levels of functional decomposition based on the complexity of the system and analysis requirements, usually starting from a high level and gradually decomposing down to more specific sub-functions.
Granularity selection:
Determine the granularity of each functional module, that is, how much detail each module should contain. Too much granularity may lead to insufficient information, while too little granularity may make the diagram too complicated.
4. Select graphics and symbols
Graphics Selection:
According to the requirements and style of the functional decomposition diagram, choose appropriate graphics to represent the functional modules.
For example, you can use rectangles to represent functional modules and arrows to represent connections between functions.
Symbol definition:
Define and consistently use symbols to represent specific functions or relationships to improve the readability of diagrams.
5. Drawing and Iteration
Preliminary drawing:
Based on the previous analysis, a preliminary functional decomposition diagram is drawn, including functional modules, connection lines and labels.
Iterative Optimization:
Review preliminary diagrams and charts to identify and correct any problems.
Iterate based on feedback to ensure that the diagram accurately reflects the functionality and structure of the system.
There are many tools for drawing functional decomposition diagrams, and it is very important to choose a tool that suits your needs. Common tools include Visio, Word, ProcessOn, etc. Users can choose a suitable functional decomposition diagram maker according to their needs. Here we mainly explain how to use ProcessOn to make a functional decomposition diagram.
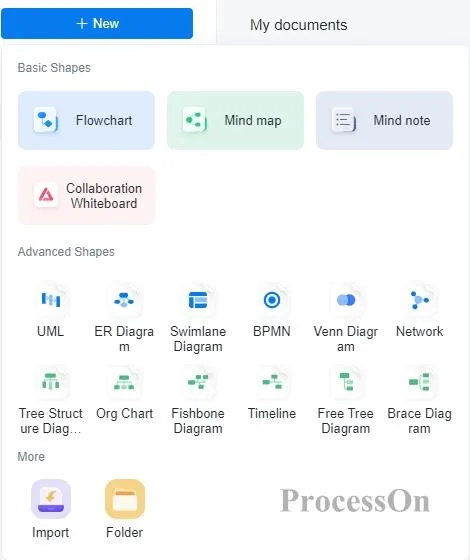
Open the ProcessOn official website, enter the personal file page, and click New to create a flowchart.
Drag the rectangular symbol in the graphics library on the left side of the maker to the canvas, double-click the graphic to add text, and click the "+" on the graphic to create lines between graphics.
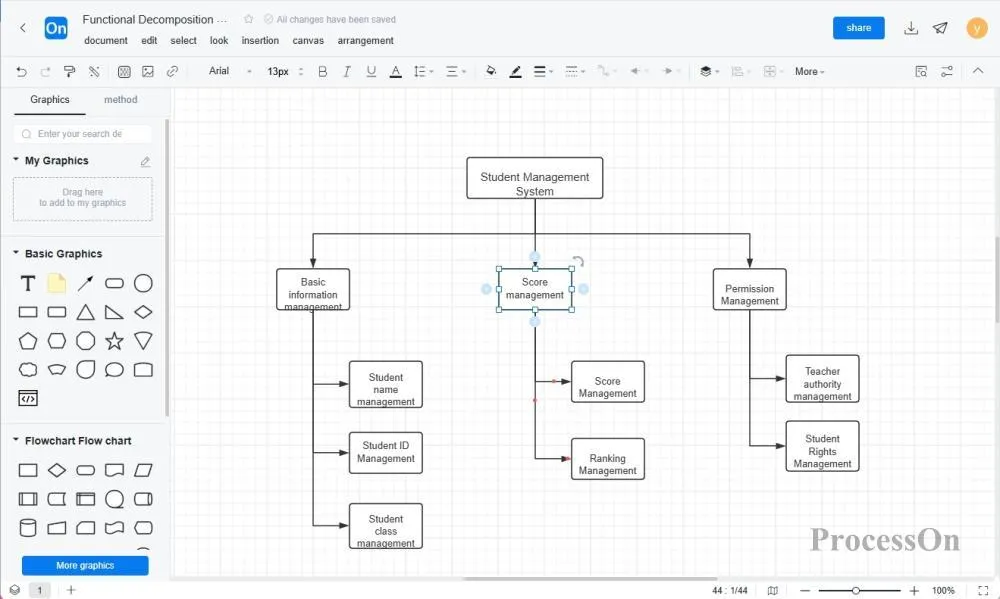
Select the graphic and use the top toolbar to set the text style and line style.
ProcessOn can be used for free, and the process of drawing functional decomposition diagrams is more convenient than Word. At the same time, ProcessOn also supports drawing flowcharts, UML diagrams, network topology diagrams, mind maps and other graphics, and supports team collaboration to jointly view and edit files.
Here are some functional decomposition diagram templates in ProcessOn.
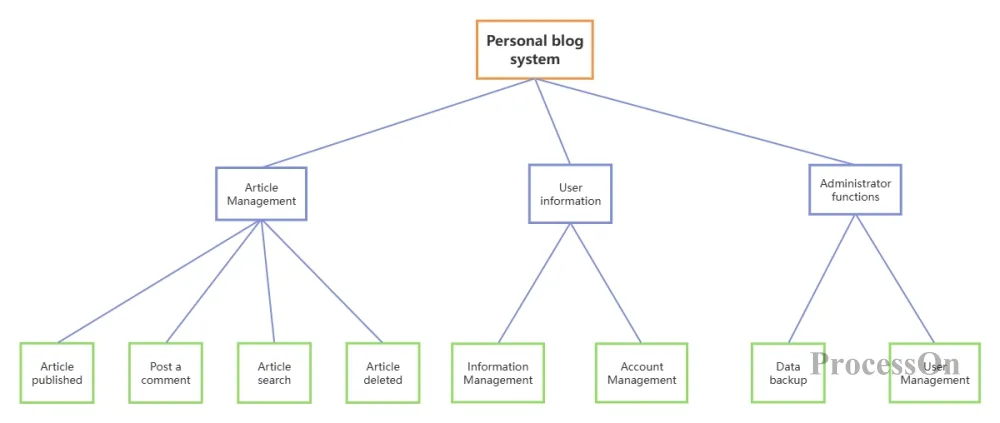
Functional decomposition diagram of personal blog system
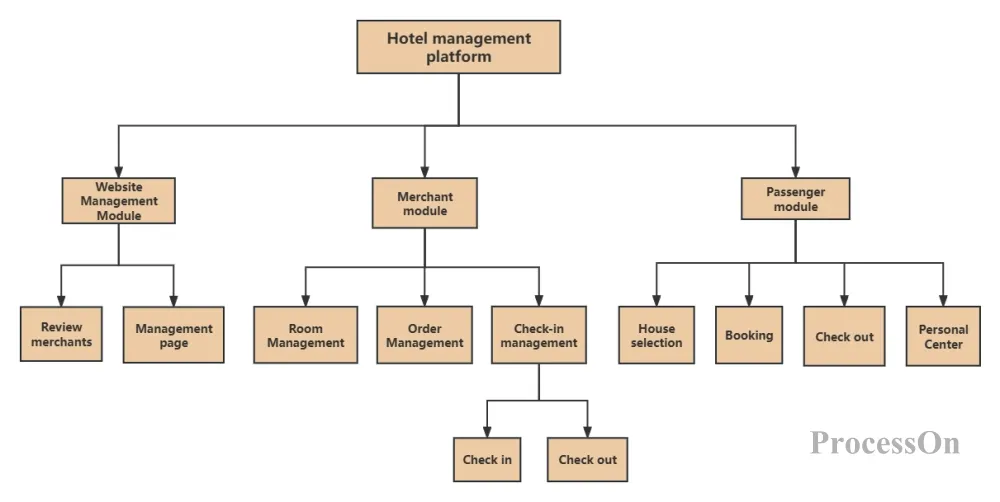
Hotel management platform functional decomposition diagram
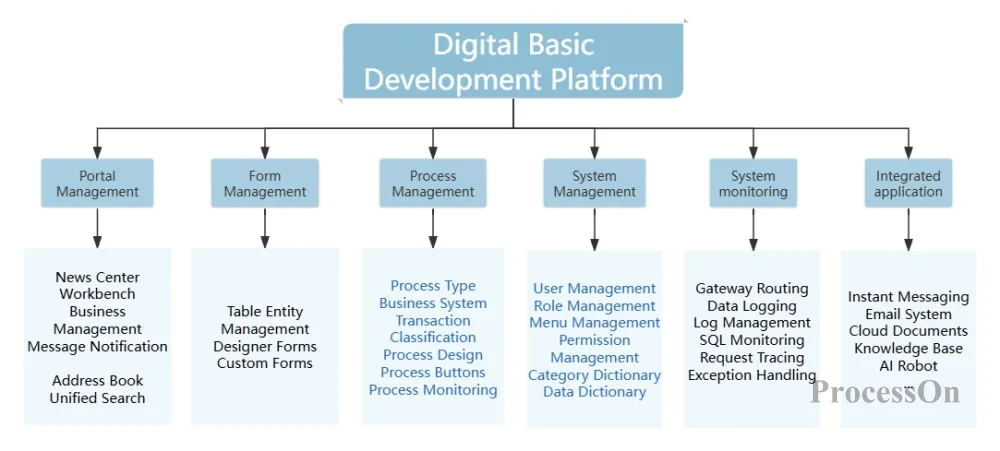
Digital platform system functional decomposition diagram
The above is the relevant content of the functional decomposition diagram. During the whole thinking process, you need to maintain a deep understanding and analysis of the system, while paying attention to the readability and accuracy of the diagram. Through continuous iteration and optimization, you can create a functional decomposition diagram that is both accurate and easy to understand, providing good support for the subsequent development of the system.