Free distribution
Parenthesis Diagram
In the process of software development , clear and efficient communication is the key to ensure the smooth progress of the project. As an intuitive way to express information, flowcharts can help developers better understand project processes, identify potential problems, and optimize development paths. This article will explore in depth what flowcharts are, how developers use them, and the specific methods of designing and creating programming flowcharts , and share multiple examples and templates.
A flowchart is a graphical representation method that uses a series of symbols (such as circles, rectangles, diamonds, etc.) and arrows connected in a specific order to show a series of steps or decision-making processes. It can not only clearly depict the entire process from the starting point to the end point, but also highlight the branches, loops and conditional judgments in the process. It is an indispensable tool in project management, system design and problem solving.
For developers, flowcharts are not only an auxiliary tool for project planning, but also an important bridge for team collaboration and communication. Using flowcharts, developers can:
When developing software , complex algorithm logic can be intuitively presented in the form of a flowchart , allowing developers to quickly grasp the core steps and decision-making processes of the algorithm. At the same time, as the algorithm requirements change or are optimized, the flowchart can be easily expanded and modified to adapt to the new algorithm logic.
Example: Suppose you want to design a clustering algorithm, then use a programming language to convert the algorithm idea into executable code, test the algorithm performance on a simulated data set, and make necessary adjustments and optimizations based on the test results. Then encapsulate the designed clustering algorithm into an easy-to-use and reusable software component or function.
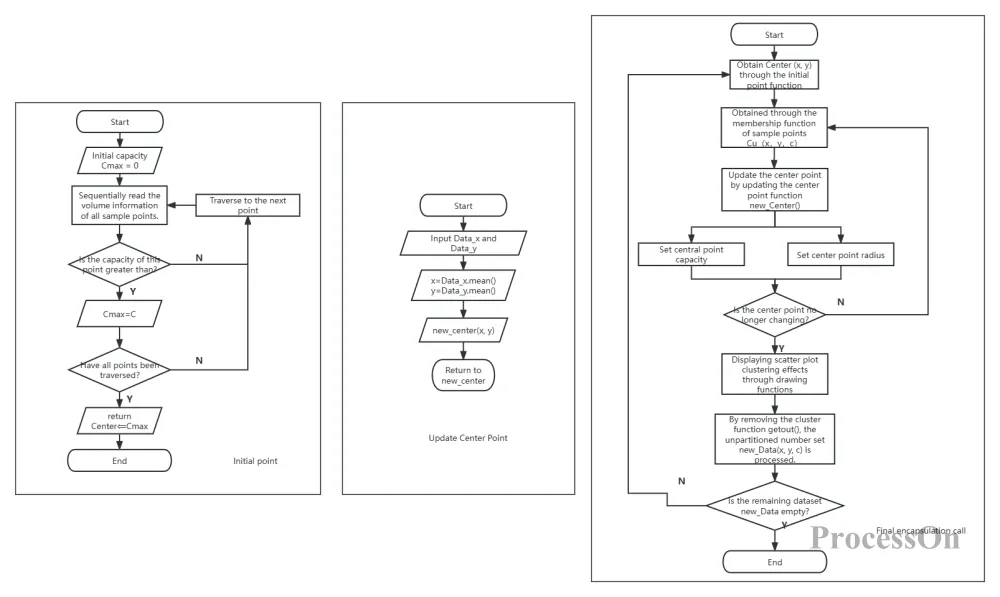
Clustering algorithm flow chart-Go to Edit
During the process design phase, developers can use flowcharts to perform simulations to identify possible logical errors, resource bottlenecks, or performance issues in advance.
Example: When developing the payment module of the online shopping system mentioned above, we may encounter a situation where the user fails to enter the password when paying . At this time, we can add a decision diamond in the flow chart to determine whether the password verification is successful. If the verification fails, the error handling process is entered to record the error information and notify the user. In this way, we can consider various abnormal situations in the design stage and formulate corresponding handling strategies to reduce the cost of later modifications.
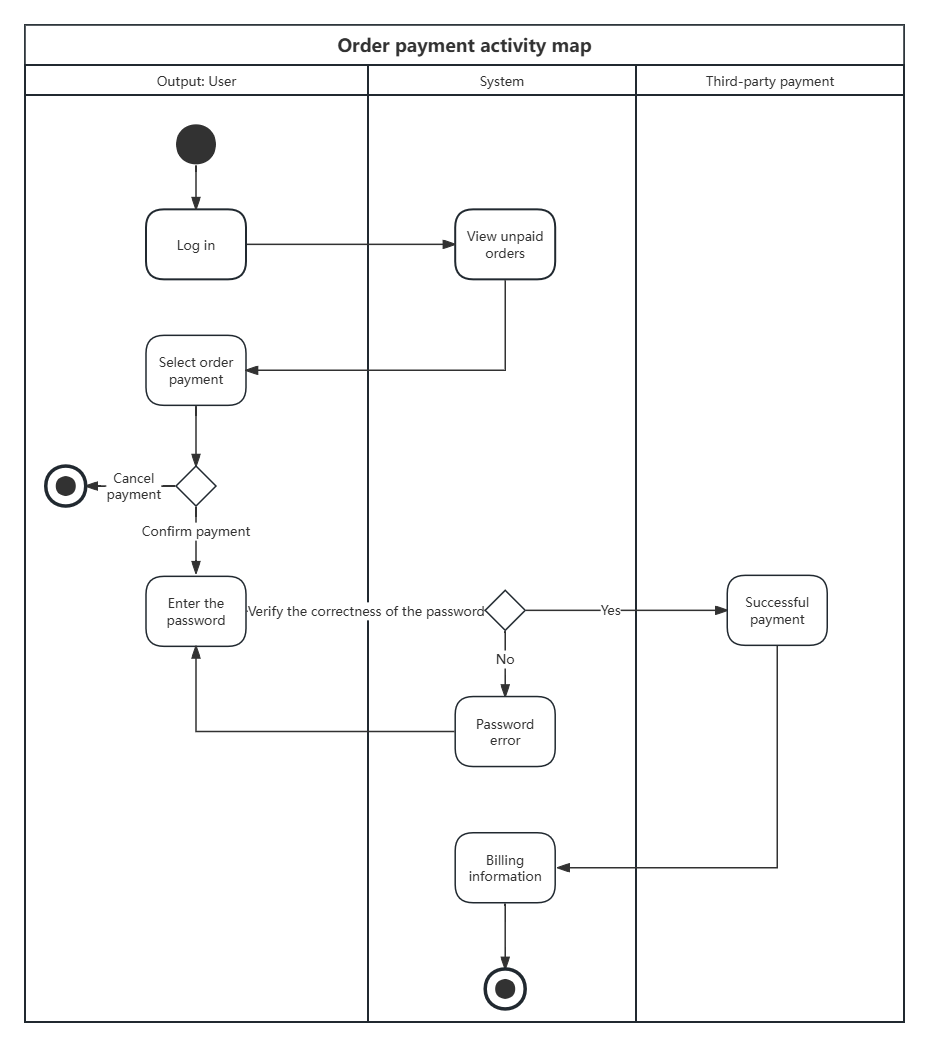
UML Activity Diagram - Order Payment-Go to Edit
Based on flowchart feedback, developers can adjust the process order, merge repeated steps, or introduce parallel processing to improve development efficiency and quality.
Example: When developing a payment module for an online shopping system, when a user refuses to accept a product, there are two processes: refund and verification. We can consider splitting the data processing steps into multiple subtasks to form a parallel processing branch.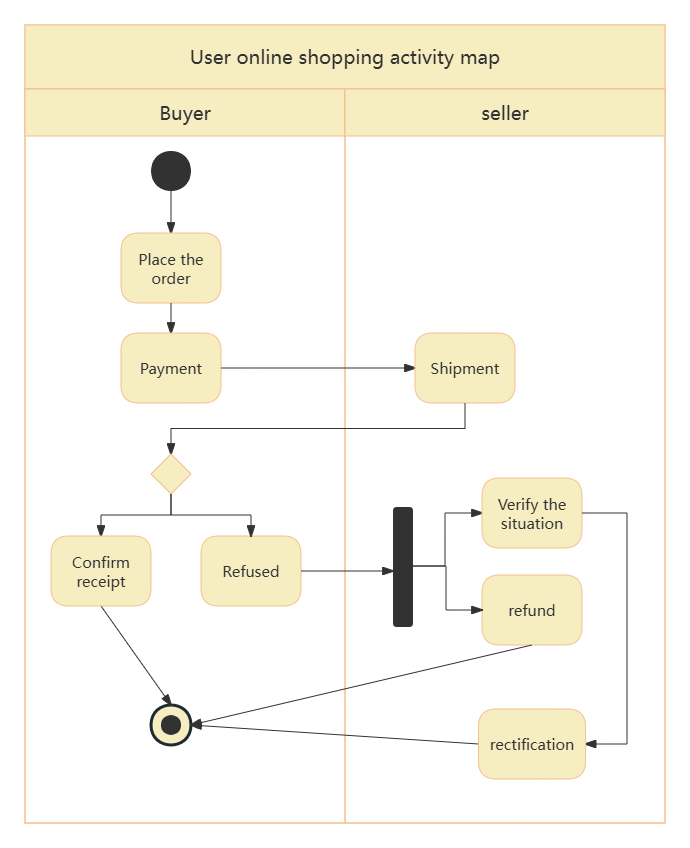
User online shopping activity chart-Go to Edit
As an intuitive way to express information, flowcharts can serve as a common language among team members, reducing misunderstandings and communication barriers.
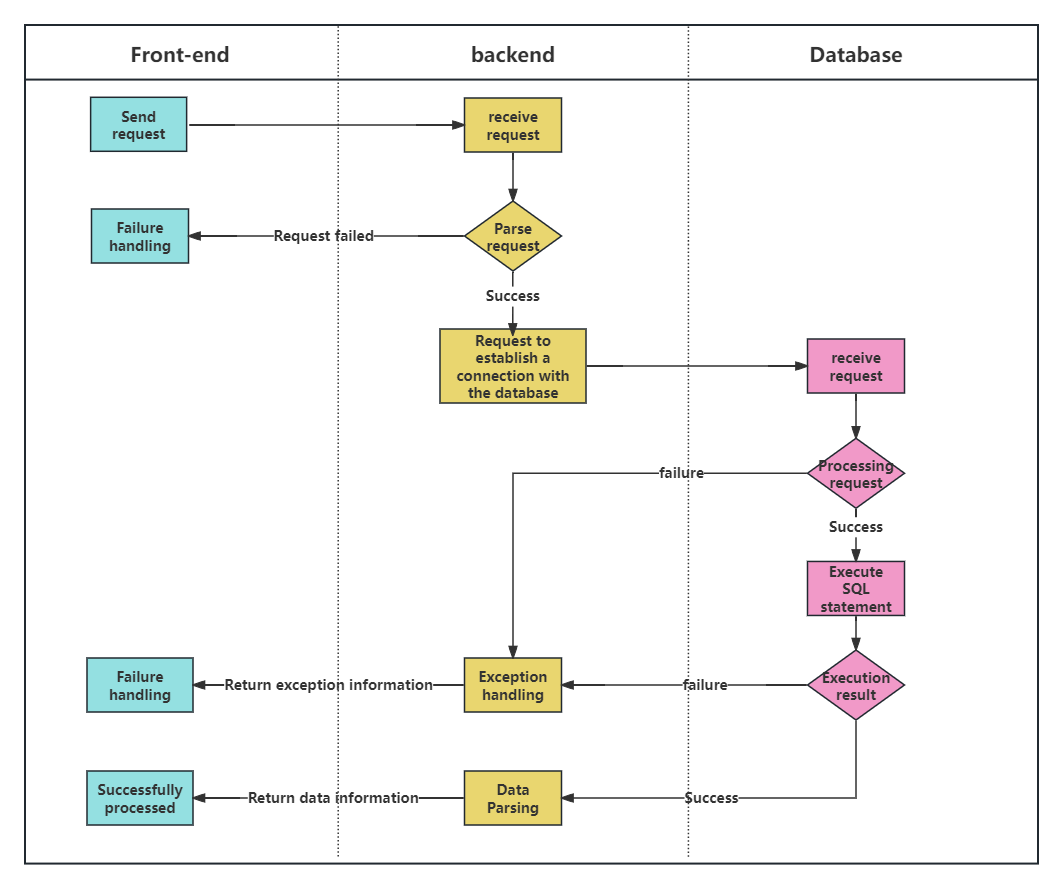
Example: Take a newly launched Internet project as an example. At the beginning of the project, the biggest challenge faced by the team was how to ensure seamless connection between the front-end user interface and the back-end data processing, while maintaining design consistency and smooth user experience. In order to solve this problem, the project team drew a detailed front-end and back-end separation product development flow chart. This flow chart clearly defines every key link from demand analysis to design, development, testing, deployment and operation and maintenance. In this way, team members can more clearly understand each other's work content and dependencies, so as to work together more efficiently.
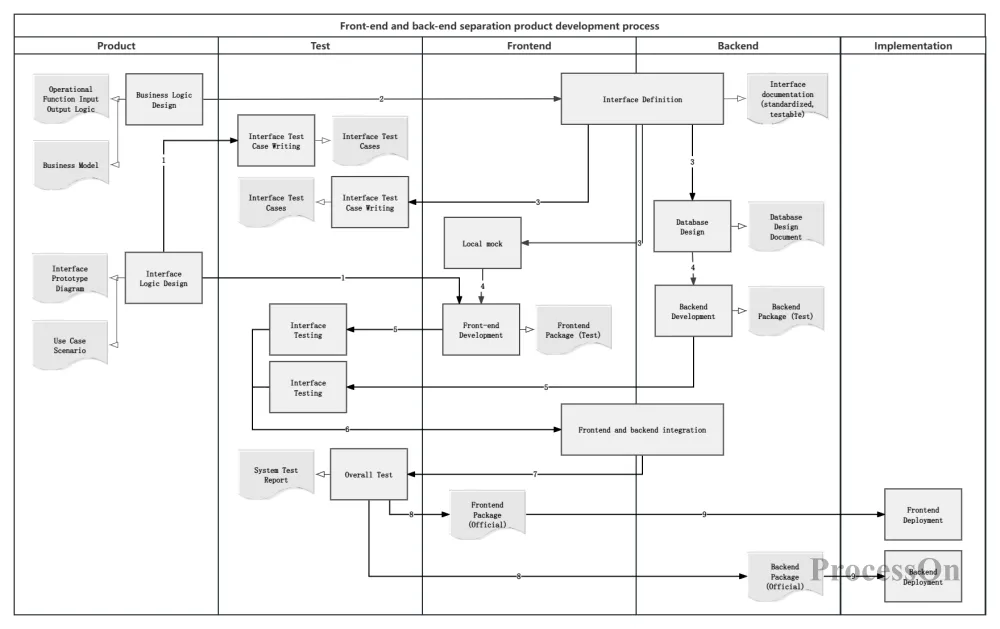
Front-end and back-end separation product development process-Go to Edit
designing a programming flowchart , the following steps should be followed to ensure its effectiveness and practicality:
Clarify the goal: Identify the problem the flowchart is designed to solve or the goal it is intended to achieve.
Identify key steps: List all the key steps and decision points required to achieve your goal.
Choose symbols: Choose appropriate flowchart symbols based on the step type (such as start/end, process, decision, input-output, etc.) .
Define the process logic: connect the steps in sequence, use arrows to indicate the direction of the process, and ensure that the logic is clear and there are no omissions.
Add comments: Add necessary text descriptions for complex steps or decision points to enhance readability.
Review and Revision: The team reviews the flowchart internally to ensure it is correct and makes necessary adjustments based on feedback.
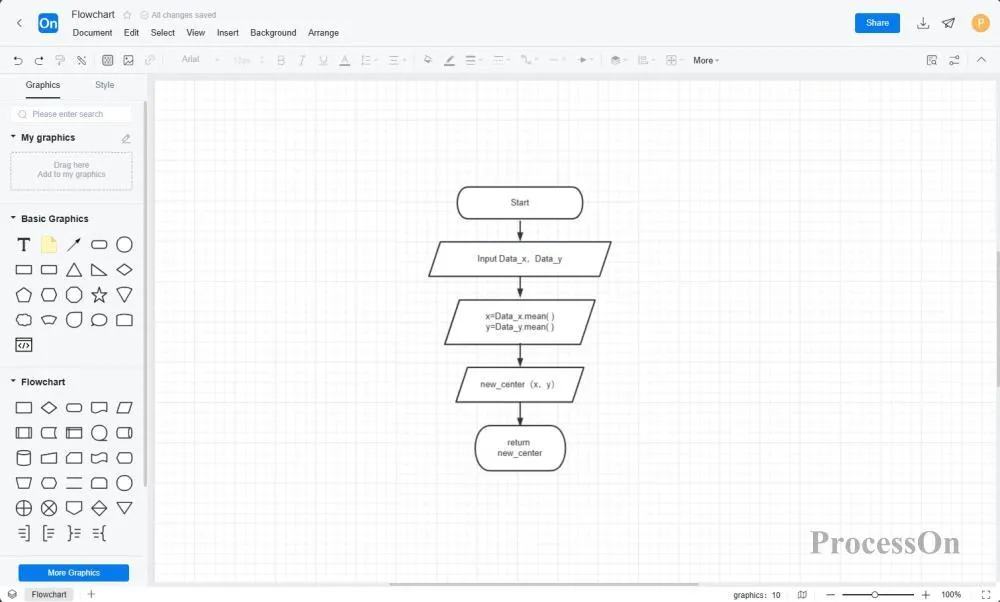
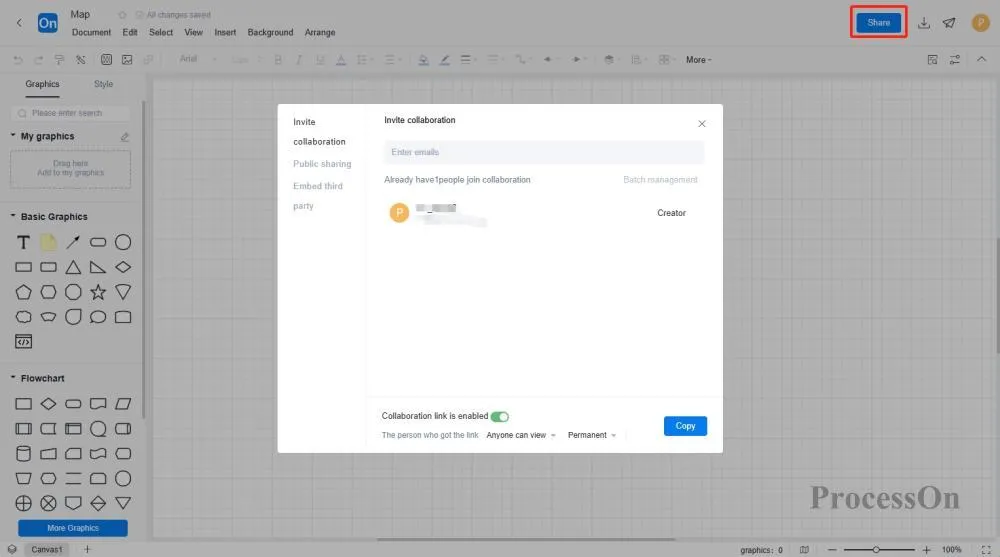
Making a flowchart , you can choose to draw it manually or use professional flowchart software, such as Visio, Draw.io , ProcessOn , etc. ProcessOn is an online flowchart tool that supports free creation of flowcharts, mind maps, UML, network diagrams, etc. The following is a flowchart drawing method using ProcessOn as an example:
1. Go to the file page, create a new flowchart, or search for keywords in the template community to create a flowchart.
2. Drag the flowchart symbol in the graphic library on the left to the canvas, click the "+" on the graphic to create lines to connect different processes, select the graphic symbol, and the top toolbar supports adjusting the color, font and layout .
3. Export the flowchart in a suitable format (such as PDF, PNG) as needed, and insert it into corporate documents to share with team members. You can also directly share the flowchart with colleagues or customers for team members to view or edit online.
The ProcessOn template community contains flowchart templates for developers at various stages of coding , which support cloning and improve drawing efficiency. The following are some programming flowchart templates.
Interface interaction flow chart-Go to Edit
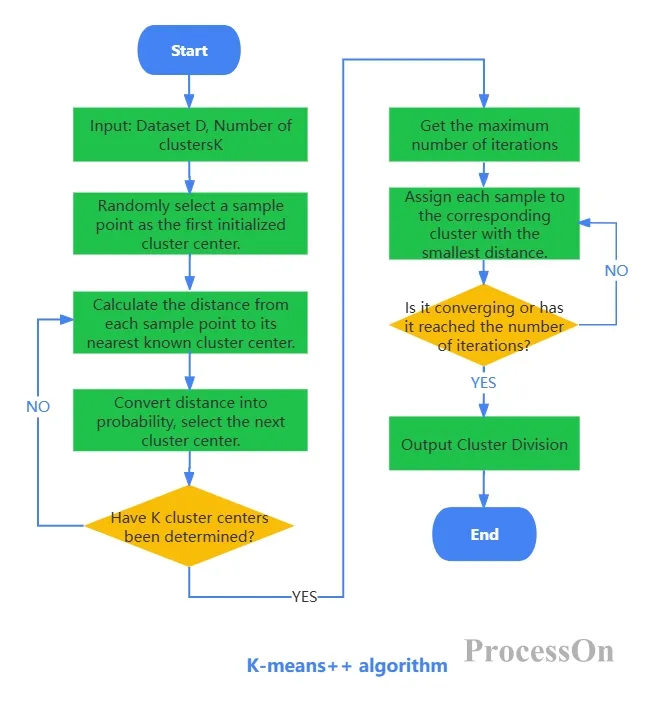
Clustering K-means++ algorithm process-Go to Edit
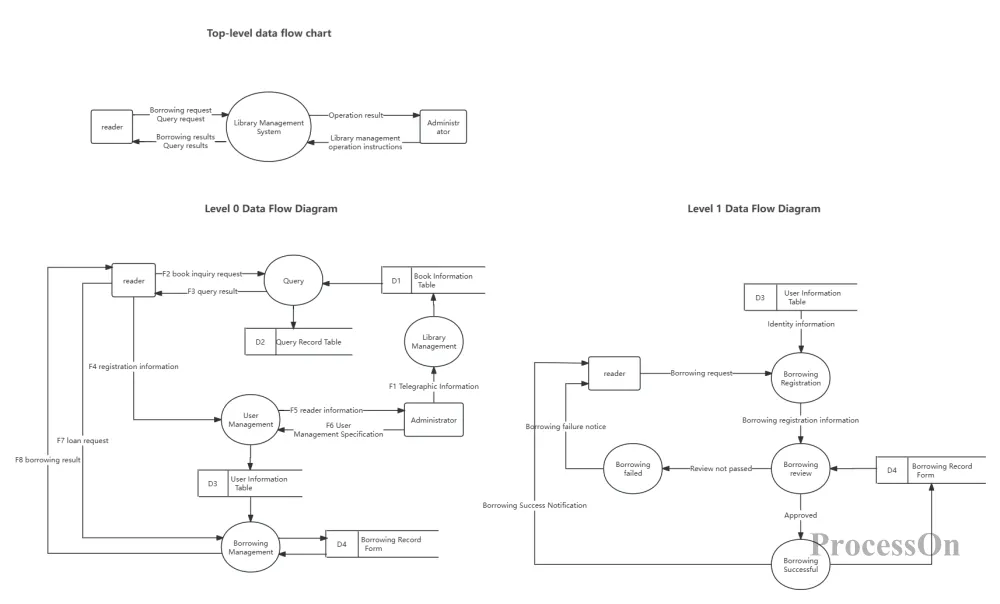
Library management system data flow diagram-Go to Edit
In short, flowcharts are an indispensable tool in the software development process. They can not only improve development efficiency, but also promote effective communication between teams. Mastering the method of designing programming flowcharts is an indispensable skill for every developer who is committed to creating high-quality software.