System context diagram is an important tool in system analysis and design, which is used to understand and display the interaction between the system and its external environment. This article will comprehensively introduce the context diagram from six aspects, including concepts, application scenarios, and drawing tutorials, to help readers master this practical skill.
The system context diagram is a diagram that treats the system's internal structure as a "black box" and focuses on showing the interaction between the system and external entities. It connects all the external interaction capabilities that the system is directly connected to with the system's abstract "black box", thus forming a relatively complete process. This diagram shows the boundaries of the system and its interface with the external environment in a simple and clear way, and is an indispensable tool in the preliminary stage of system analysis and design.
system context diagram contains three key elements.
Product : The project, system, or entity that needs to be defined. It is represented by a circle that contains everything within its scope of control (i.e., job roles and responsibilities, processes). Circle diagrams are almost standard for presenting a subject as part of a whole.
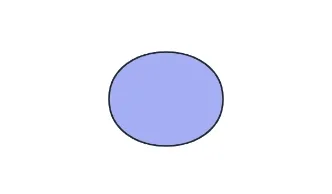
External entities or agents : People, systems, and organizations that operate outside the product but interact with it in some way (i.e., decision makers, suppliers, customers). These are represented by squares or rectangles.

Flow lines : Represented by arrows, depicting the flow of data between agents or the specific way an external entity interacts with the product. Arrows are often accompanied by text to show the specific type of data being exchanged or the action being performed.

Software system design: In the early stages of software development, context diagrams help the development team clarify the scope and boundaries of the system and its interactions with external systems, laying the foundation for subsequent detailed design and development.
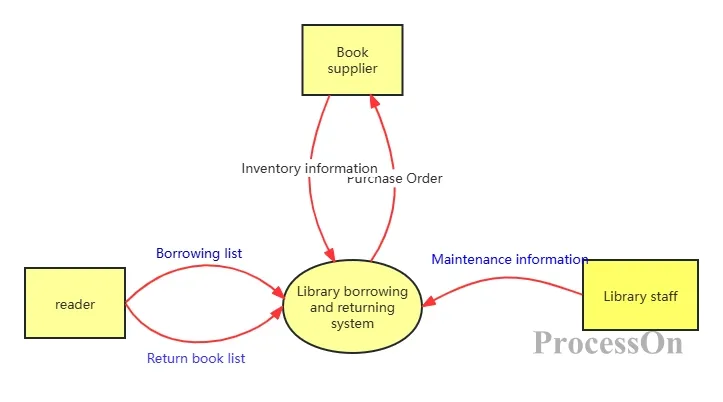
Library loan system context diagram
Business process review: During the upcoming discovery phase of a project, a context map can outline the relationships of business systems with other systems, ensuring that systems and processes are aligned with business requirements.
Resource management: Teams can use contextual diagrams to better understand how their budgets should be spent and see what resources are needed in different areas of the business.
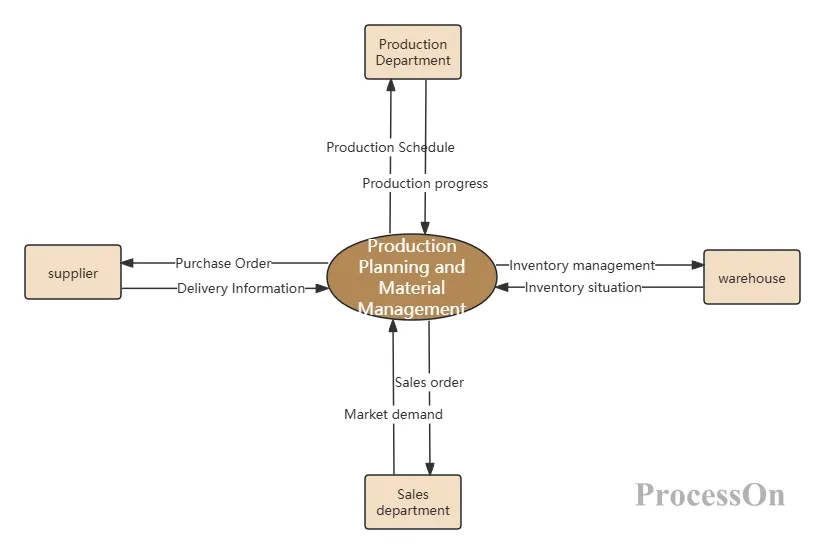
Production Planning and Material Management System Context Diagram
Problem structured analysis: During the requirements analysis phase, context diagrams are often used to perform structured analysis of the problem to determine the location and boundaries of the problem, as well as the connection between the machine domain and the problem domain.
System Context Diagram: Provides an overview of the system and is the highest level representation in a data flow diagram. It focuses on the interaction of external entities with the system and contains only one process or program that represents the entire system. It is sometimes called a level 0 data flow diagram.
Data Flow Diagram: A graphical representation of the data "flow" of an information system that details the flow, processing, and storage of data in the system. It can be used to visualize the structured design of data processing and contains multiple levels of detail.
System context diagram: contains only one process (named after the system), showing all external entities and major data flows, without any data storage. It provides a high-level view to facilitate understanding the interaction between the system and external entities.
Data flow diagram: contains multiple processes, data stores, and external entities, as well as detailed data flows between them. It provides deeper details and describes the data processing logic within the system.
System Context Diagram: Mainly used to plan how the system interacts with external entities, reduce risks, and facilitate communication with external stakeholders. Due to its simplicity and ease of understanding, it is very suitable for use in the early stages of a project.
Data flow diagram: Provides more detailed information for in-depth analysis of the system's data processing process. It helps teams visualize the four main components of a system (entities, processes, data stores, and data flows) to optimize system design and performance.
If you want to know more about data flow diagrams, you can go to What is DFD (Data Flow Diagram)? Symbols, Structure, Tutorials, Examples articles.
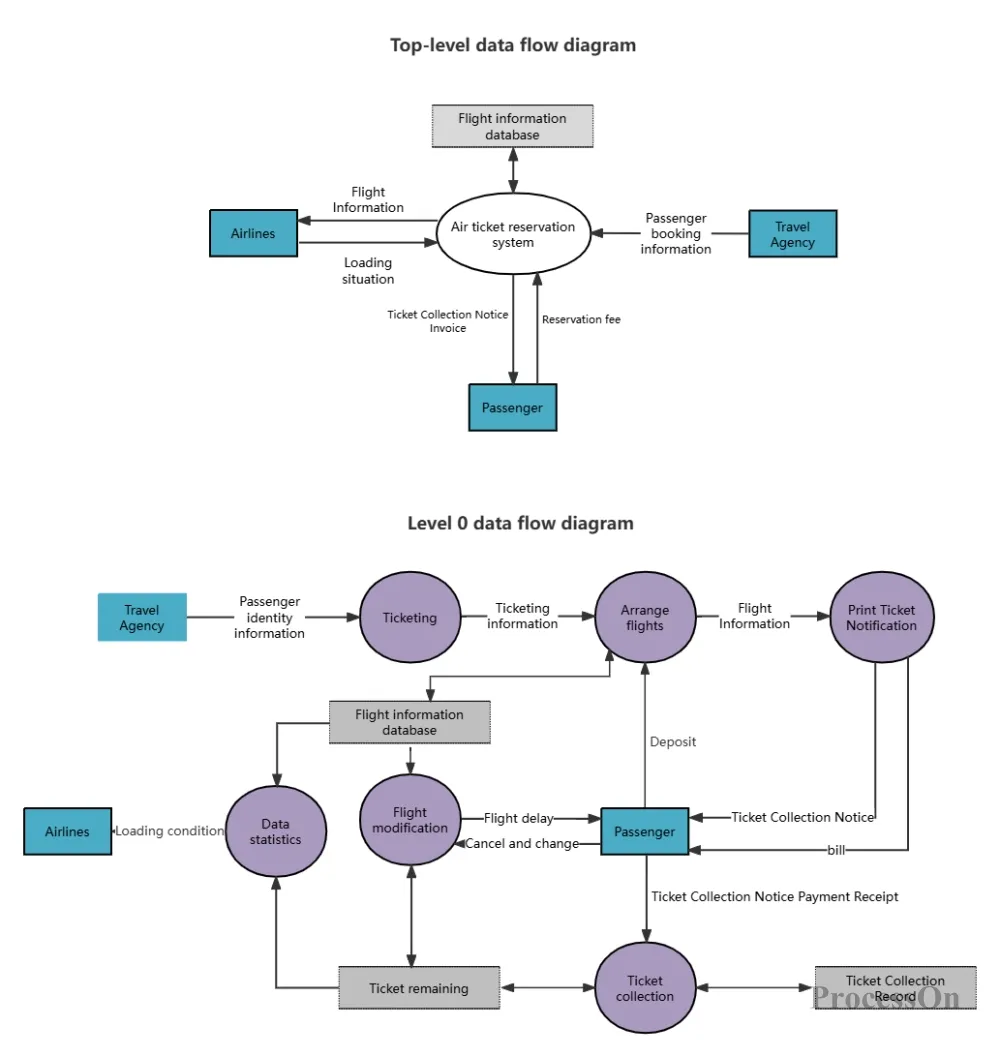
Airline booking system data flow diagram
drawing a system context diagram is relatively simple, but the key is to accurately define the boundaries of the system and external interacting entities. Here are the detailed drawing steps :
Determine the system boundaries: First, clarify the scope and function of the system and define the boundaries of the system. This is usually the core function or main business process of the system.
Identify external entities: List all external entities that interact with the system, such as users, other systems, databases, etc. These entities are usually represented in the diagram as nouns rather than behaviors.
Draw a system block diagram: In the center of the paper, draw a block diagram (usually a rectangle or circle) that represents the system. This is the focal point of the diagram.
Add external entities: Add block diagrams representing external entities around the system block diagram, and use lines (usually arrows) to connect the system and external entities to indicate the interaction between them.
Label interaction information: Label the interactive information type or process on the arrow line to clarify the data flow or control flow between the system and external entities.
There are many tools for drawing context diagrams, and it is very important to choose a tool that suits your needs. Common tools include Visio, Word, ProcessOn, etc. Users can choose the appropriate context diagram maker according to their needs. For beginners, ProcessOn is recommended , which provides rich templates and an easy-to-use interface. Here we mainly explain how to use ProcessOn to make a tree diagram.
1. Log in to ProcessOn , go to the Personal Files page, and select Create New Flowchart.
2. Drag a circle from the graphics library on the left to the canvas as the central entity, then drag a rectangle as the outer entity, select the entity element, and click the "+" around the graphic to add lines to link other entity elements.
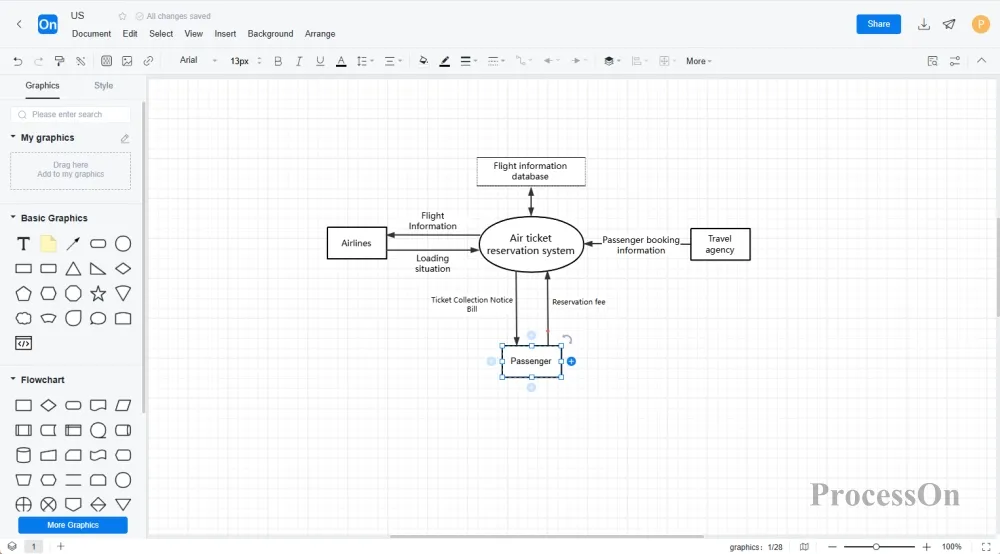
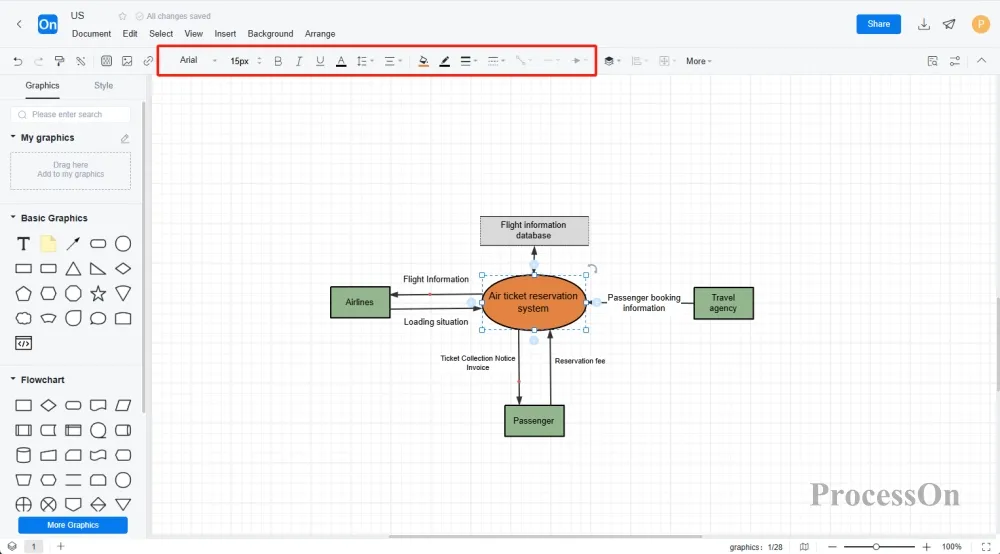
3. Select the graph and use the top toolbar to adjust the color, size and other styles of the graph, text and lines as needed to enhance the readability and aesthetics of the chart.
The following are some system context diagram templates and examples shared in the ProcessOn template community.
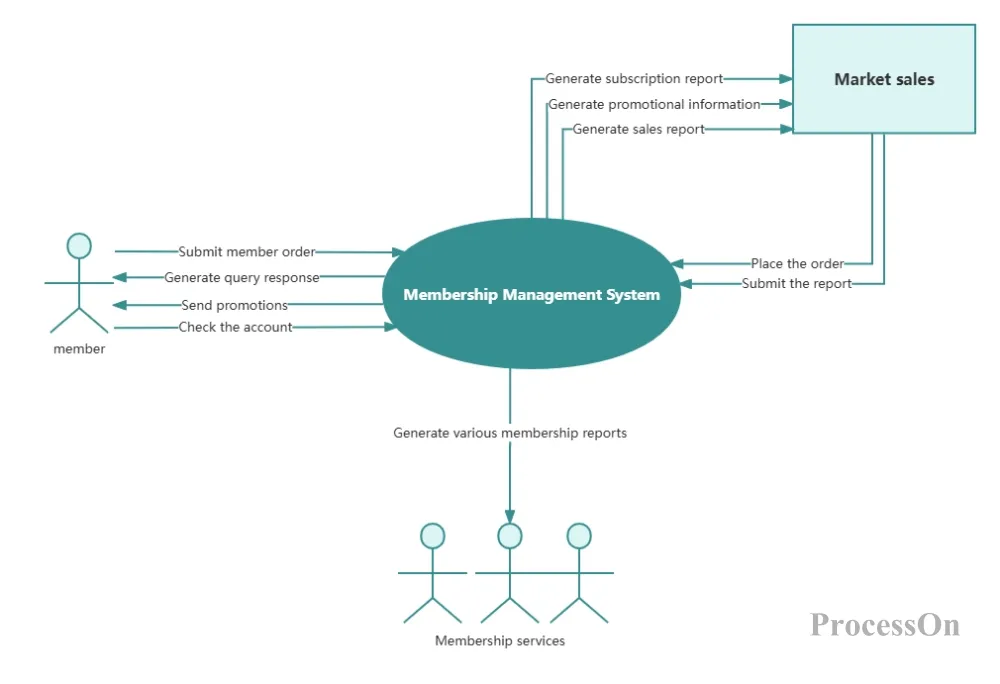
Member Management System Context Diagram
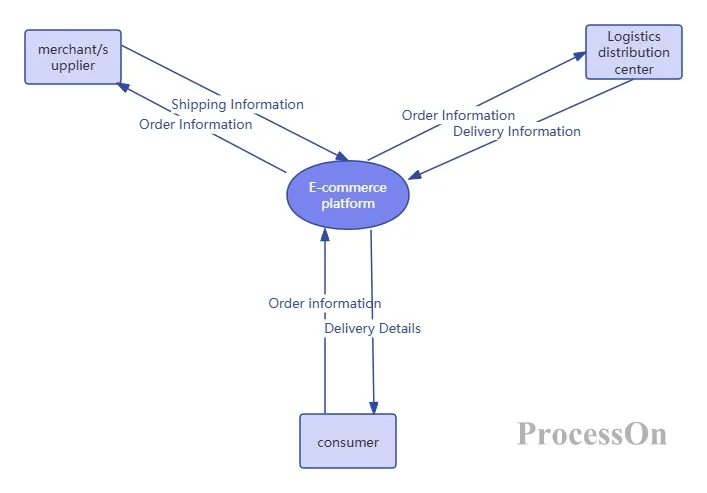
E-commerce platform context diagram
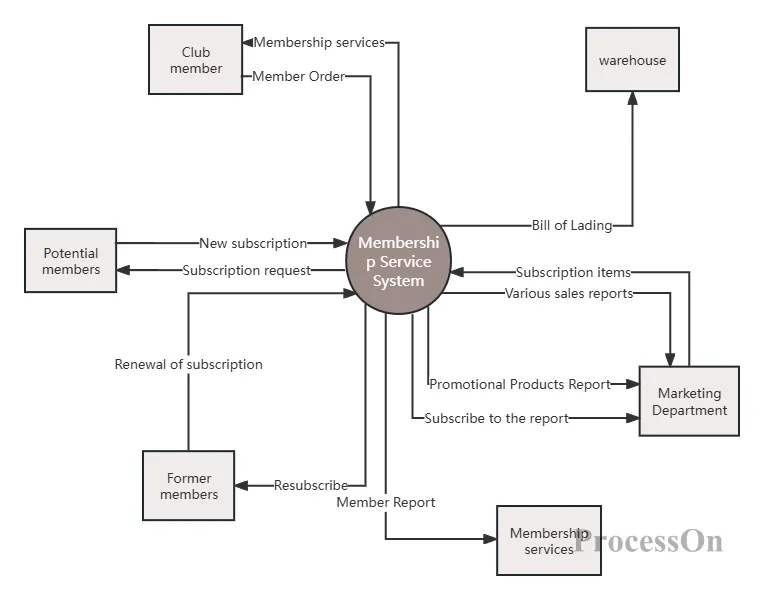
Member service system context diagram
As a visualization tool in the early stages of a project, context diagrams help determine the boundaries of a system and its interactions with external entities, providing an important reference for subsequent system design and development . I believe that by understanding the drawing methods and cases , you can better understand and apply this tool.