Free distribution
Parenthesis Diagram
In product design and optimization, user flow diagrams graphically display the interaction logic between users and products. As a product operator, mastering the drawing and application of user flow diagrams is the key to improving user experience and optimizing product paths. This article will take you to an in-depth understanding of the basic concepts and practical skills of user flow diagrams , hoping to help you better design the user experience process of your product .
A user flow diagram is a visual representation of a series of steps that a user goes through from the starting point to the end point when using a product or service. It focuses on the user's perspective and graphically displays the interaction logic between the user and the product, helping the team understand user behavior, identify pain points, and optimize the experience.
Understanding user behavior: Through flowcharts, teams can clearly see how users interact with the product and discover natural flows and potential obstacles in the user path.
Optimize user experience: Identify and eliminate friction points in the user journey to increase user satisfaction and loyalty.
Promote team collaboration: As a communication tool, it helps UX designers , developers, product managers and other roles share their understanding of user behavior and promote cross-functional cooperation.
Assist decision making: Flowchart-based analysis provides data support for product iteration and function optimization.
1. Clarify goals and user needs
To sort out the user experience process within the product, we must first determine the core business goals of the product, such as improving user activity, increasing sales, and improving user retention. Through user interviews, questionnaires, behavioral data analysis, etc., we can deeply understand the characteristics, needs, pain points and expectations of users in each channel , form user portraits, and clarify the main usage scenarios and business processes of users in different channels.
2. Streamlining existing business processes
Classify user source channels, such as social media, search engines, direct visits, partner recommendations, etc. For each channel, draw a complete flow chart from the user entering the product to completing key business actions (such as registration, purchase, sharing, etc.).
Use flowchart tools (such as Visio, ProcessOn , etc.) to visualize the process for easy analysis and optimization. Identify key nodes in the process, such as user decision points, conversion bottlenecks, and high churn rate links.
3. Analyze problems and opportunities in the process
For each channel’s user flow, analyze the pain points that users may encounter, such as complex operations, unclear information, slow loading speed, etc. , and look for opportunities to optimize the process, such as simplifying steps, providing personalized recommendations, and enhancing user guidance. Use user behavior data, conversion rate data, A/B test results, etc. to quantify the problems and opportunities in the analysis process.
4. Optimize business processes
Remove unnecessary steps, merge related operations, reduce user cognitive burden , optimize interface design, provide clear navigation and feedback, and enhance the fluency of user operations. Provide personalized content and recommendations based on user portraits and behavior data to improve user satisfaction . Ensure that user flows across different channels remain consistent and coherent at key points to improve user cross-channel experience.
5. Verification and iteration
Invite target users to conduct process testing, collect feedback, and verify the optimization effect. At the same time, monitor key business indicators (such as conversion rate, retention rate, user satisfaction, etc.) to evaluate the impact of process optimization. Based on user feedback and data analysis results, continuously iterate and optimize business processes to form a closed loop.
Example: User purchase process of an online shopping platform.
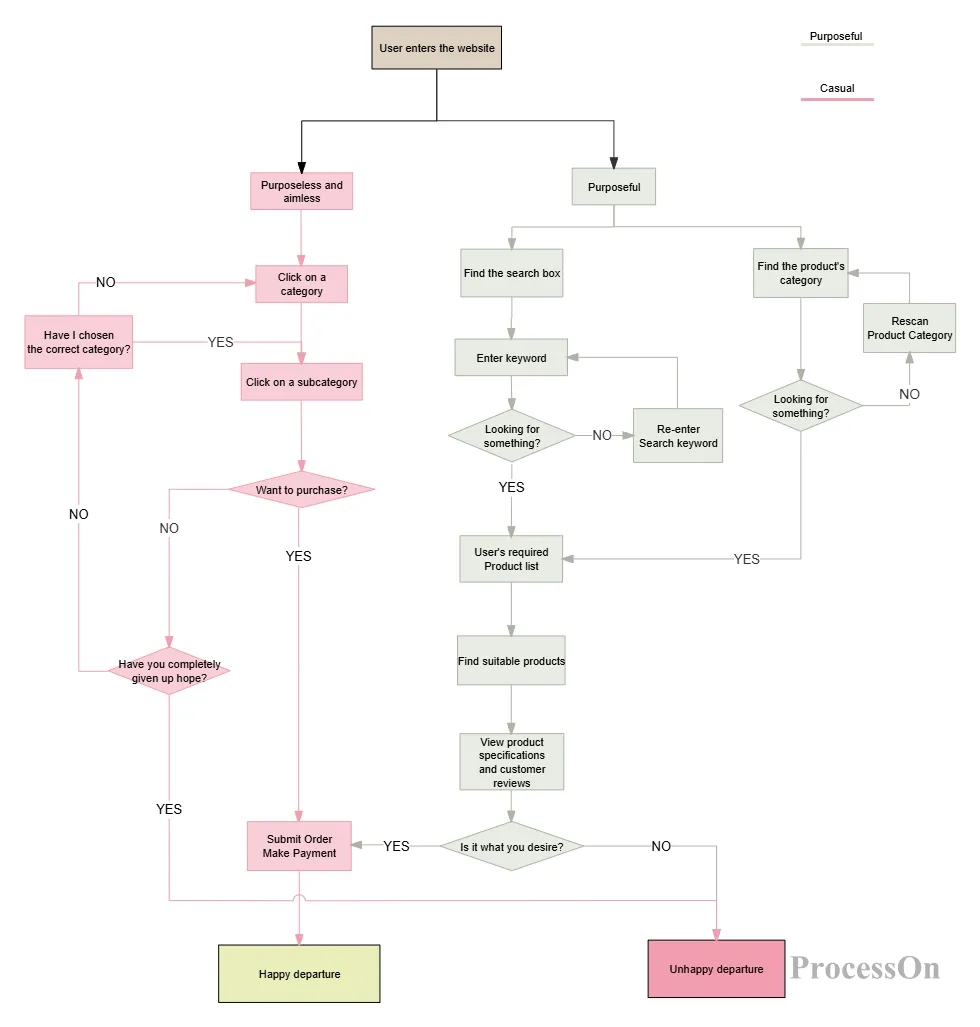
Online shopping platform user purchase flow chart
Through this example, we can clearly see the entire process from users visiting the platform to completing the purchase, as well as the key decision points and user behaviors in each step.
You can choose suitable drawing tools according to personal or team habits, such as Figma, Visio, or online flowchart tools such as ProcessOn.
It is recommended to use ProcessOn , which is a powerful drawing software that supports drawing various charts such as flowcharts, mind maps, UML diagrams, etc. It provides a rich symbol library and style modification functions to facilitate users to quickly create and beautify charts.
1. Open ProcessOn official website, go to the personal file page, click New to create a flowchart . Or go to the template community and search for " user flowchart " and select a template.
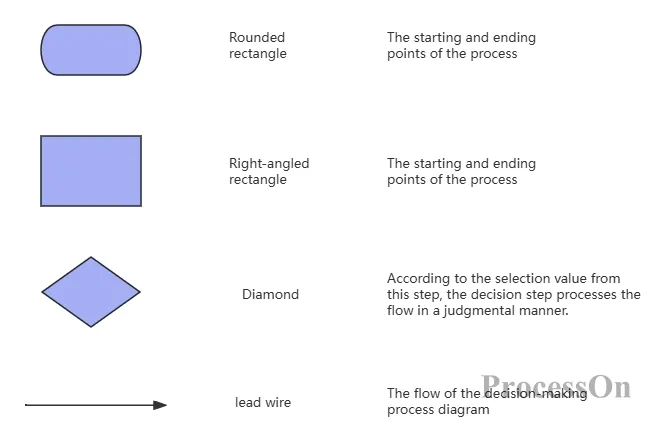
2. Drag the required symbols from the graphic library on the left, such as rectangles, diamonds, arrows, etc., to start building the flowchart framework. Use arrows to connect the steps to ensure the correct direction of the process , and add comments next to key steps to explain user behavior, decision logic or key indicators.
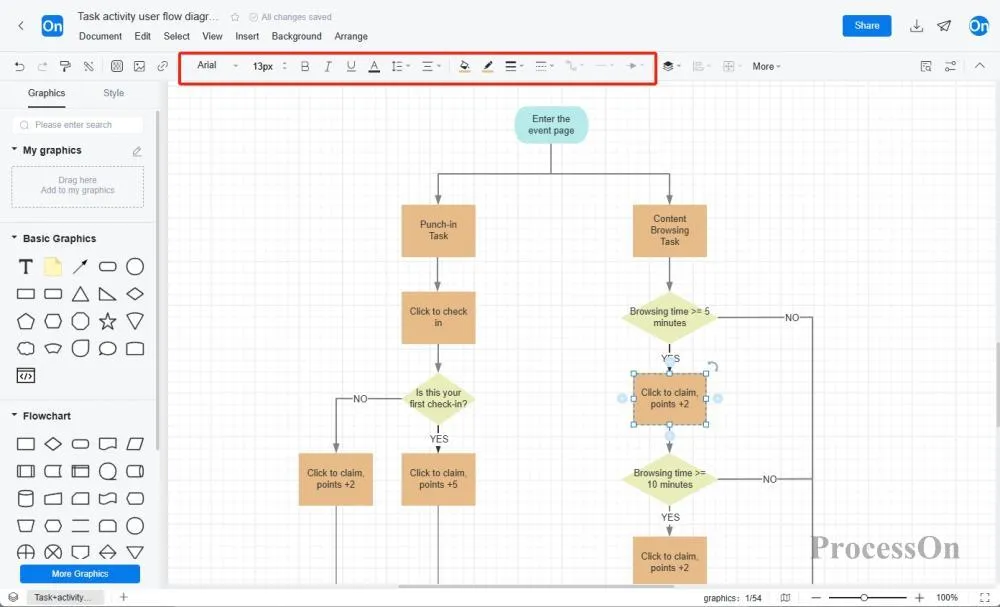
3. Select the graphic and use the top toolbar to adjust the color, font, layout, etc. to make the user flow diagram more beautiful and easy to read.
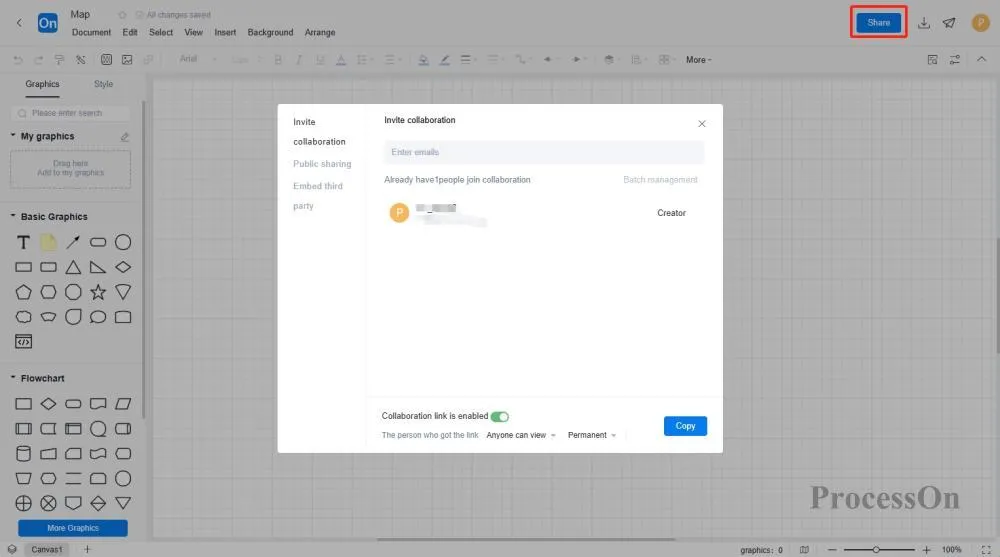
4. After the drawing is completed, it can be exported as an image or PDF format, which can be inserted into corporate documents and shared with team members. You can also directly share the flowchart with colleagues or customers for team members to view or edit online.
The ProcessOn template community contains a variety of user flow diagram templates for reference, and supports copying to improve drawing efficiency. The following are some templates for sharing.
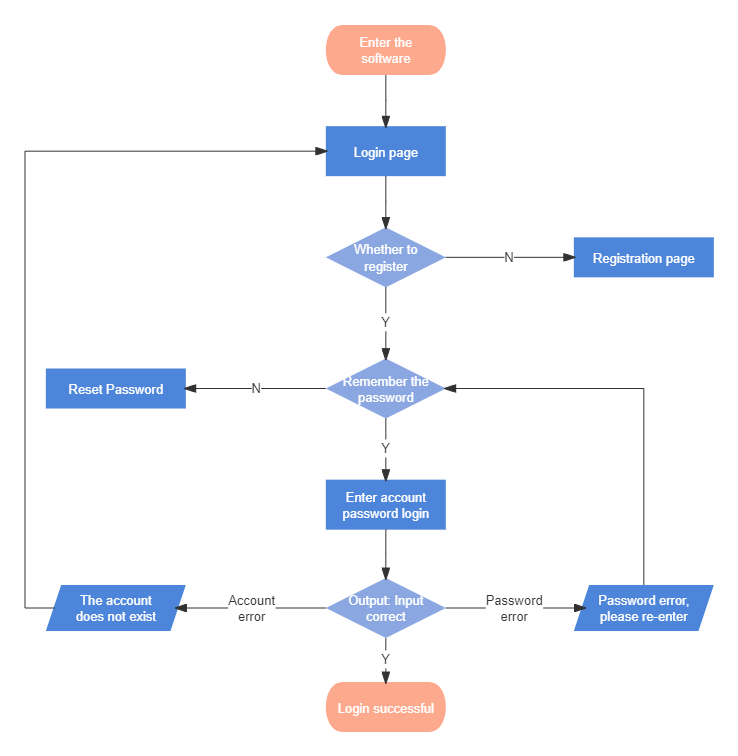
Website registration user flow chart
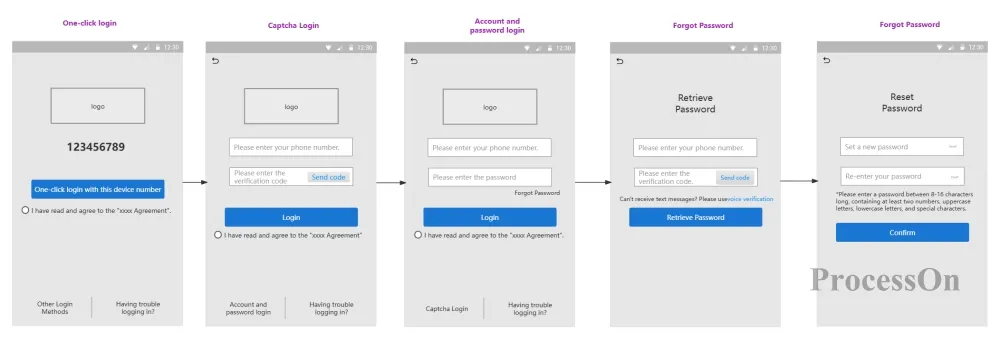
Registration and login user flow chart
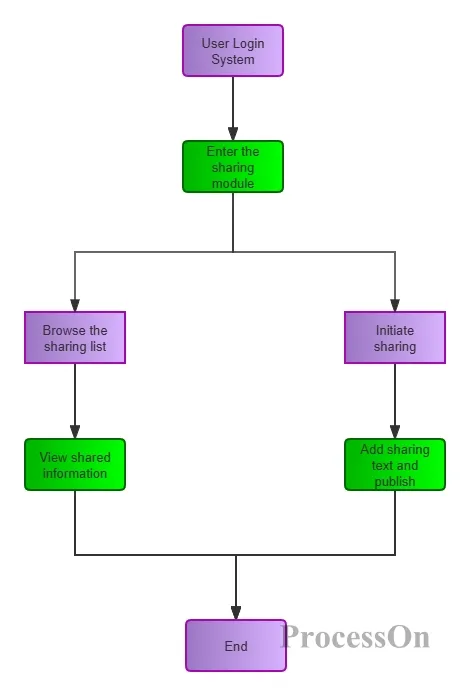
Sharing module user flow chart
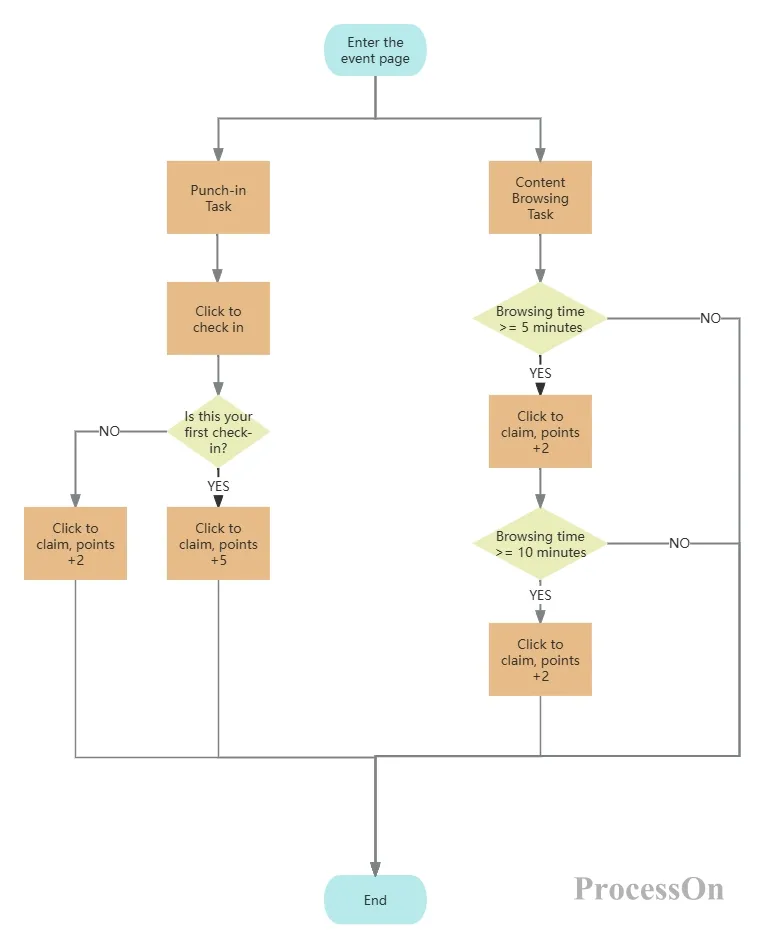
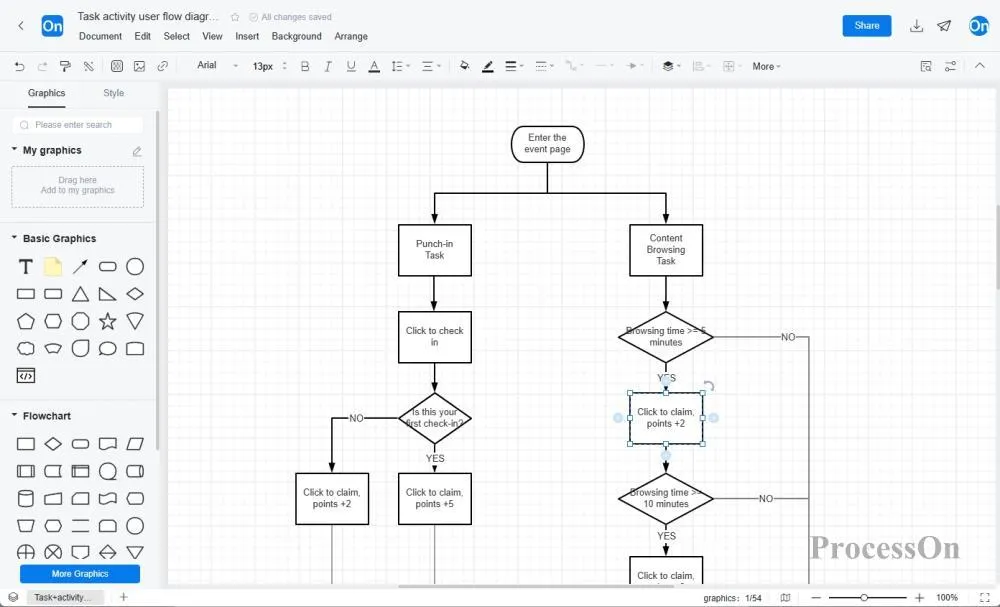
Task Activity User Flow Diagram
User flow diagram is an indispensable tool in product design and optimization. It helps us deeply understand user behavior, optimize user experience, and promote team collaboration. Mastering the drawing and application of user flow diagram will bring a smoother and more efficient user journey to your product.