A sequence diagram is a UML interaction diagram that shows the dynamic collaboration between multiple objects by describing the time sequence of messages sent between objects, including sending messages, receiving messages, processing messages, and returning messages.
The sequence diagram focuses on showing the interaction sequence between objects, especially the time sequence of the interaction. It can intuitively describe concurrent processes. It has a wide range of usage scenarios and can be used in almost all walks of life to sort out business processes and make the business look very clear. It can also sort out open source software and the relationship between various components. The hierarchy is very clear and easy to understand .
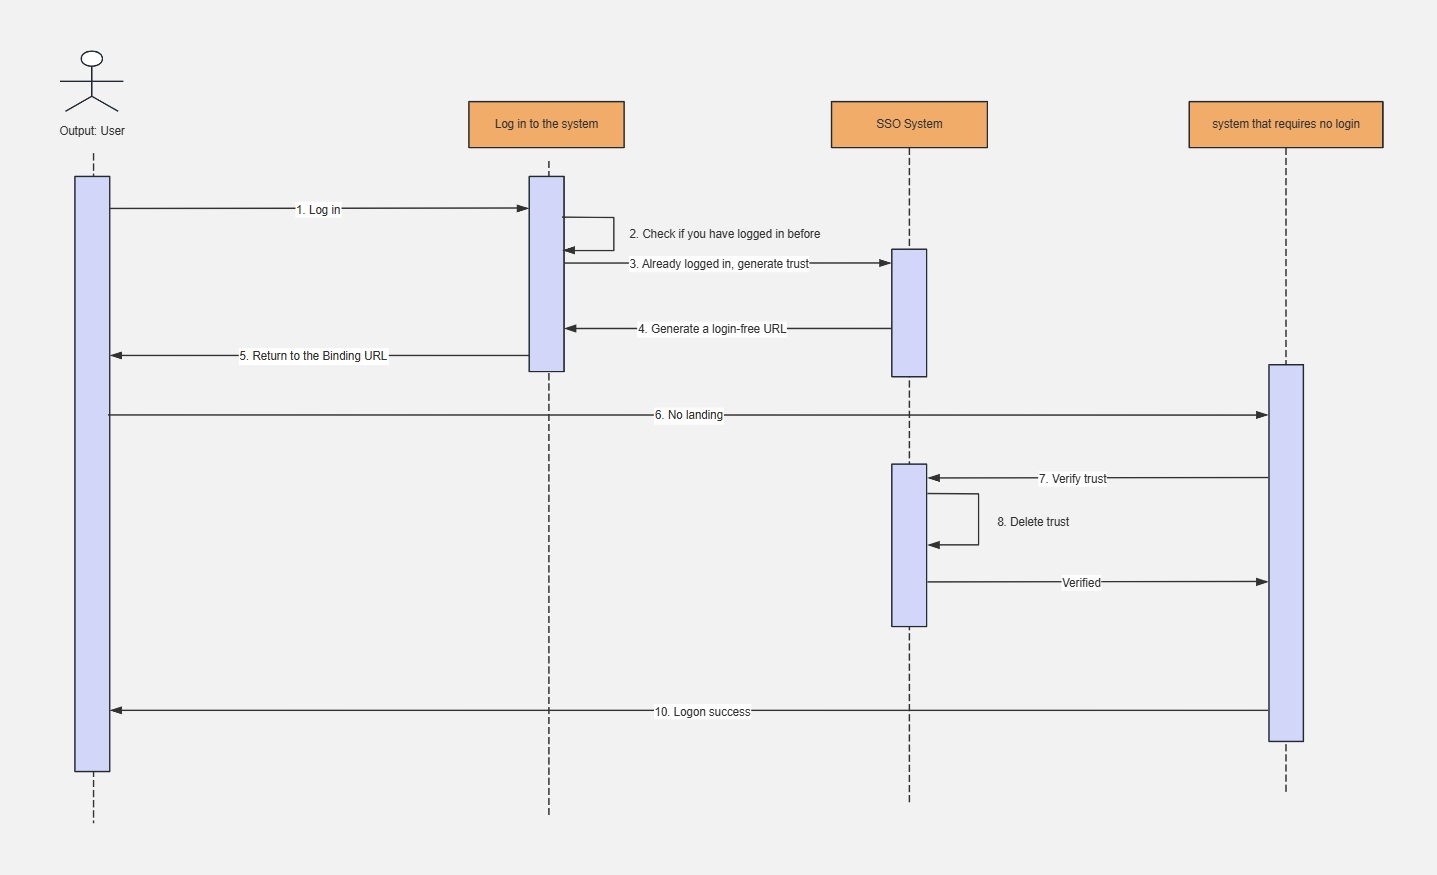
Single sign-on sequence diagram
There are five main components of a sequence diagram:
1. Actor
System roles, which can be people or other systems and subsystems, are represented by a small person icon.
2. Object
The object is located at the top of the sequence diagram and is represented by a rectangle. There are three general ways to name objects:
1) Object name and class name. For example: iPhone : mobile phone.
2) Only the class name is displayed, not the object, which is an anonymous object. For example, ": mobile phone" is represented by ": class" in the sequence diagram.
3) Only the object name is displayed, not the class name. For example, " Apple phone:" is represented by "object:" in the sequence diagram.
3. Lifeline
There is a vertical dotted line between each object and the bottom center of the sequence diagram. This is the lifeline of the object (the timeline of the object), which is represented by a vertical dotted line. The messages between objects exist between the two dotted lines.
4. Activation
Also called control focus, it represents the operations performed during a certain period of time on the object timeline in the sequence diagram, represented by a very narrow rectangular bar .
5. Message
Represents information sent between objects. Messages are divided into three types.
1) Synchronous Message. The sender of the message passes control to the receiver of the message, then stops the activity and waits for the receiver to give up or return control. It is used to indicate the meaning of synchronization and is represented by a solid line and a solid arrow.
2) Asynchronous Message. The sender of a message passes a signal to the receiver of the message through a message, and then continues its own activities without waiting for the receiver to return a message or control. The receiver and sender of an asynchronous message work concurrently, which is represented by a solid line and a greater than sign.
3) Return Message: A return message indicates a return from a procedure call and is represented by a less than sign and a dotted line.
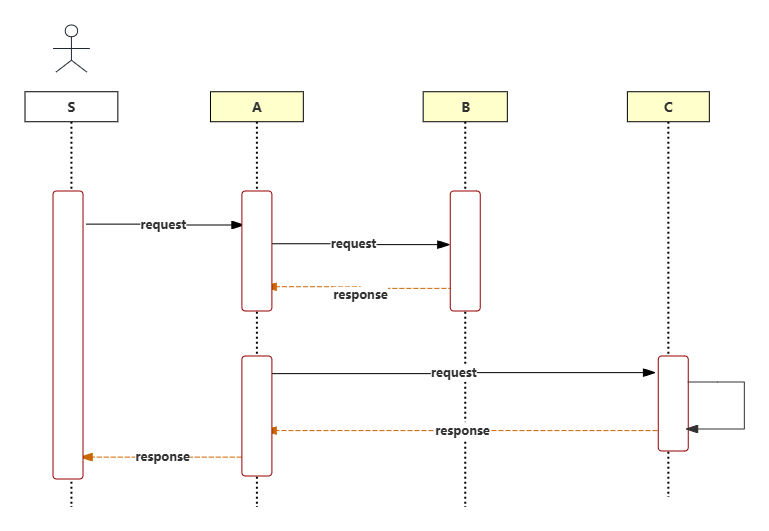
The method of drawing a sequence diagram can be simply summarized into the following three steps:
1. Draw clear boundaries and identify the interaction context
That is, define the scope of the sequence diagram you want to draw, and understand the premise and background of the sequence diagram you want to draw.
For example, "student information management" is the interactive content of the time-series diagram to be drawn. There is no need to extend it upward to student registration and identity authentication, no need for user login, and no need to extend it downward to irrelevant content such as querying class schedules and downloading materials.
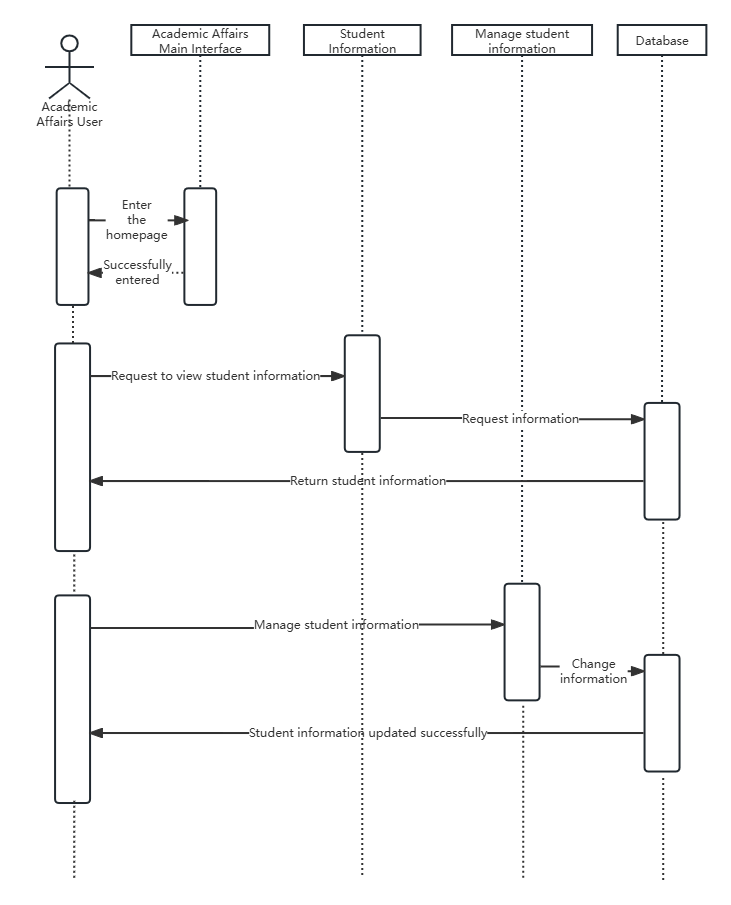
Student information management sequence diagram
2. Organizing roles and objects
In the "Student Information Management Sequence Diagram", the roles include students/teaching users, and the objects include the teaching main interface, student information interface, student information management interface, and database.
Note: roles and objects are nouns; verbs cannot be roles and objects.
3. Add a message
Starting from a message that triggers the entire interaction, draw all messages from top to bottom between the lifelines, and note the characteristics of each message, such as parameters.
Step 1: Enter the ProcessOn file page, create a new flowchart, click "More Graphics" in the lower left corner to add UML graphics types to the graphics area
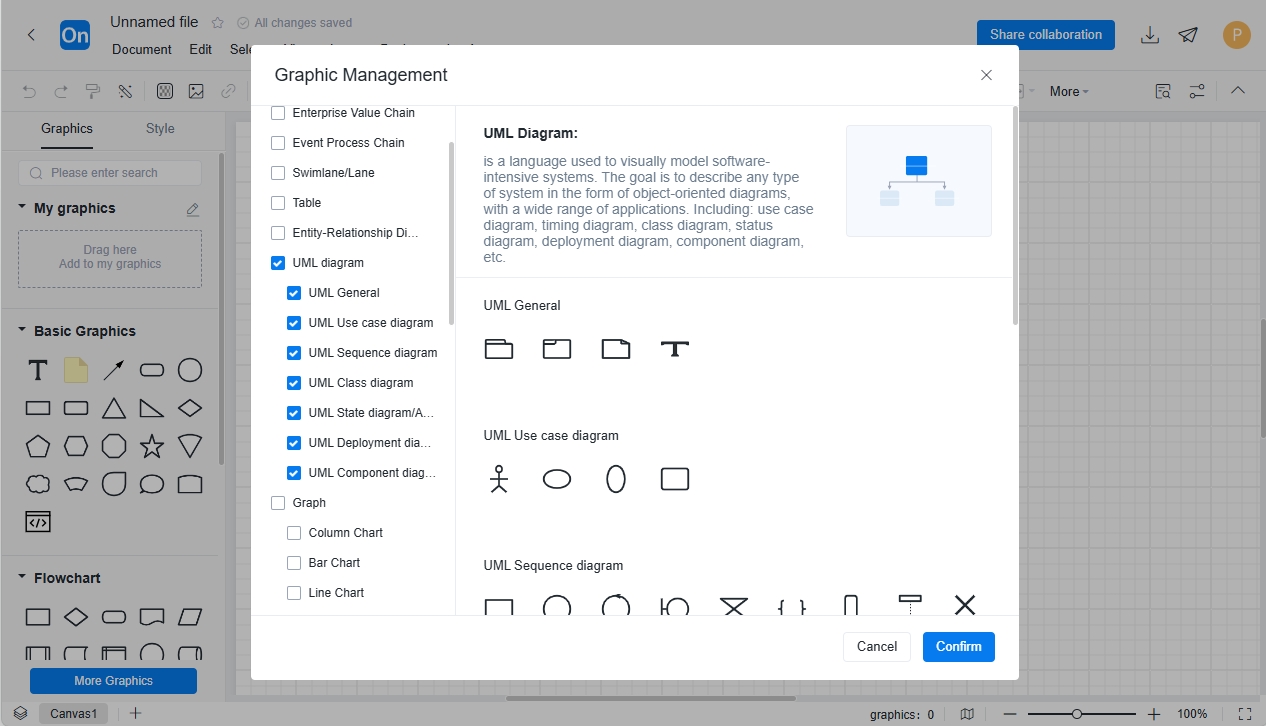
Step 2: Drag the UML graphics from the graphics library on the left to the editing area
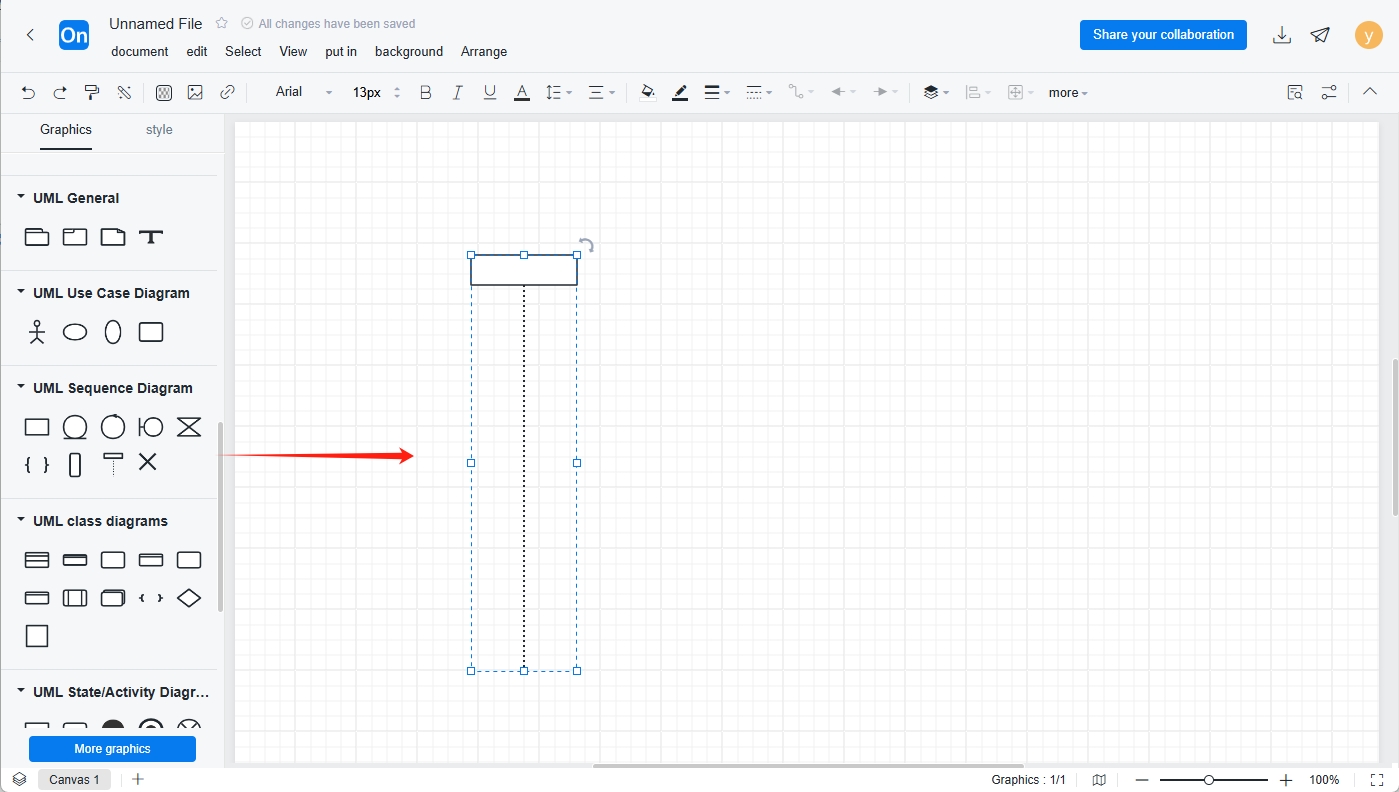
Step 3: Add text content and layout. If you want to make your sequence diagram more beautiful, you can fill the title, rectangular frame, etc. with different colors , make the same icons as large as possible, and keep the upper and lower graphics aligned.
For beginners , if you find it difficult to draw a sequence diagram now , you can study and learn from other people's template cases first. The editor has selected some UML sequence diagrams for different scenarios in the template library , hoping to provide you with a reference.
1. User login and registration sequence diagram
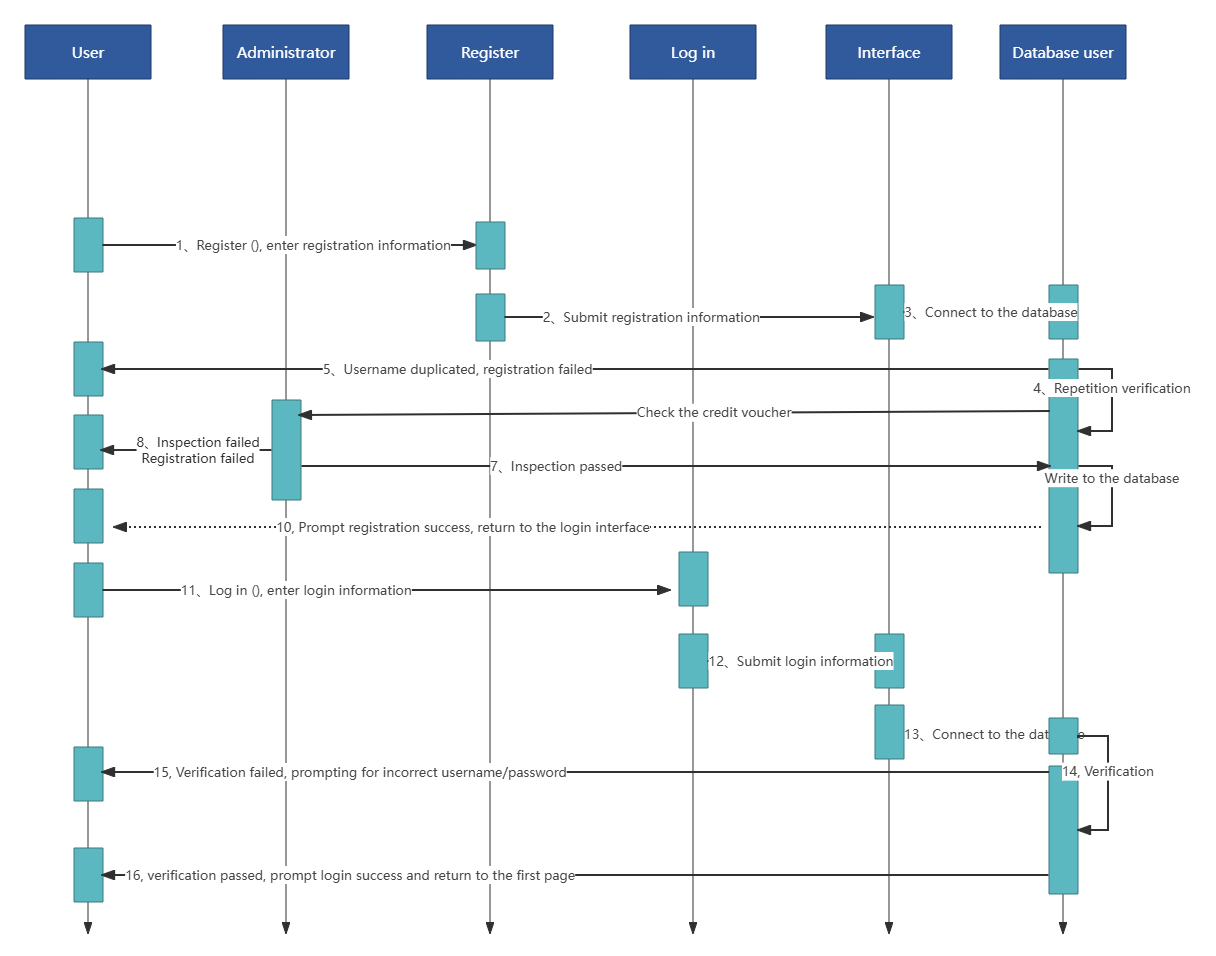
User login and registration sequence diagram
2. Create a new cross-domain sequence diagram
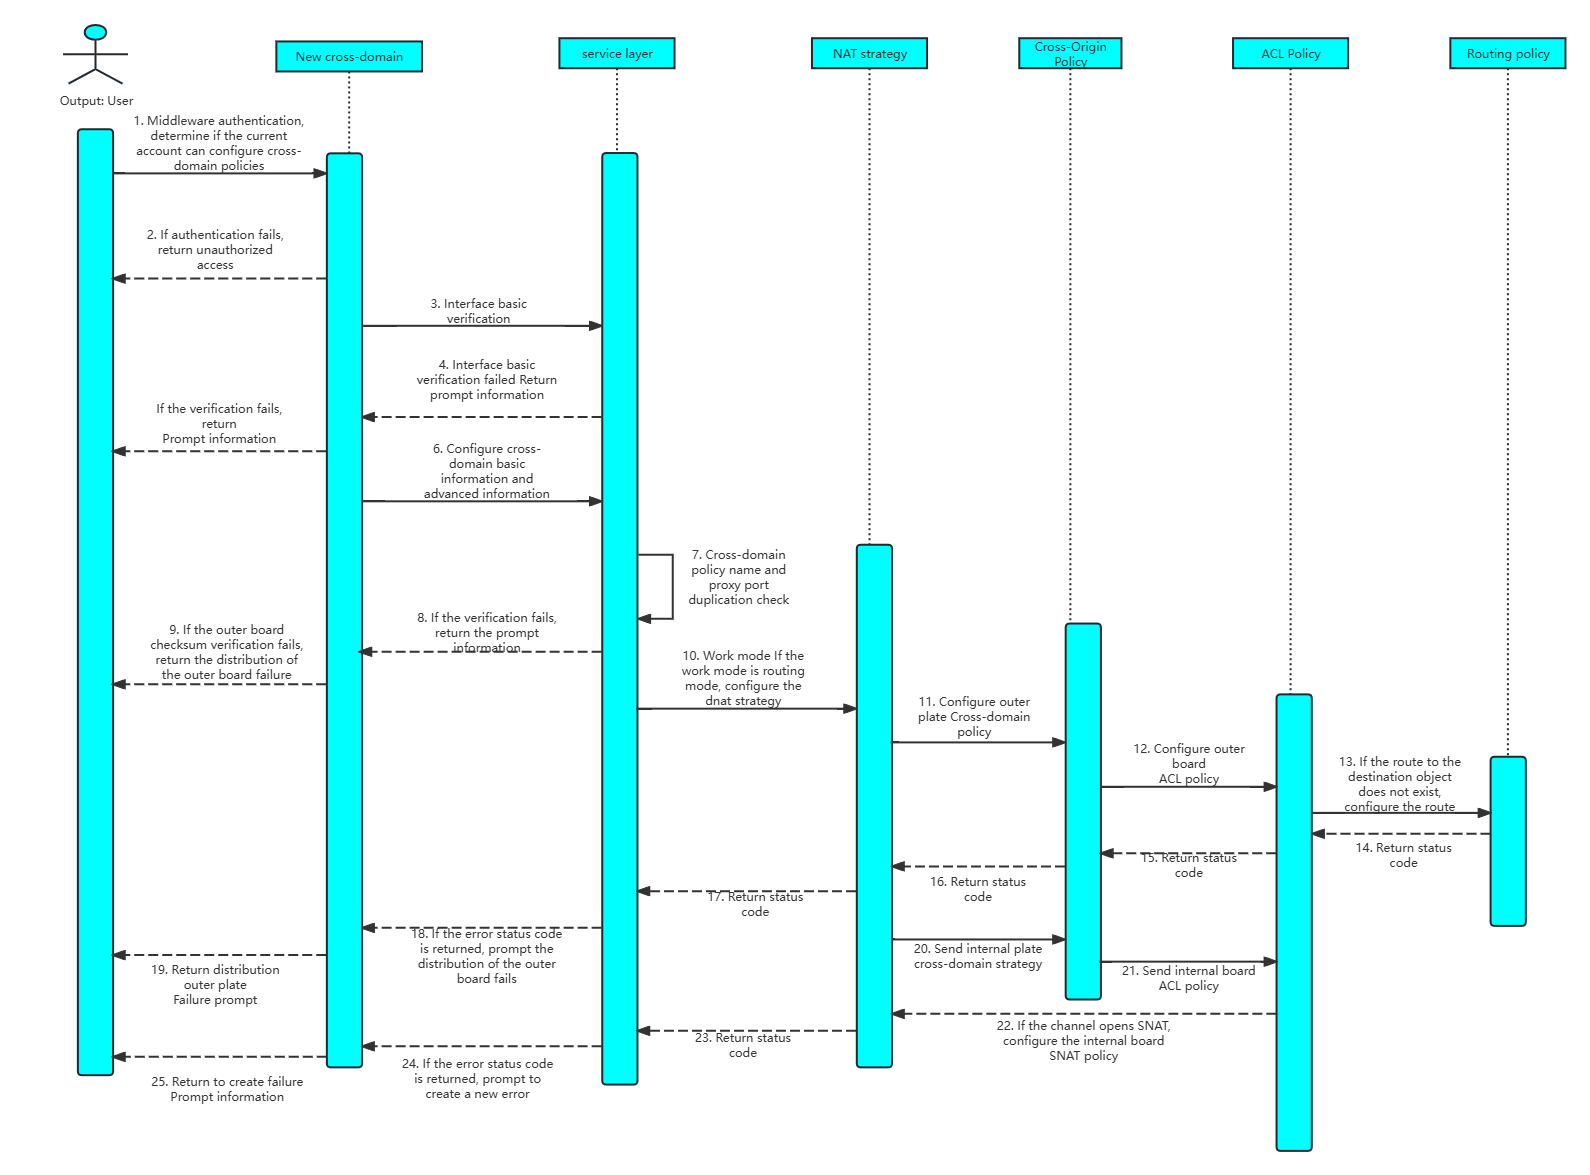
Create a new cross-domain sequence diagram
3. Inventory Management Sequence Diagram
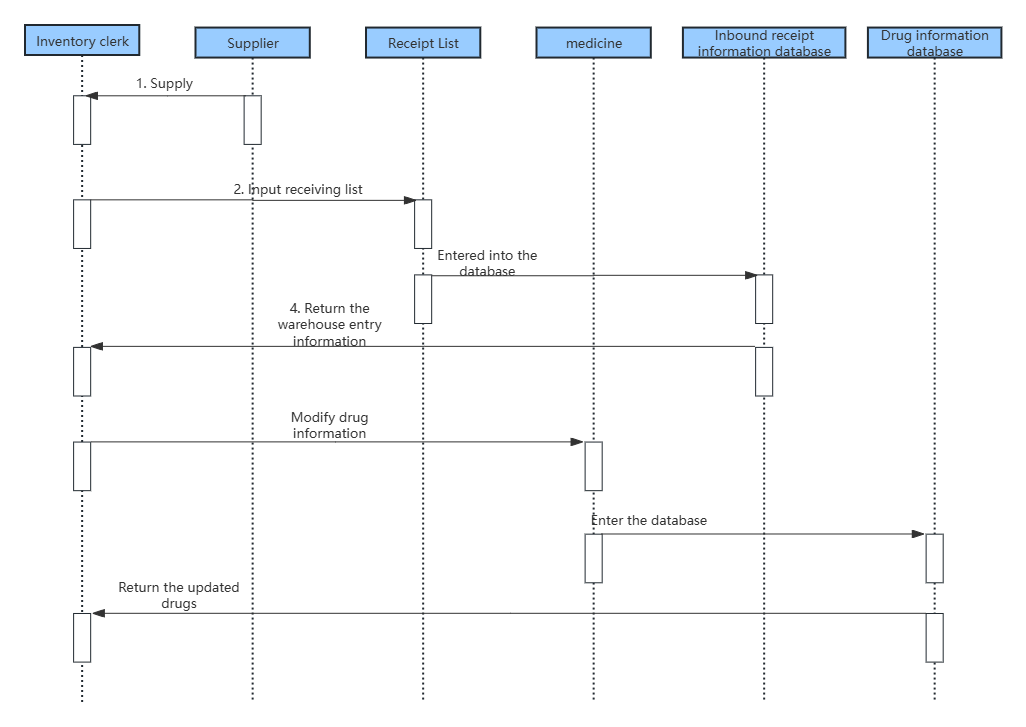
Inventory Management Sequence Diagram
4. Payment transaction sequence diagram
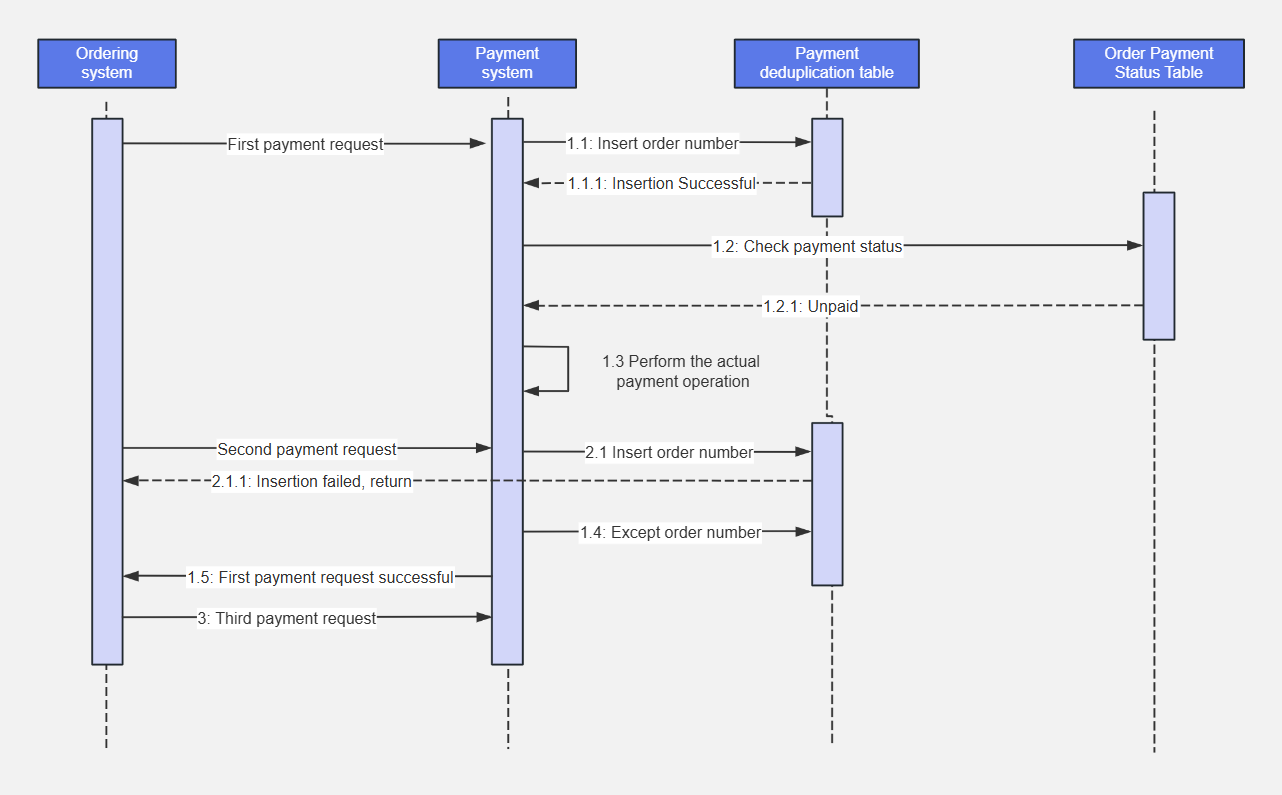
Payment transaction sequence diagram
The above is the relevant content of UML sequence diagram. The templates are all from the ProcessOn template community. If you want to view more sequence diagram templates, you can enter the ProcessOn template community and search for "sequence diagram" . Everyone is welcome to learn and use it.
ProcessOn supports online editing of flowcharts, mind maps, organizational charts , UML diagrams and other graphics. Users can create new content from scratch, or easily edit and modify existing drawing frameworks and case templates. The operation is simple and easy to use.
Related reading:
UML diagram complete guide: Master 14 types of UML diagrams in 10 minutes
What is a UML use case diagram?
What is UML Activity Diagram? How to Draw an Activity Diagram?