UML (Unified Modeling Language) is an abbreviation for Unified Modeling Language, which is a visual tool for describing software systems. UML provides a rich set of graphical symbols and specifications for describing and visualizing the structure, behavior, and interaction of software systems. By using UML, software developers can better understand and communicate the design and functions of the system, reduce development risks, and improve development efficiency.
UML diagrams are mainly divided into three categories, with a total of 14 types:
Structural graphics (static diagrams): mainly analyze and describe the structure of the system or process, including: class diagrams, object diagrams, component diagrams, composite structure diagrams, deployment diagrams, package diagrams and profile diagrams.
Behavioral graphics (dynamic diagrams): mainly describe the behavior of the system, its participants and its building components, including: activity diagrams, use case diagrams, and state diagrams.
Interactive graphics: communication diagrams, interaction overview diagrams, timing diagrams, sequence diagrams
Next, I want to share with you the concept and use of each graph using the ProcessOn drawing tool :
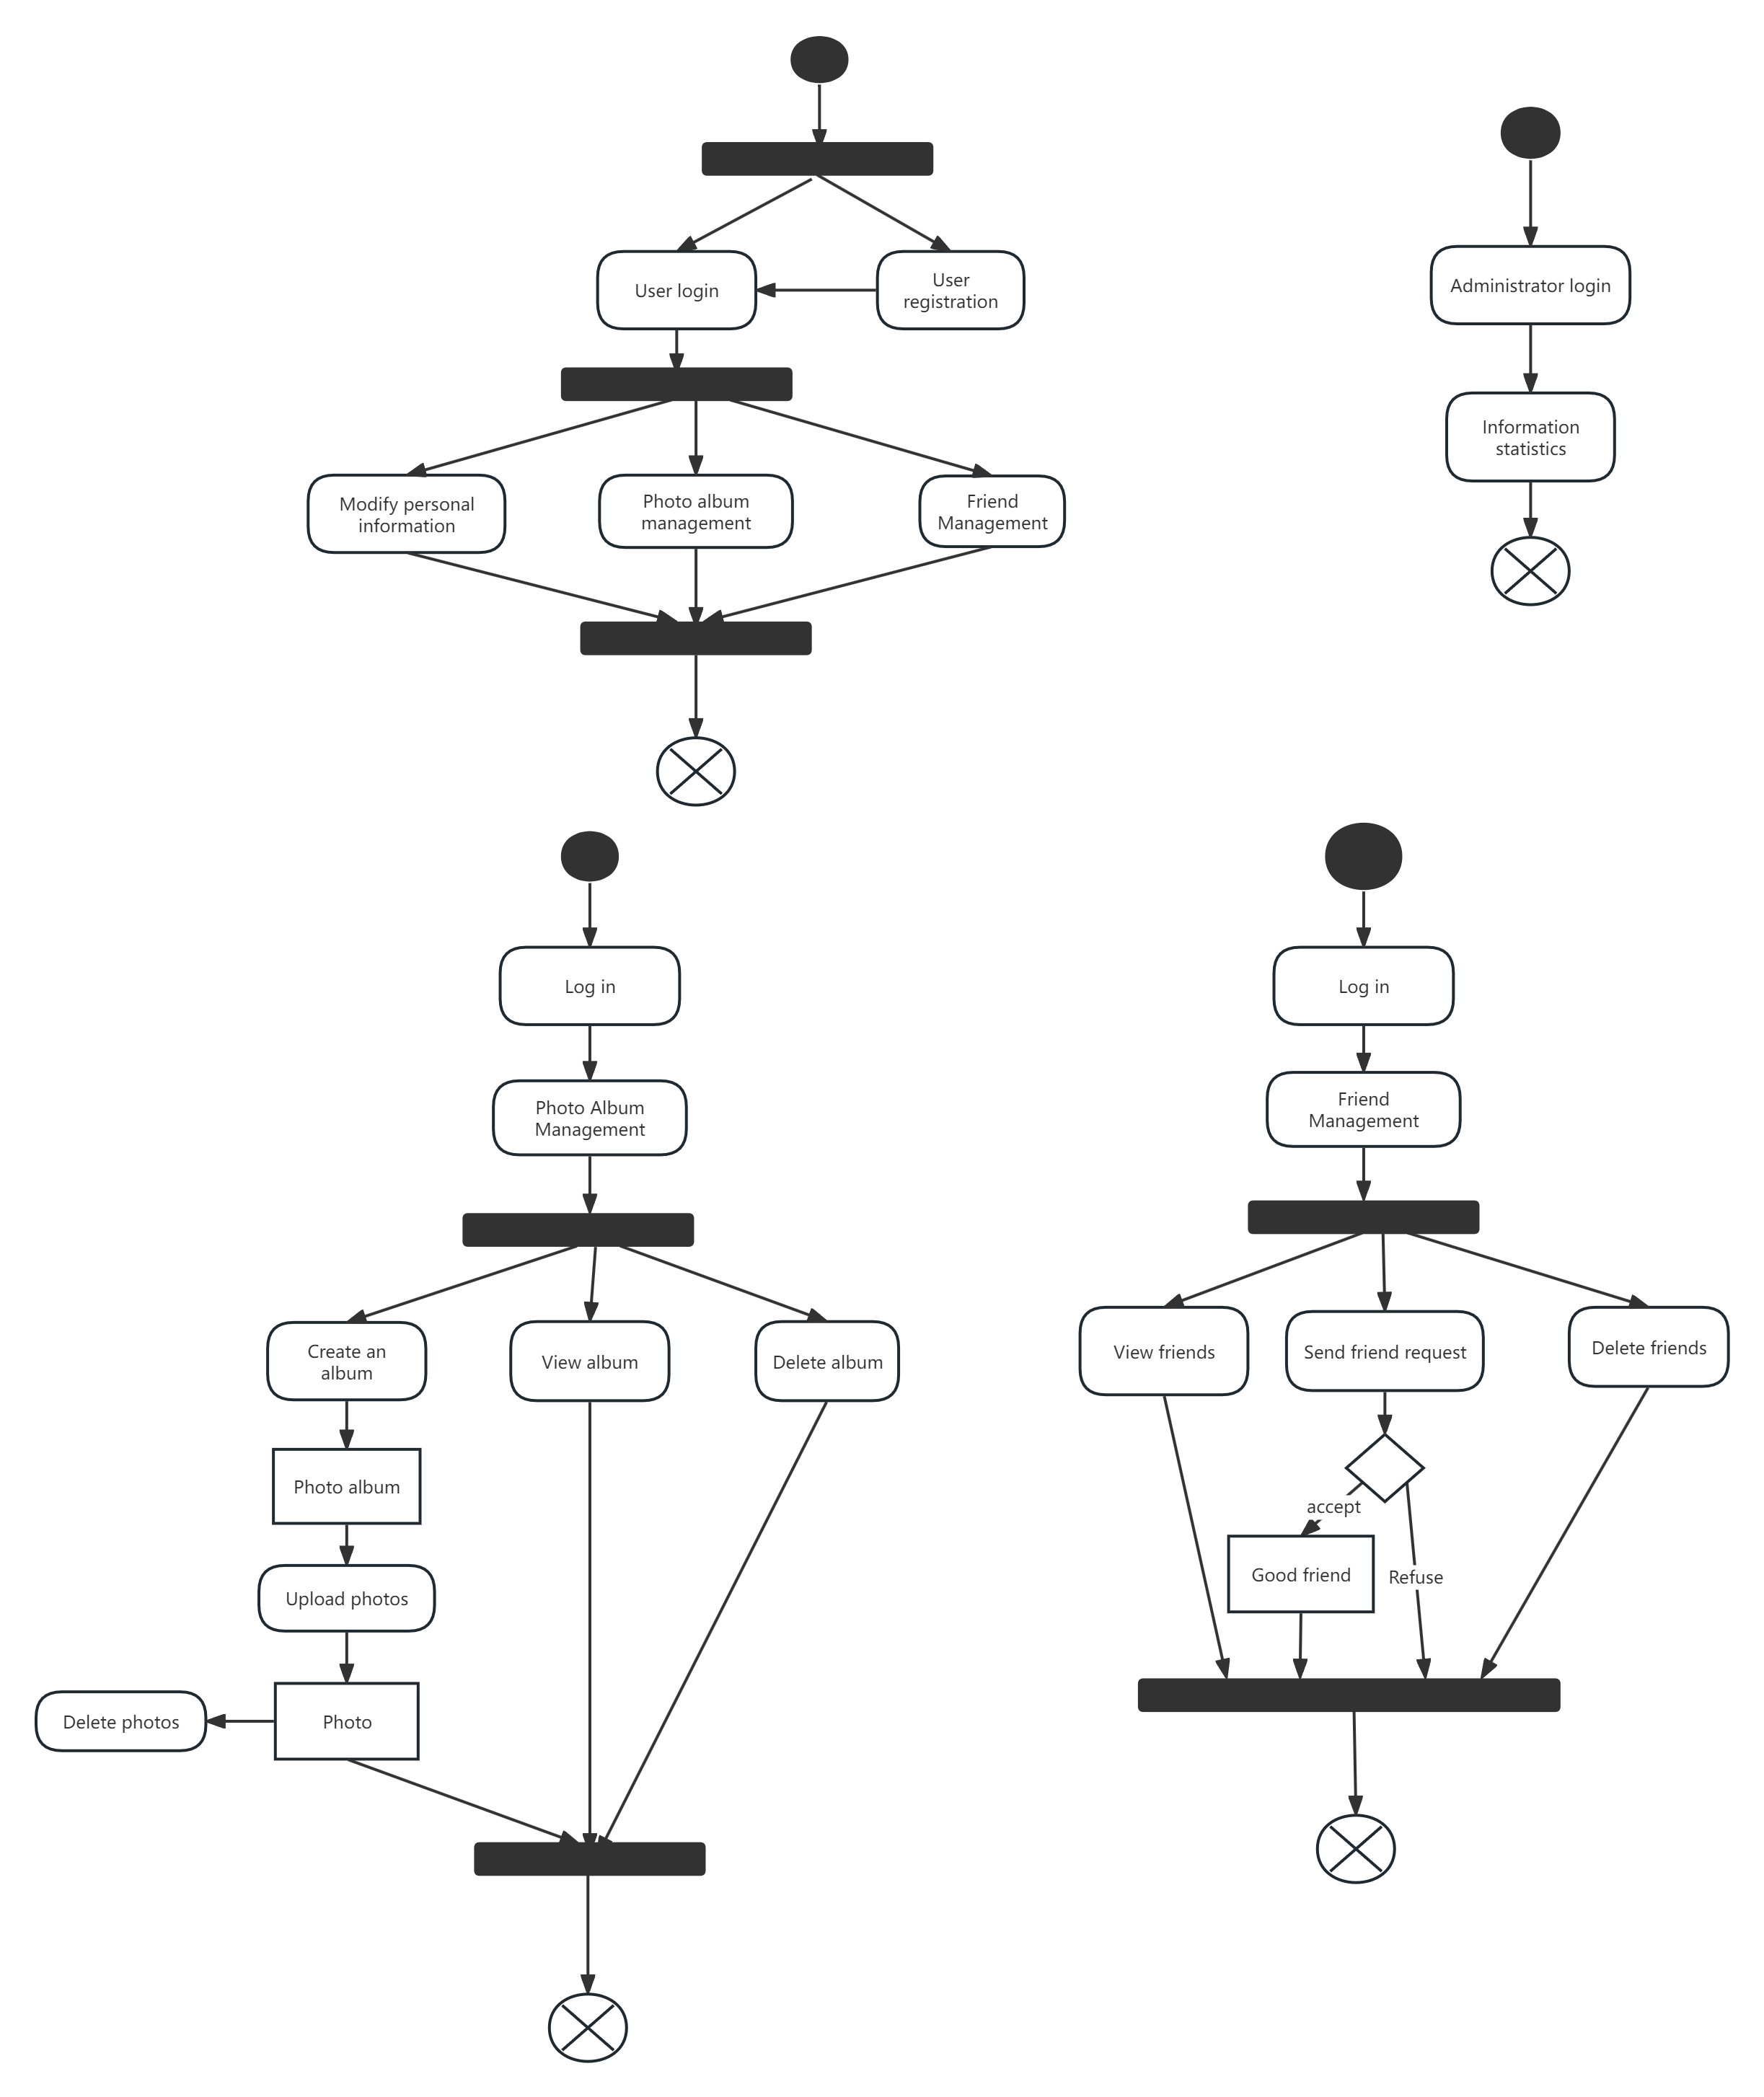
Activity diagram is mainly used to describe a series of activities in a system, subsystem or business process and the control flow between these activities. Activity diagrams show the flow from activity to activity, including decision points (such as branches and merges), activities executed in parallel, and possible process loops. They are very useful for understanding and designing the workflow of a system, especially in business process modeling, workflow modeling, and system dynamic behavior modeling.
The main components of an activity diagram
1. Actions: Represents an operation step or task in a system or business process. Activities are connected by control flows.
2. Control Flows: Arrows represent the flow from one activity to another. Control flows can be unidirectional, or have conditional branches, and can also represent loops or concurrency.
3. Decision Points: including Fork and Join. Fork is used to indicate the start of parallel activities, while Join is used to indicate the end of parallel activities.
4. Swimlanes: Divide the activity diagram into different logical areas, each area represents a different participant (such as user, system or subsystem), which helps to understand the roles and responsibilities of different entities in the process.
5. Start and end points: represent the starting point and end point of the activity diagram respectively.
6. Object Flows: Although activity diagrams focus primarily on process control, they can also represent the flow of objects or data, especially when passing data between objects.
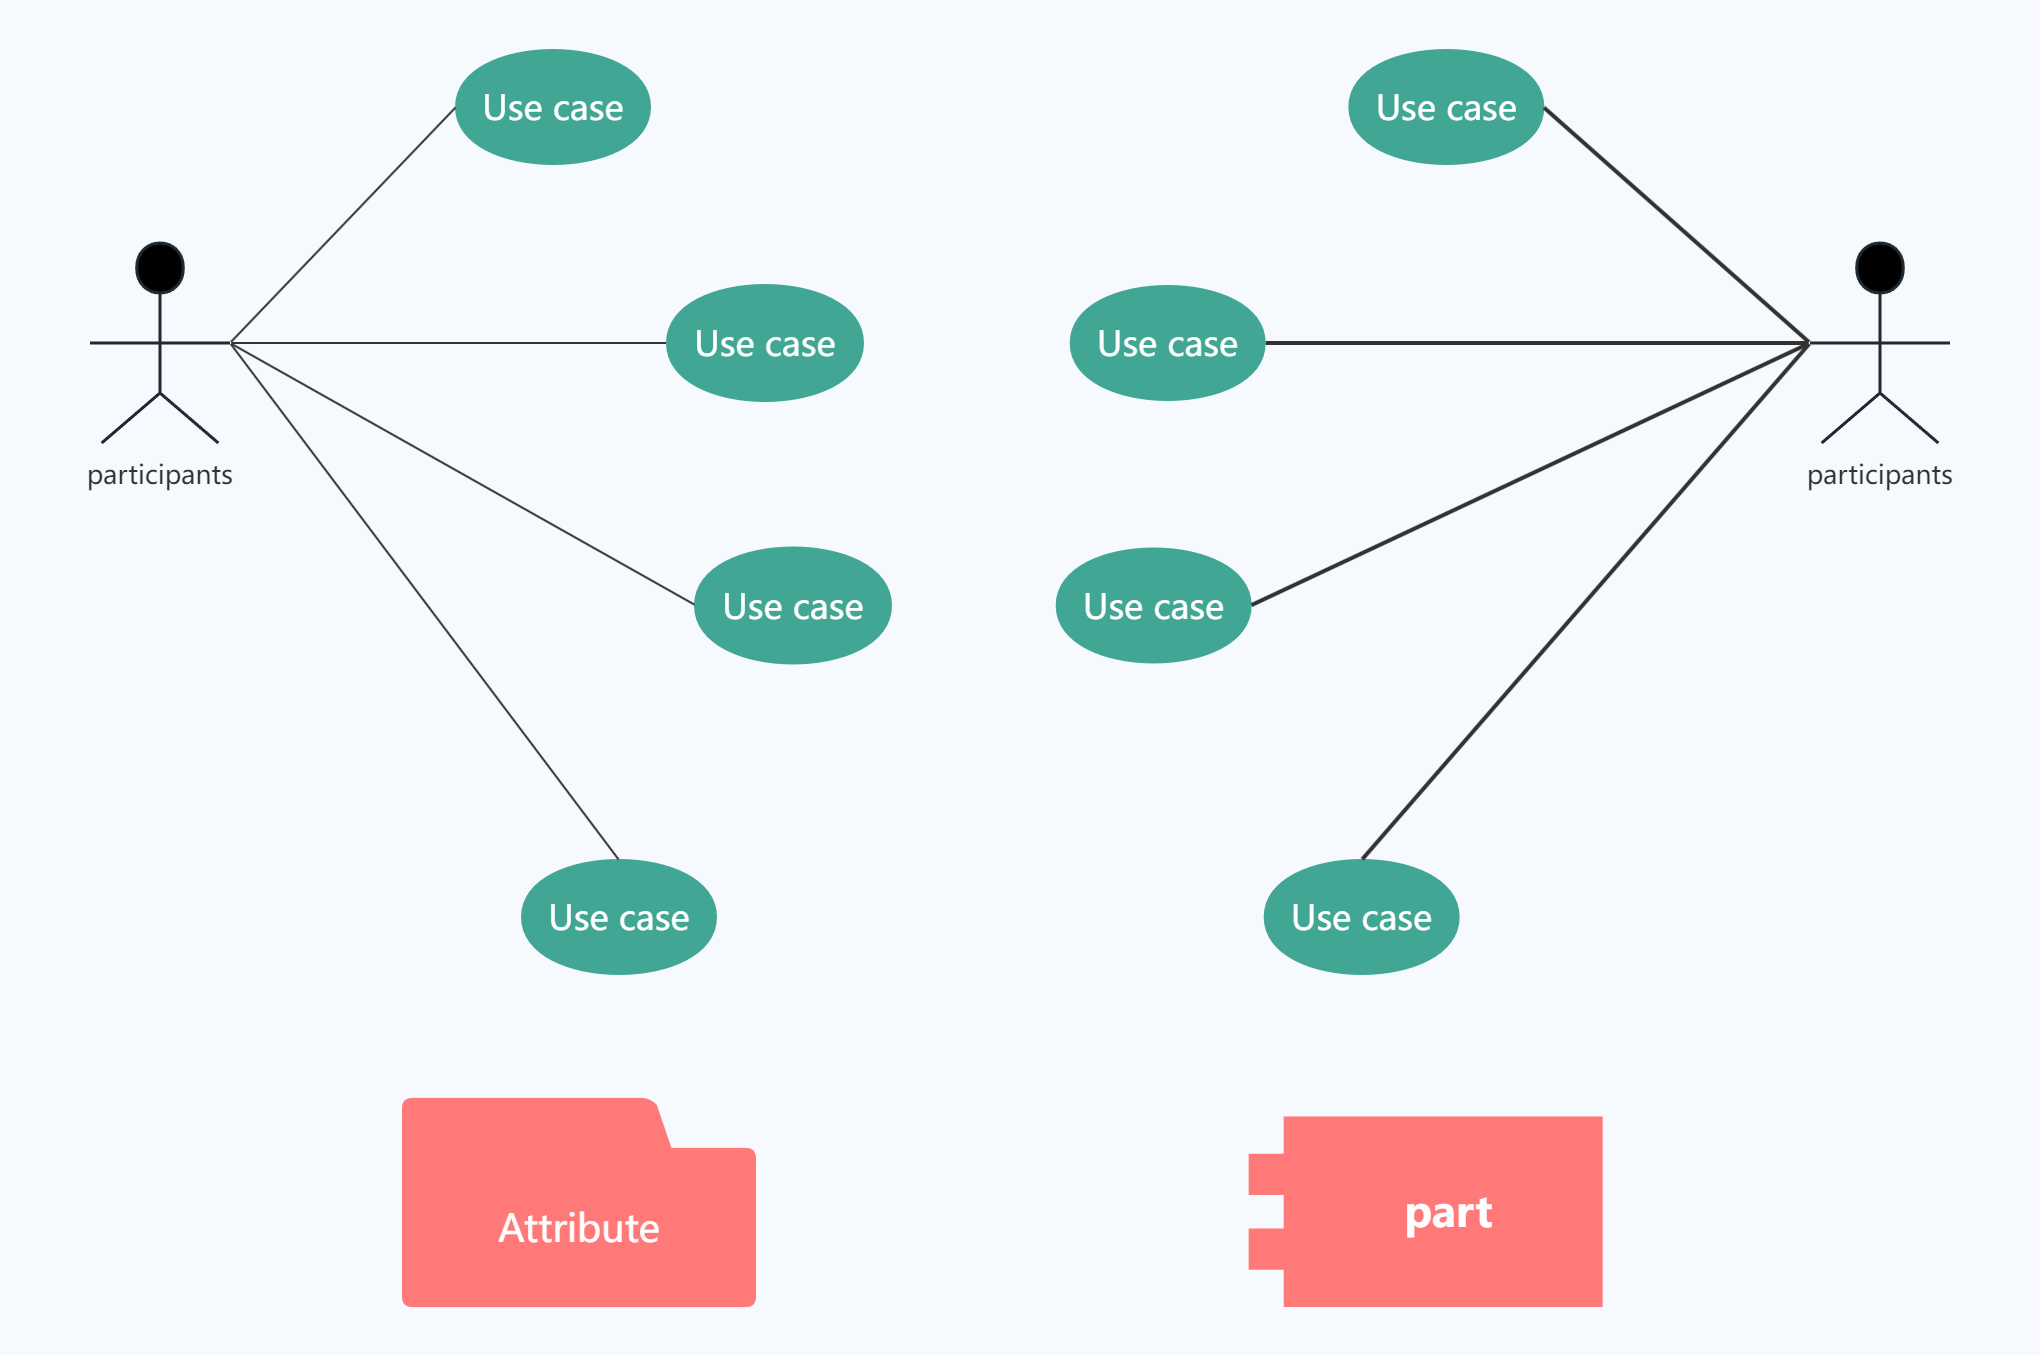
Use Case Diagram is a graphical tool used in software engineering to show the interaction between external users (participants) of the system and internal functions (use cases) of the system. It is an important diagram used in the requirements analysis phase in UML (Unified Modeling Language) to help developers and users understand the functional requirements of the system.
The basic components of a use case diagram are:
1. Actor:
Actors are external entities that interact with the system and can be people, organizations, external systems, or hardware devices.
In use case diagrams, actors are usually represented by "little people" icons.
2. Use Case:
A use case represents a functional unit of the system and describes how the system responds to requests from participants.
It defines the behavior of the system, that is, how the system reacts to requests from specific actors under specific conditions.
In a use case diagram, a use case is usually represented by an oval with the name of the use case written inside it.
3. Association:
Associations represent the relationship between actors and use cases, that is, which actor can trigger which use case.
An association is usually represented by a solid line with one end connected to the actor and the other end connected to the use case.
4. Include:
The include relationship indicates that the functionality of one use case (the including use case) is included or used by another use case (the base use case).
In the use case diagram, the include relationship is represented by a dotted arrow with the "<<include>>" label, with the arrow pointing to the base use case.
5. Extend:
The extend relationship indicates that under certain conditions, a use case (extended use case) can be inserted into another use case (base use case) to add additional behavior to it.
In a use case diagram, an extend relationship is represented by a dashed arrow with a "<<extend>>" label and a circle (representing the extension point), where the arrow points to the base use case and the circle is connected to a point in the base use case.
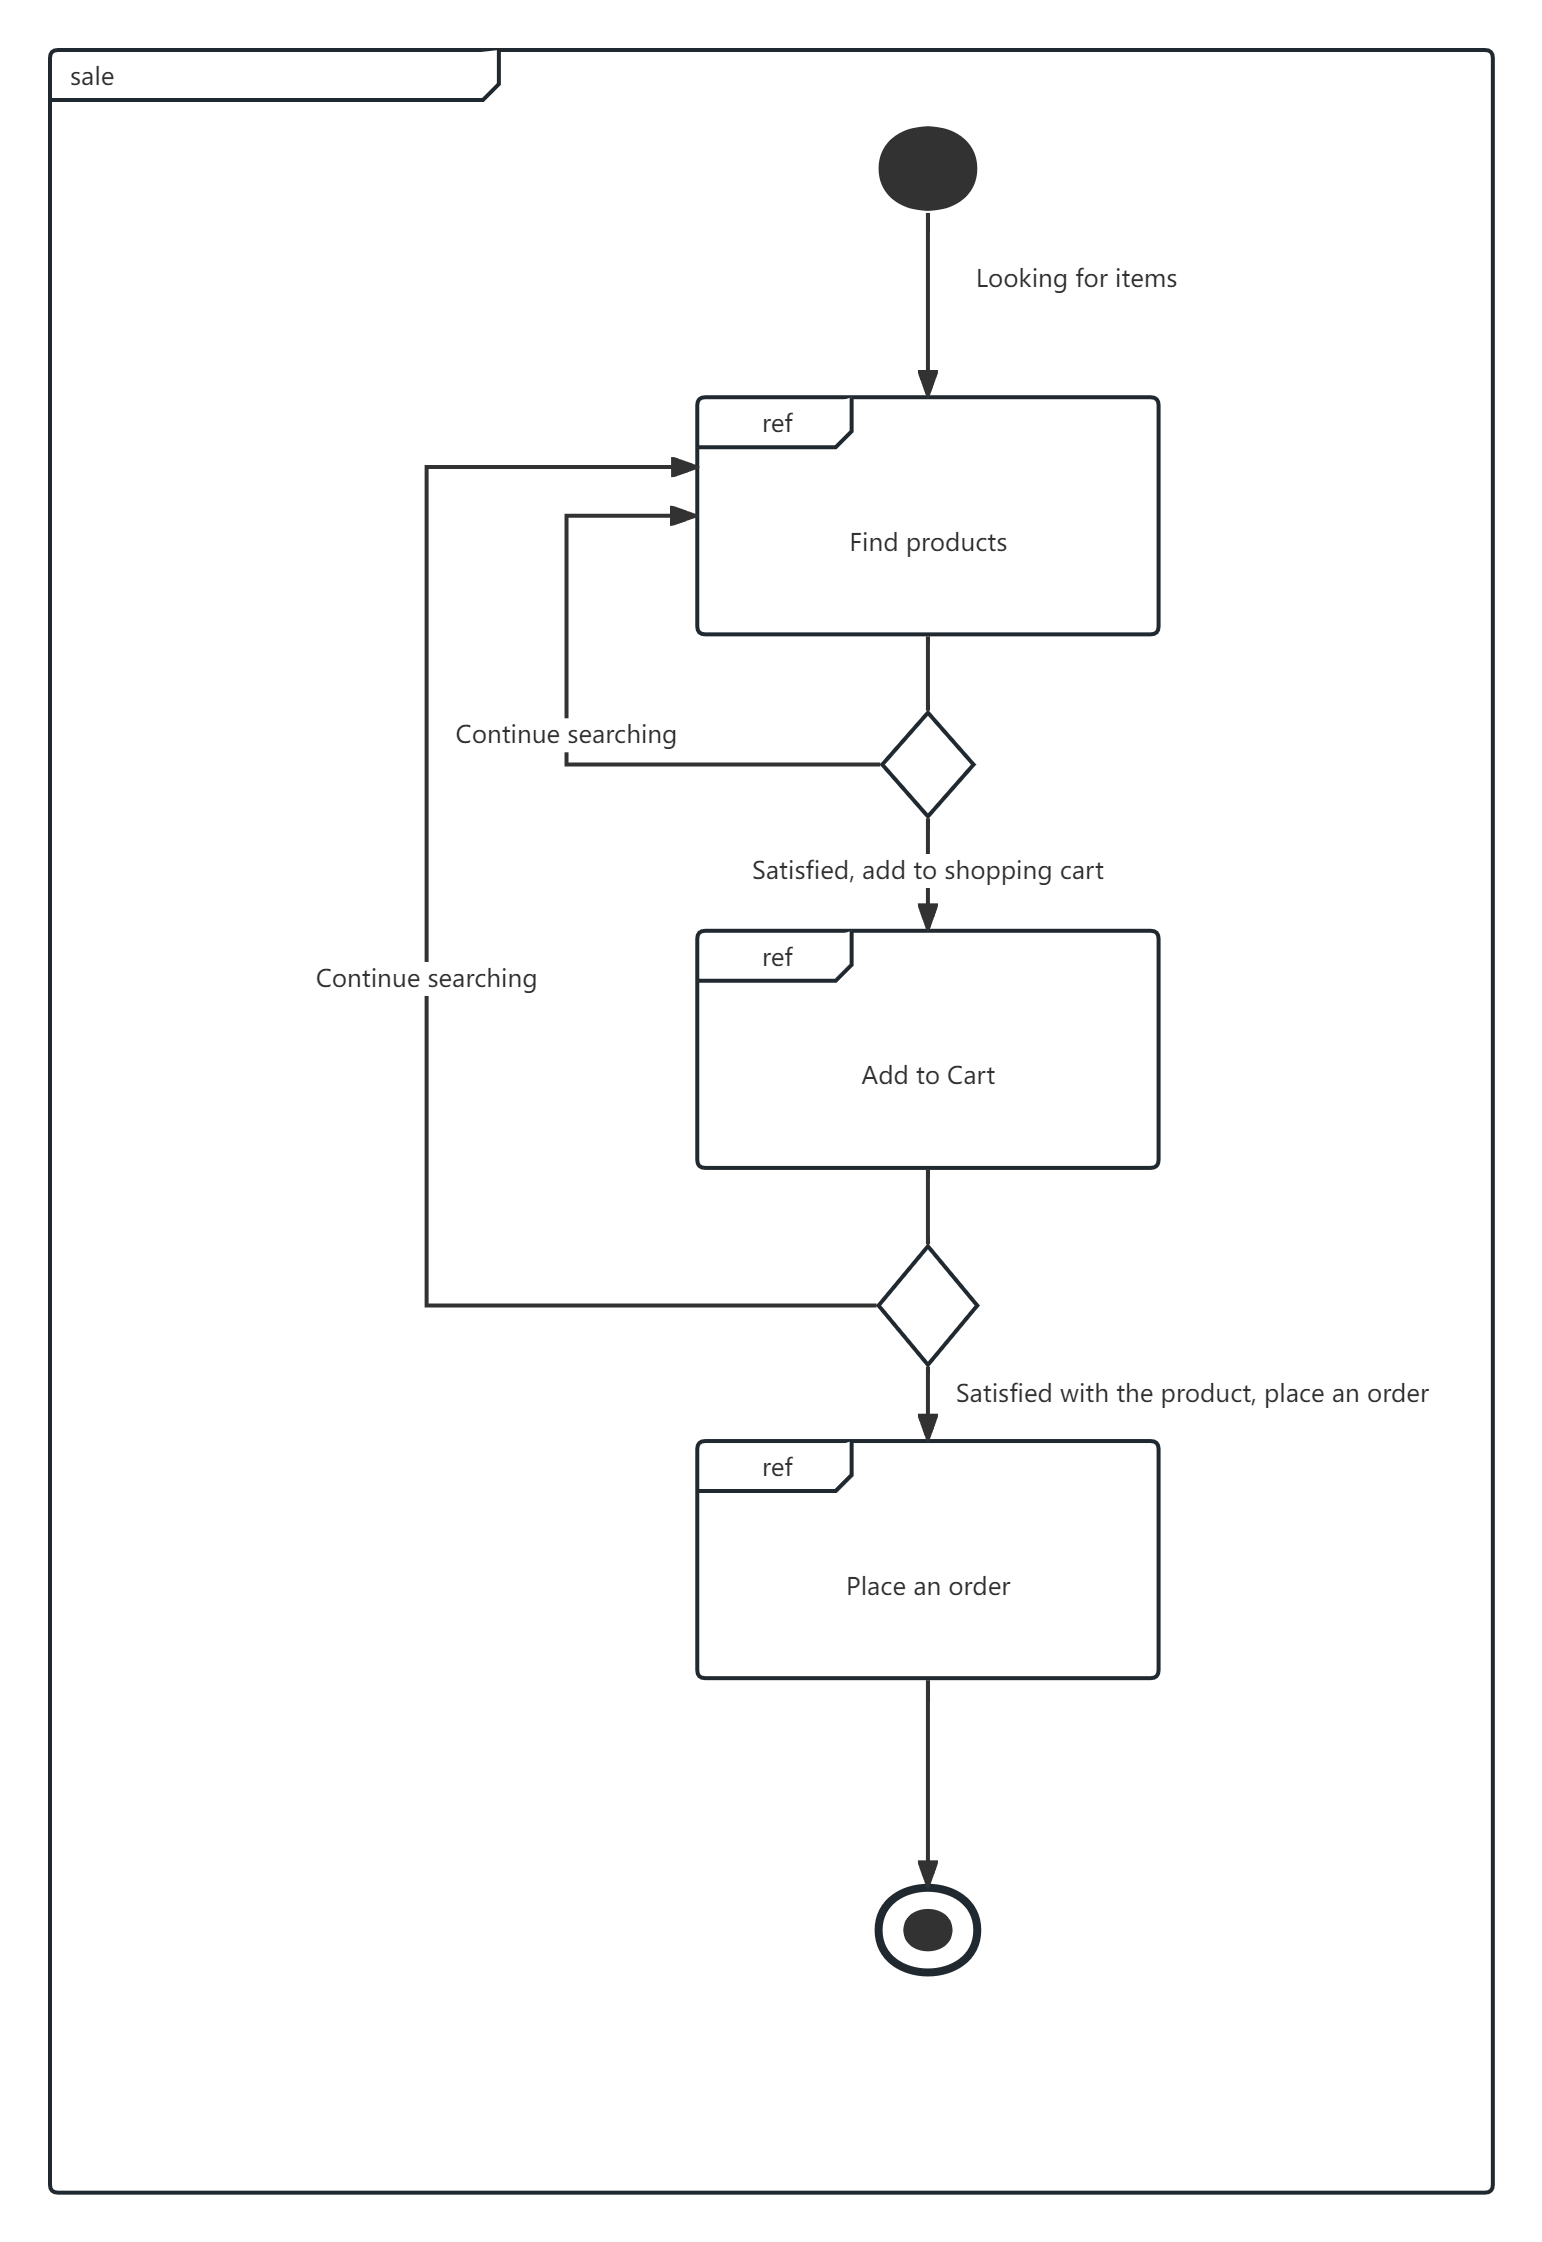
It is mainly used to connect different interaction diagrams (such as sequence diagrams, communication diagrams, etc.) together to provide an overall overview of the control flow in the interaction process. The following is a detailed explanation of the interaction overview diagram:
Definition and characteristics
Definition: An interaction overview diagram is a mixture of an interaction diagram and an activity diagram. It can be understood as a refined activity diagram in which the activities are represented by small sequence diagrams; it can also be understood as a sequence diagram decomposed using an activity diagram that indicates the control flow.
Features: The interaction overview diagram does not introduce new modeling elements. Its main elements come from activity diagrams and sequence diagrams. It focuses on the overall overview of the control flow in the interaction process, including the event or message flow between interaction diagrams.

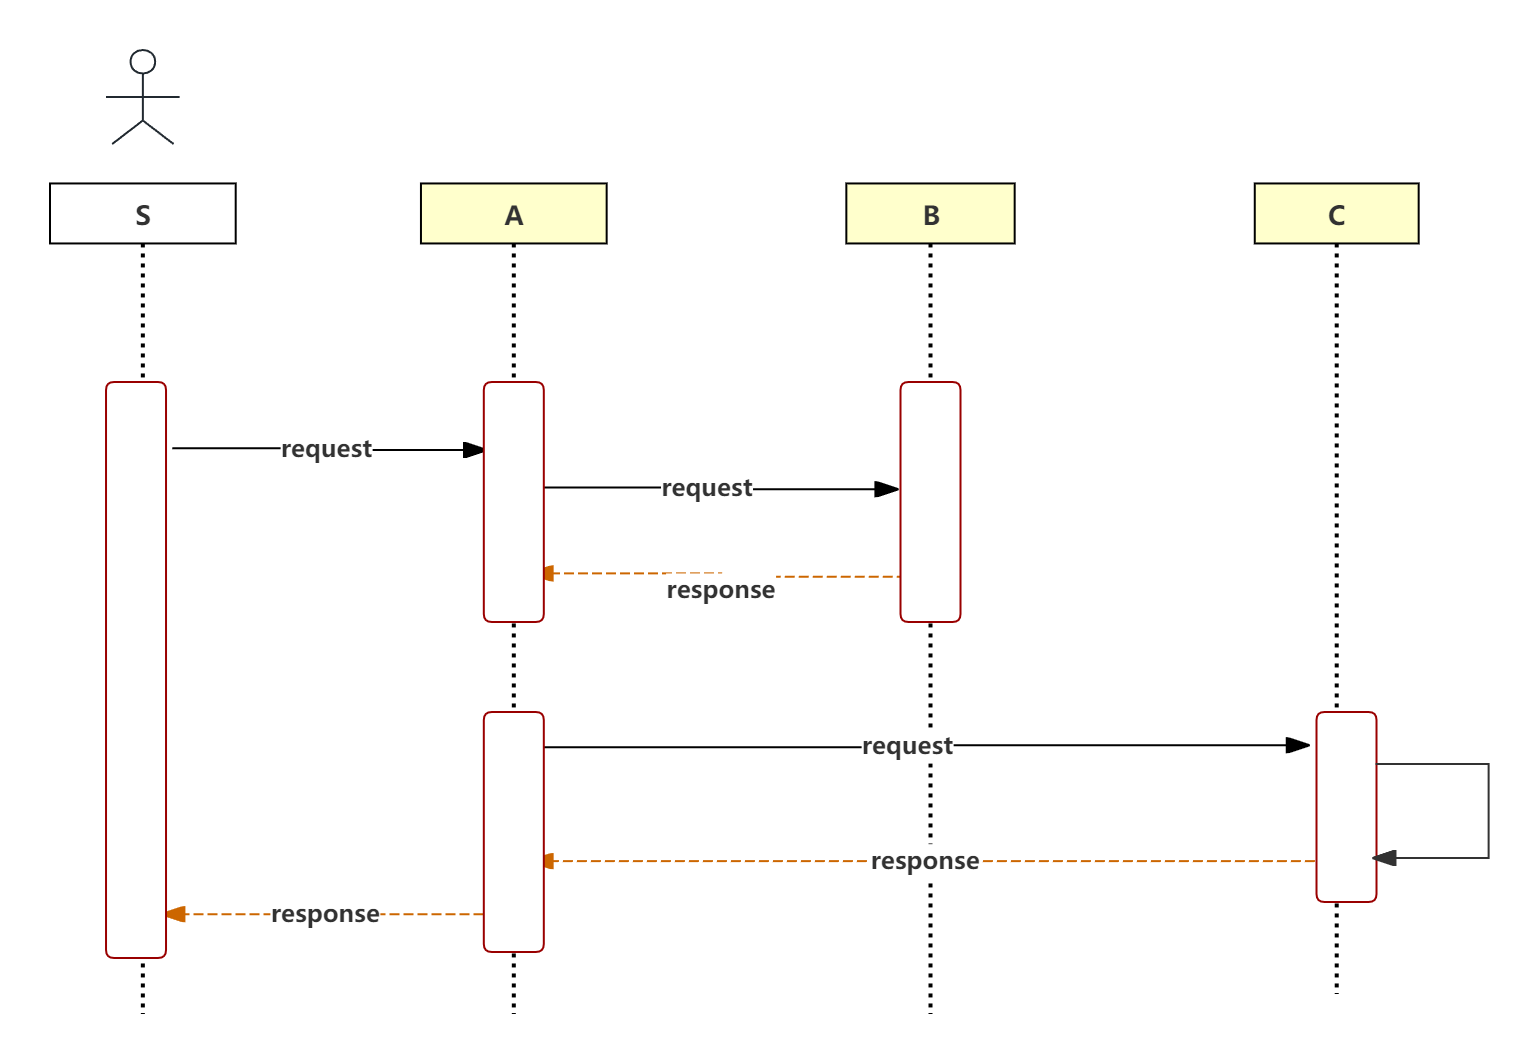
It is a UML (Unified Modeling Language) interaction diagram. It shows the dynamic collaboration between multiple objects by describing the time sequence of messages sent between objects. The following is a detailed explanation of the timing diagram:
Definition and characteristics
Definition: A sequence diagram is used to show the order of interaction between objects. It arranges the message transfer between objects in chronological order, thereby clearly expressing the collaborative relationship between objects.
Features: The timing diagram has a time sequence and can intuitively show the order and timing relationship of the interaction between objects. At the same time, it can also represent concurrent processes and distinguish the execution process of different objects through different lifelines.
The timing diagram mainly consists of the following elements:
Object: represents an entity in a sequence diagram, which can be a system role, subsystem, or other object. The object's existence time is represented by a lifeline in the sequence diagram.
Lifeline: The vertical dotted line at the bottom center of each object in the timing diagram represents the existence of the object over a period of time. The narrow rectangle on the lifeline represents the active period of the object, that is, the period when the object performs a certain operation.
Message: Information passed between objects, used to represent the interaction between objects. Messages can carry parameters and conditional expressions to represent the data passed and the conditions of the interaction.
Activation: The period when an object performs an operation, represented by a narrow rectangle on the lifeline in a sequence diagram. Activation indicates that an object starts performing an operation at a certain point in time and continues for a period of time.
State Diagram is an important diagram in UML (Unified Modeling Language) that is used to describe the dynamic behavior of an entity (such as an object, component, subsystem, etc.) based on event reactions. It shows how the entity reacts to different events based on its current state, and how these events lead to transitions between states. UML state diagrams are widely used in the analysis, design, and implementation stages of software development to help developers understand and design the dynamic behavior of the system.
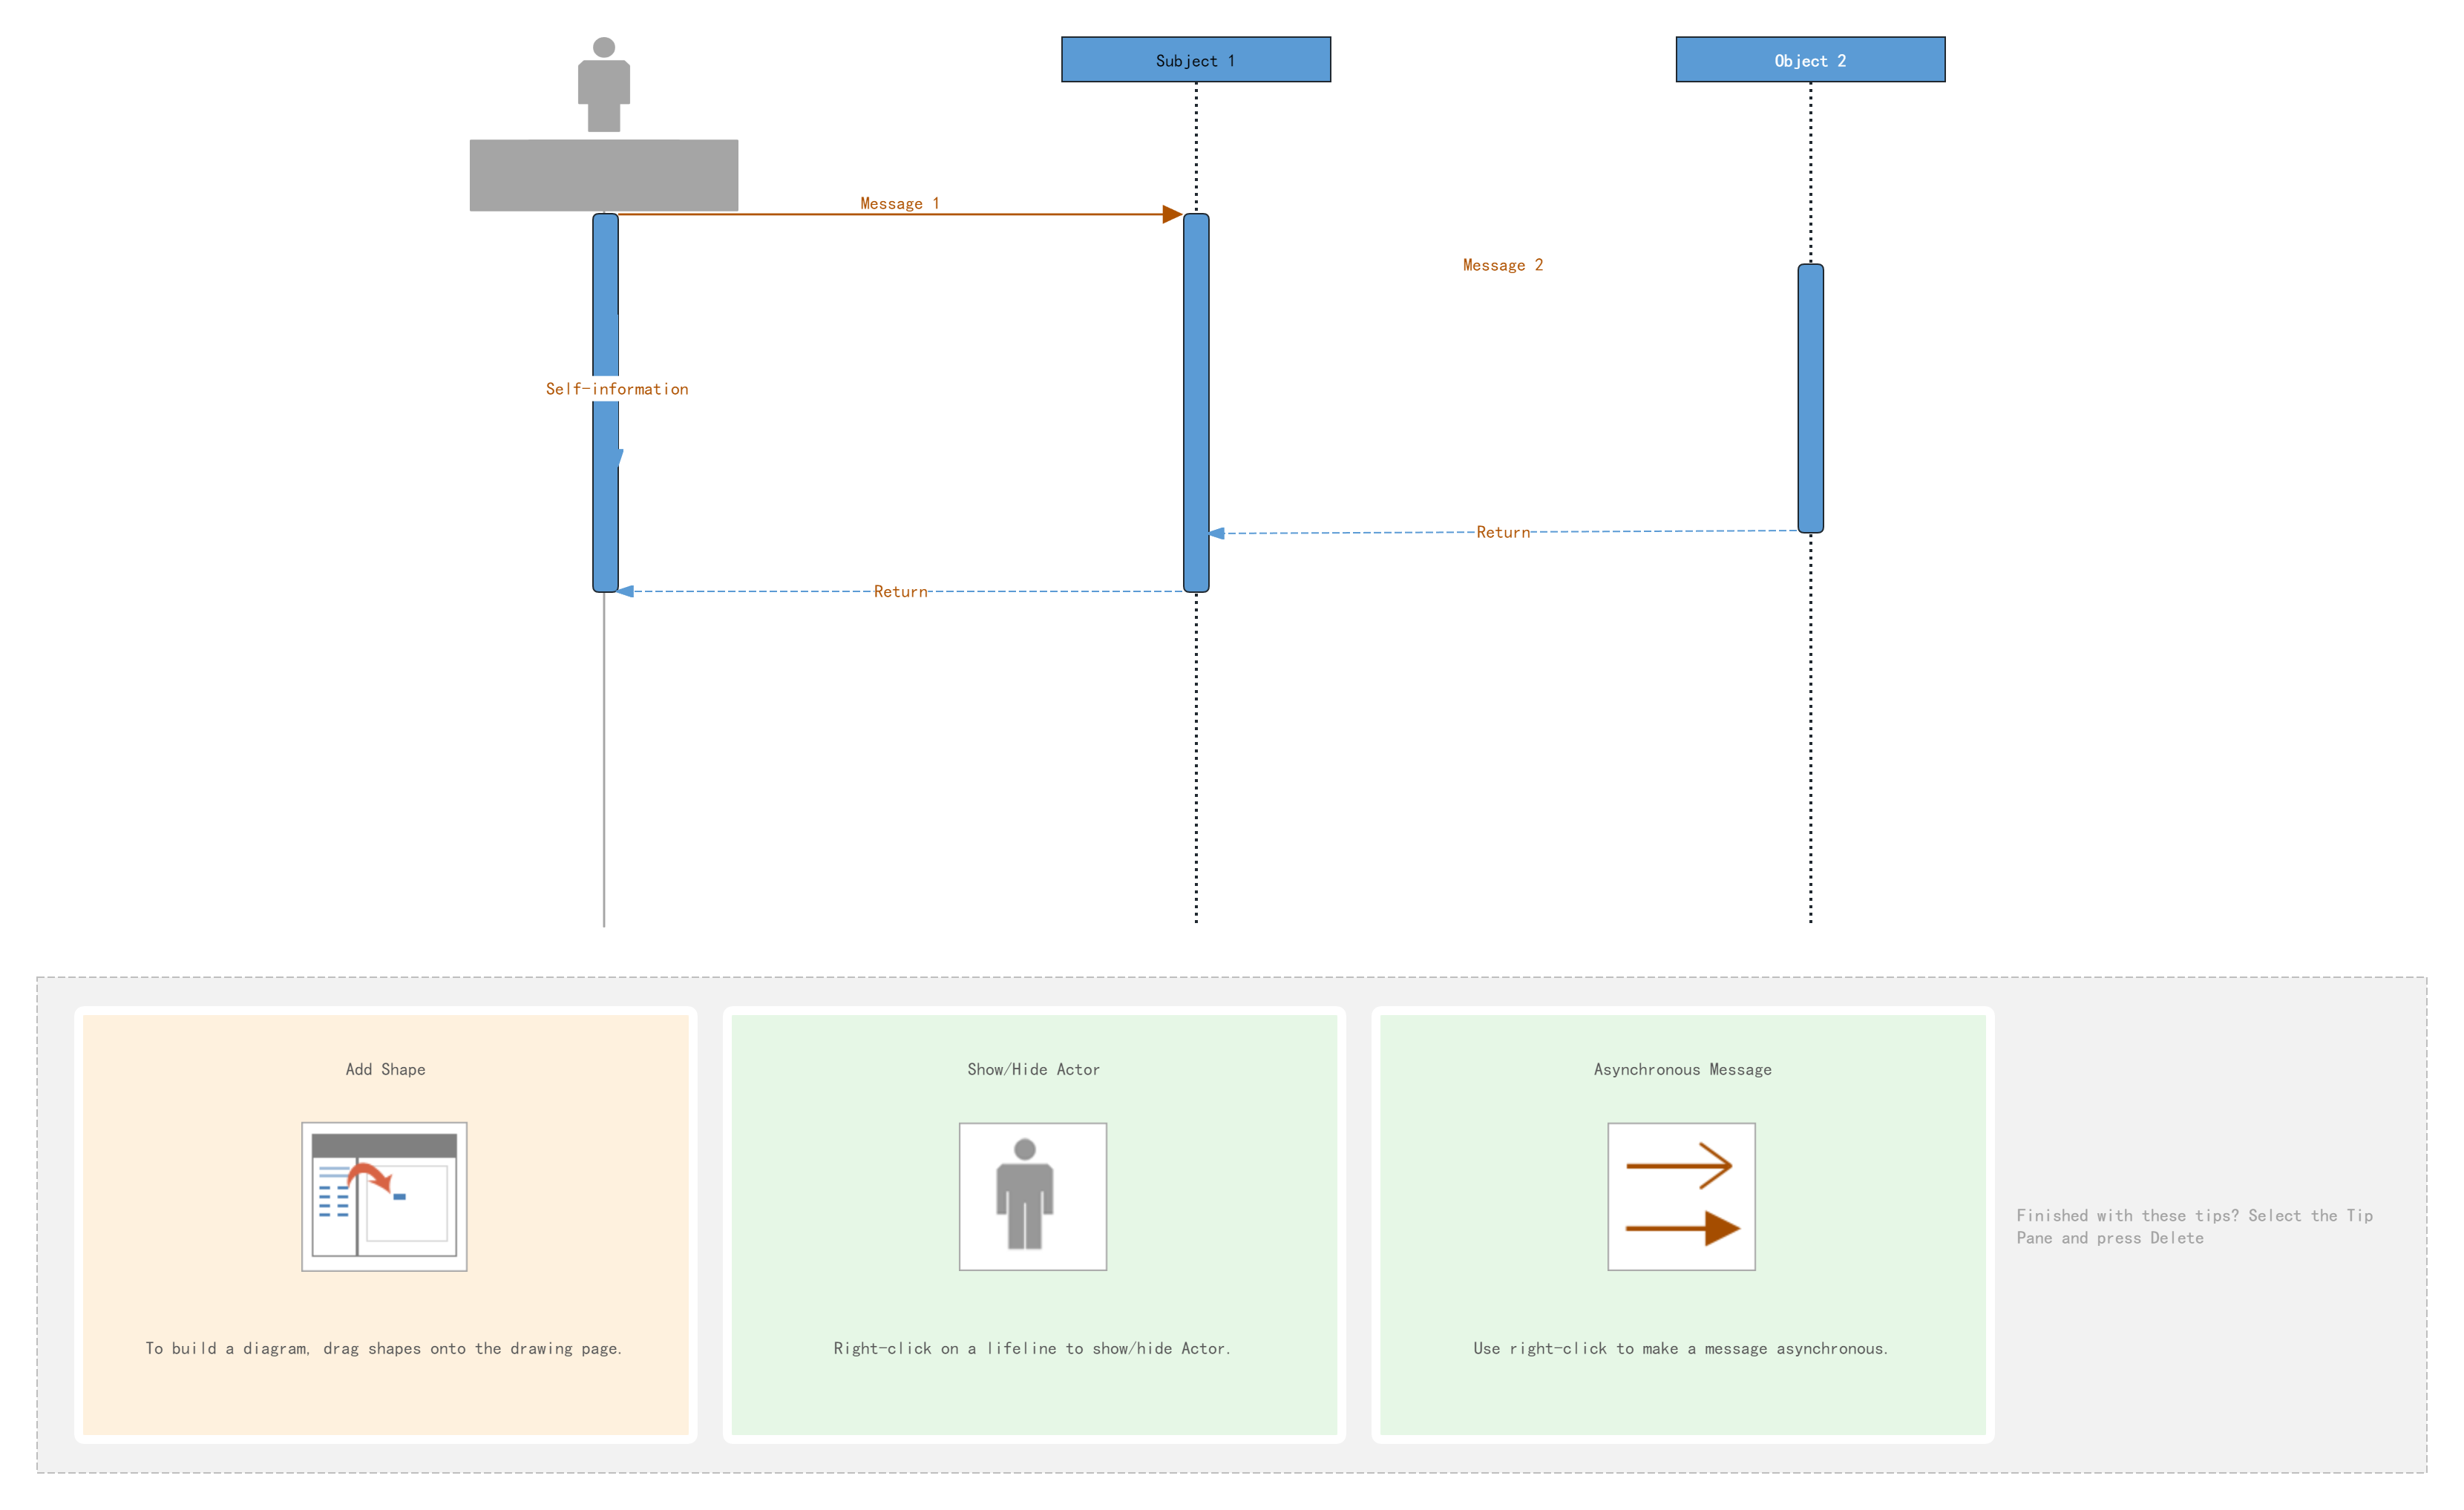
Sequence diagram,Also known as a sequence diagram or timing diagram, it is a UML (Unified Modeling Language) interaction diagram that is mainly used to describe the dynamic collaboration and time sequence of message passing between objects in a system. The following is a detailed introduction to the sequence diagram:
Definition and characteristics
Definition: A sequence diagram is a diagram that describes the interaction between objects in chronological order. It shows the order in which messages are sent between objects and how these messages affect the state of the objects.
Features:
Chronological order: Sequence diagrams emphasize the chronological order of interactions between objects, and are displayed through a horizontal timeline and a vertical object lifeline.
Dynamic collaboration: It shows how objects collaborate through message passing to accomplish specific tasks or functions.
Visual representation: Sequence diagrams graphically display the interaction process between objects, making system behavior more intuitive and easy to understand.
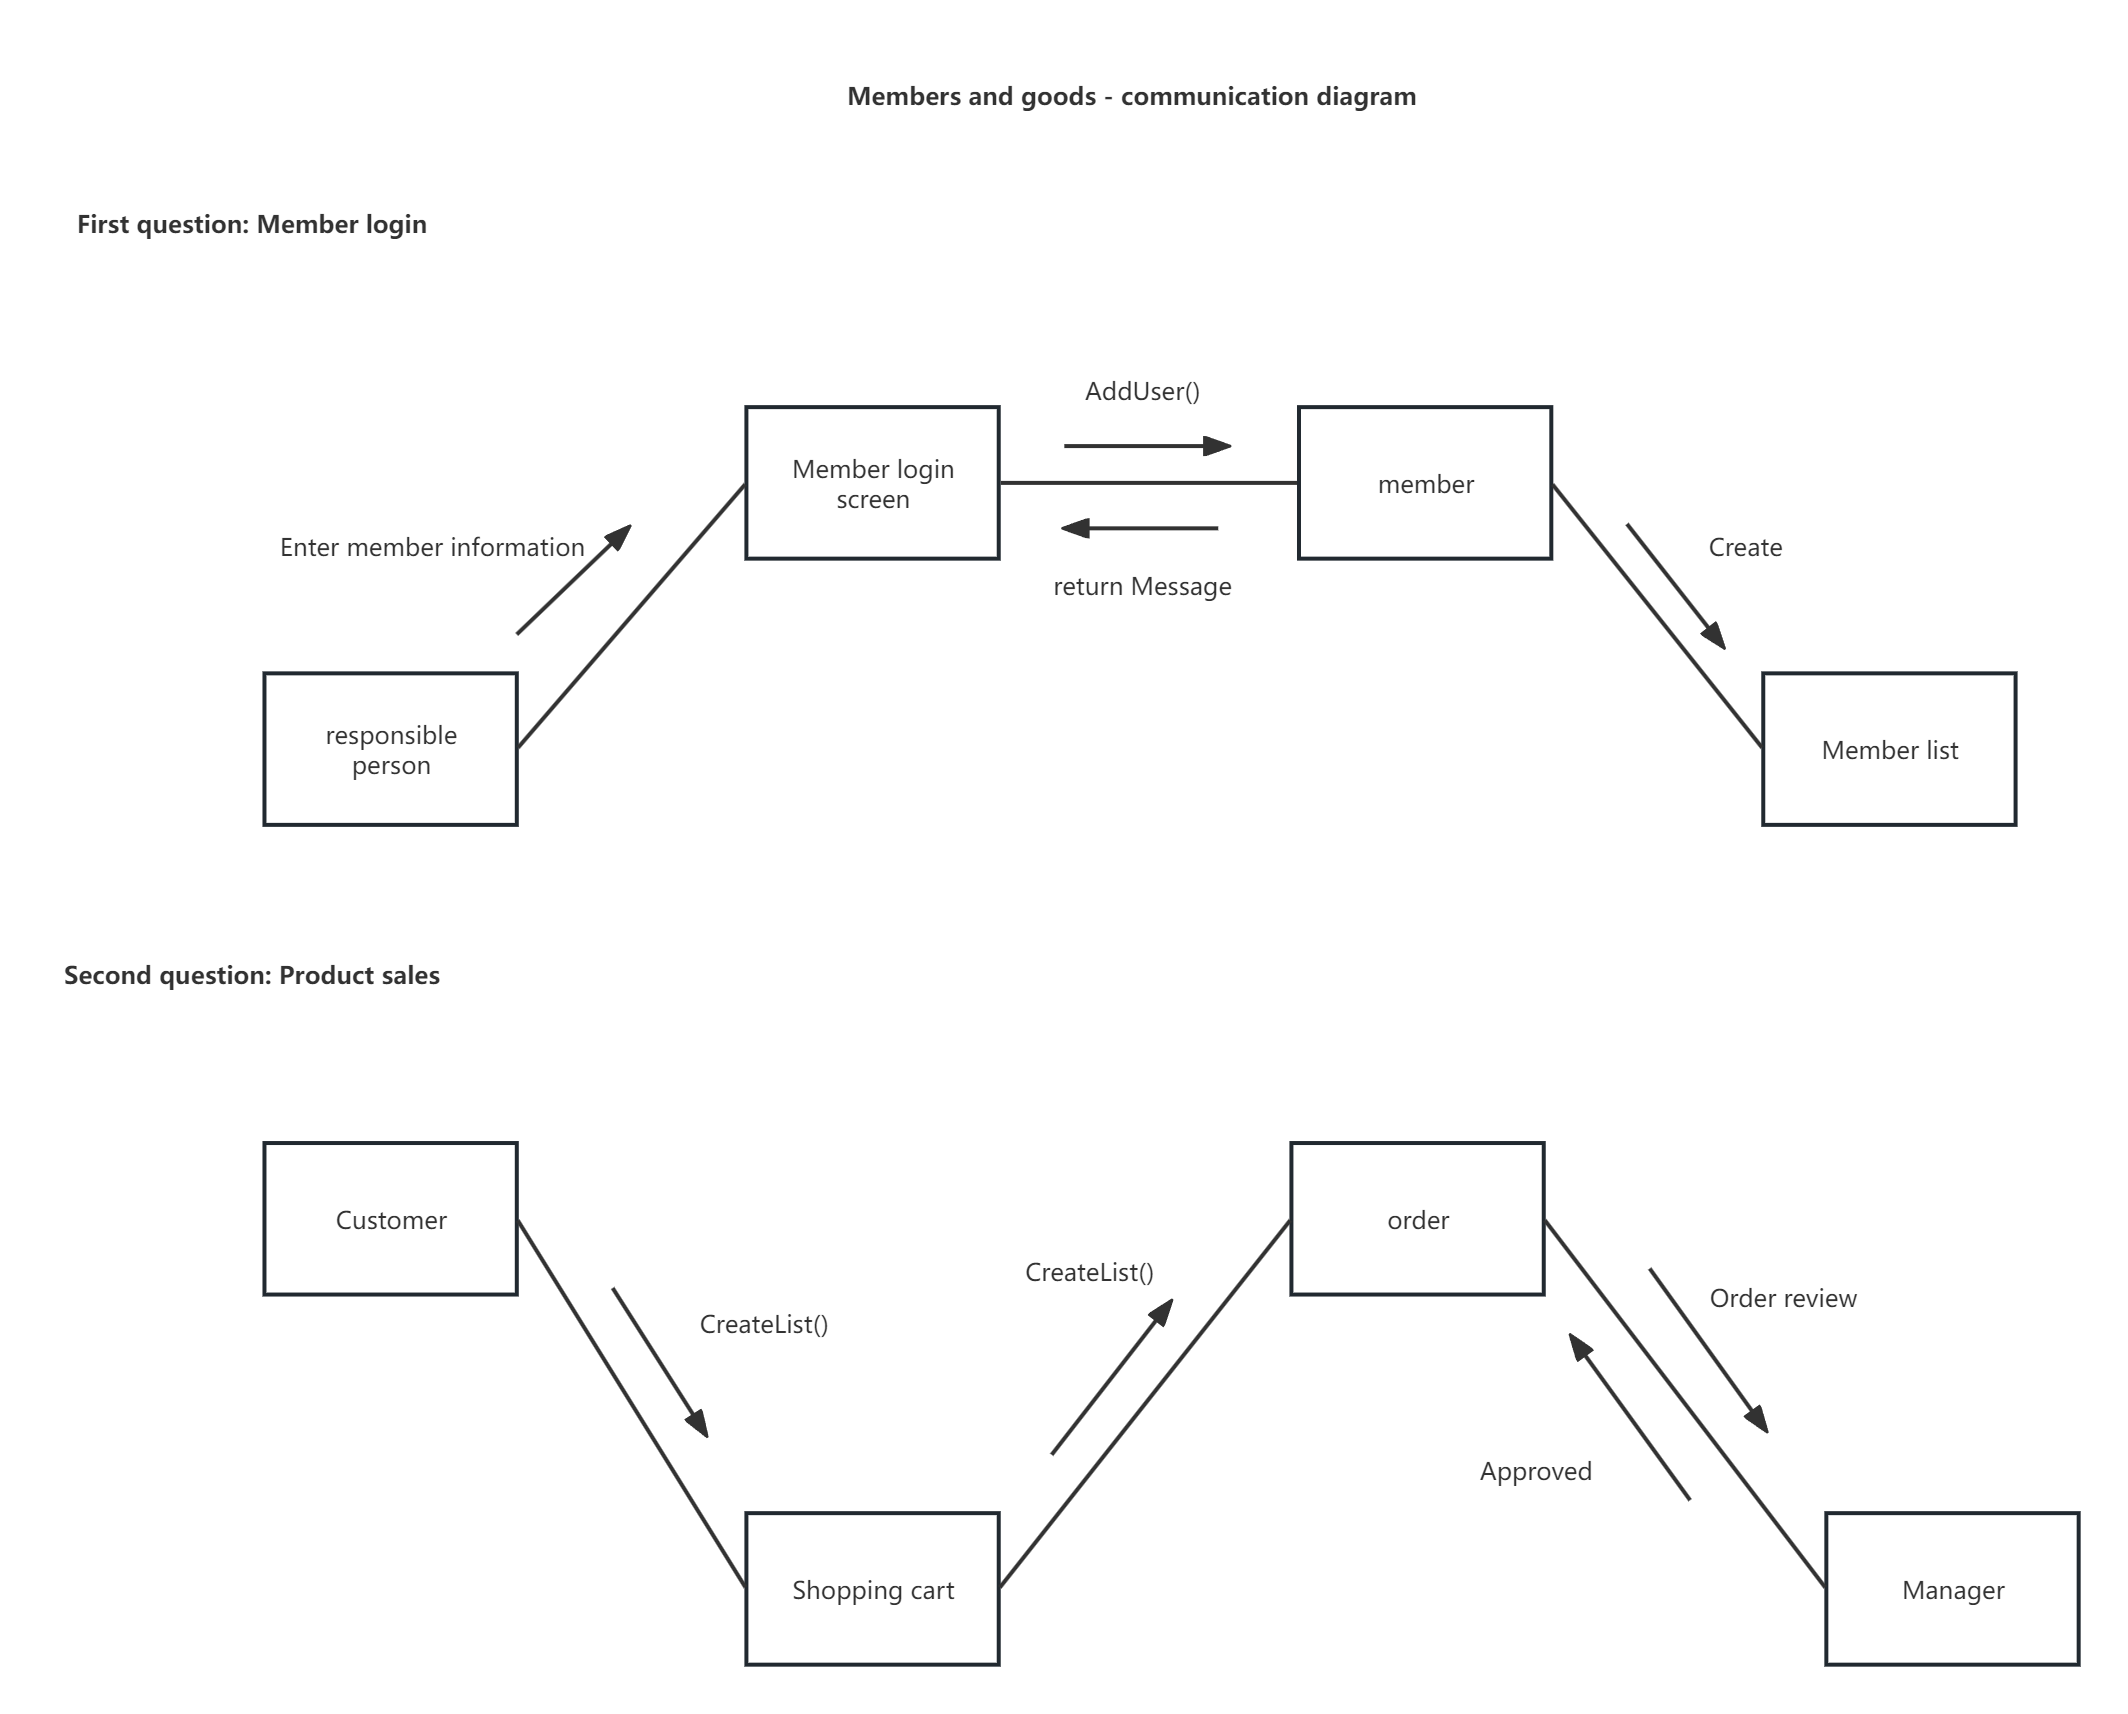
In UML 1, it is called Collaboration Diagram, which is an interaction diagram in UML (Unified Modeling Language) and is used to describe how a group of objects communicate with each other during a collaboration process. The following is a detailed explanation of the communication UML diagram:
Definition and characteristics
Definition: A communication diagram shows how multiple objects communicate with each other while working together to achieve a common goal. It displays the objects involved in the interaction through links between objects and messages sent.
Features:
Emphasize the roles that objects play in interactions and the relationships between them.
Focuses on displaying the spatial organization of objects rather than the temporal order.
The interactive information between objects is connected and transmitted through links and messages.
Class Diagram is mainly used to describe the collection of classes in the system, the internal structure of the class (such as attributes and methods), and the relationship between the classes. Class diagram is the main component of object-oriented modeling and is widely used in the system analysis and design phases of software engineering. The following is a detailed explanation of class diagram:
Definition and characteristics
Definition: A class diagram is a diagram used to represent the static structure of classes in a system, including classes, interfaces, and the relationships between them.
Features:
Emphasize the static structure of the class and do not display temporary information.
Describe the class's attributes (fields), methods (operations), and the relationships between classes (such as association, aggregation, composition, inheritance, etc.).
It is an important model basis for system coding and testing.

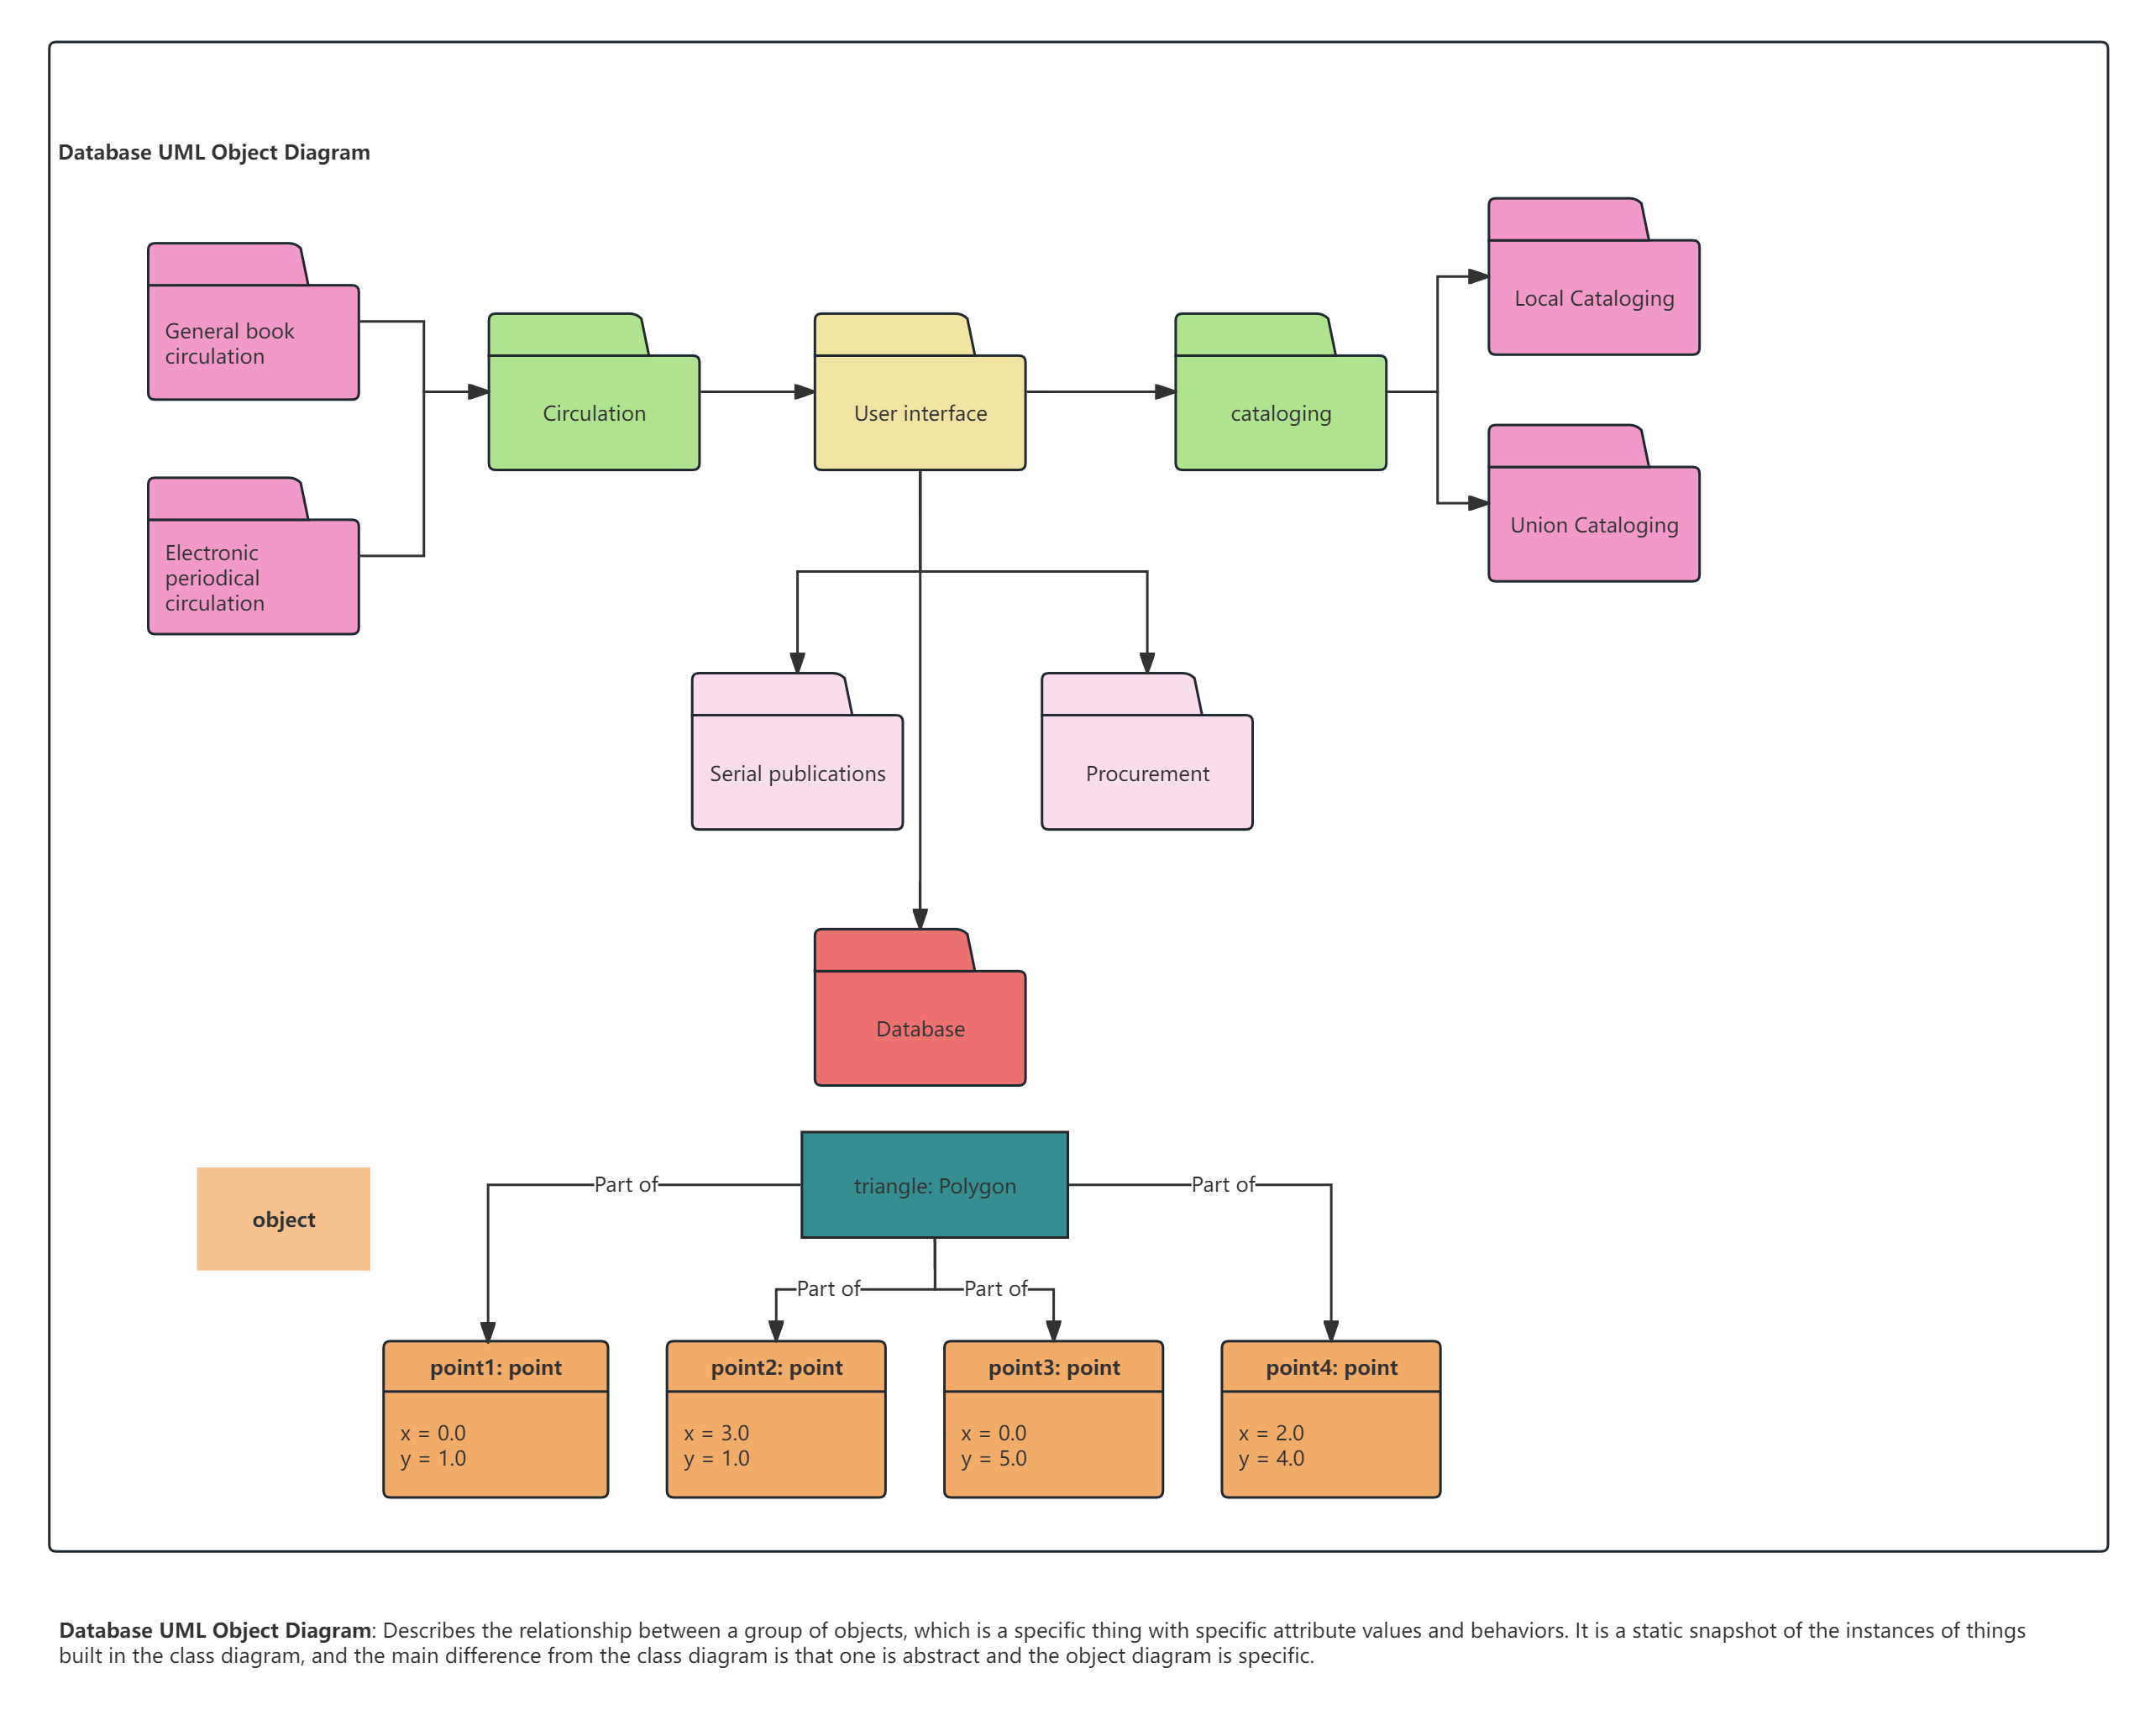
It is mainly used to describe the specific situation of the system at a specific moment, especially the objects and their relationships. The following is a detailed explanation of the object diagram:
Definition and characteristics
Definition: An object diagram shows the relationship between objects at a certain moment, reflecting the static process of the system. It is an instance of a class diagram, showing multiple object instances of a class and the association, combination and other relationships between these instances.
Features:
Emphasizes the state of the system at a certain moment, rather than the process or behavior.
Uses the same symbols and relationships as a class diagram, but shows specific instances of a class.
Since objects have a life cycle, object graphs can only exist in a certain period of time in the system.
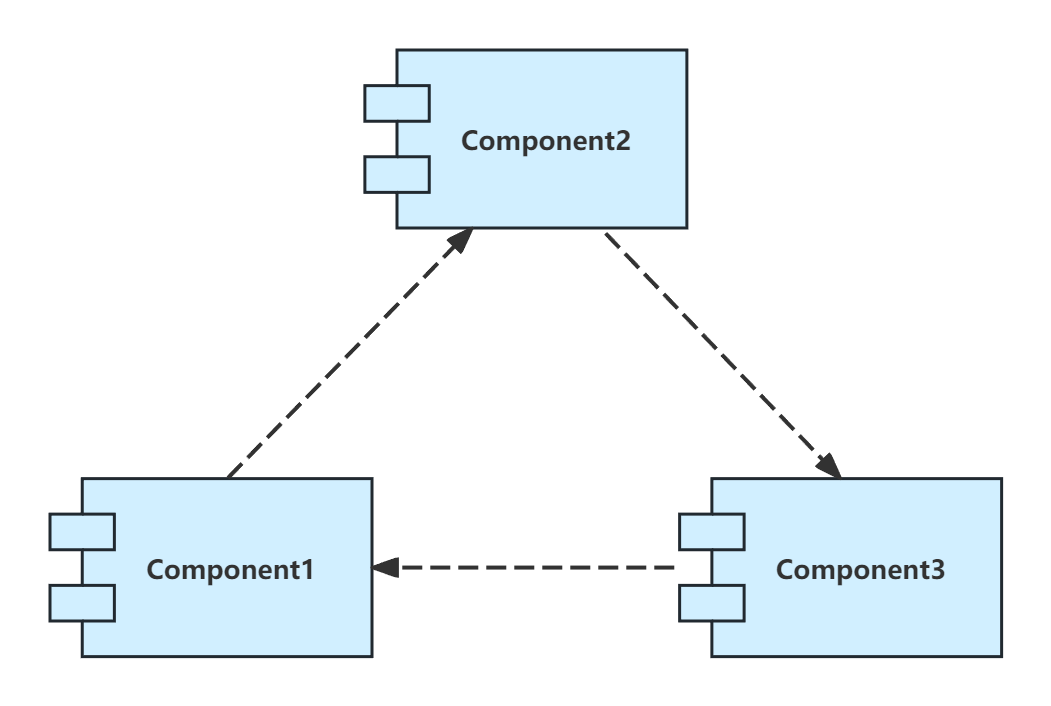
A component diagram is also called a component diagram. It is used to show the physical view of the components of a system and their relationships. It describes the static structure of the components in the system, including components, interfaces, and their dependencies and implementation relationships.
It is used to describe the internal structure of a part of the system (i.e., the "composite structure") and the interaction points between this part and other parts of the system. The following is a detailed explanation of the composite structure diagram:
Definition and characteristics
Definition: A composite structure diagram is a UML structure diagram that represents the internal structure of an object, which is composed of a group of small objects. It focuses on the internal components of the object and their relationships.
Features:
The scope of the lock is within the object, not within the entire system or business system.
It emphasizes the internal components of an object and their collaborative relationships, which is different from the equality of objects in general business systems.
It is a static diagram that shows the static structure of the system in a certain aspect.
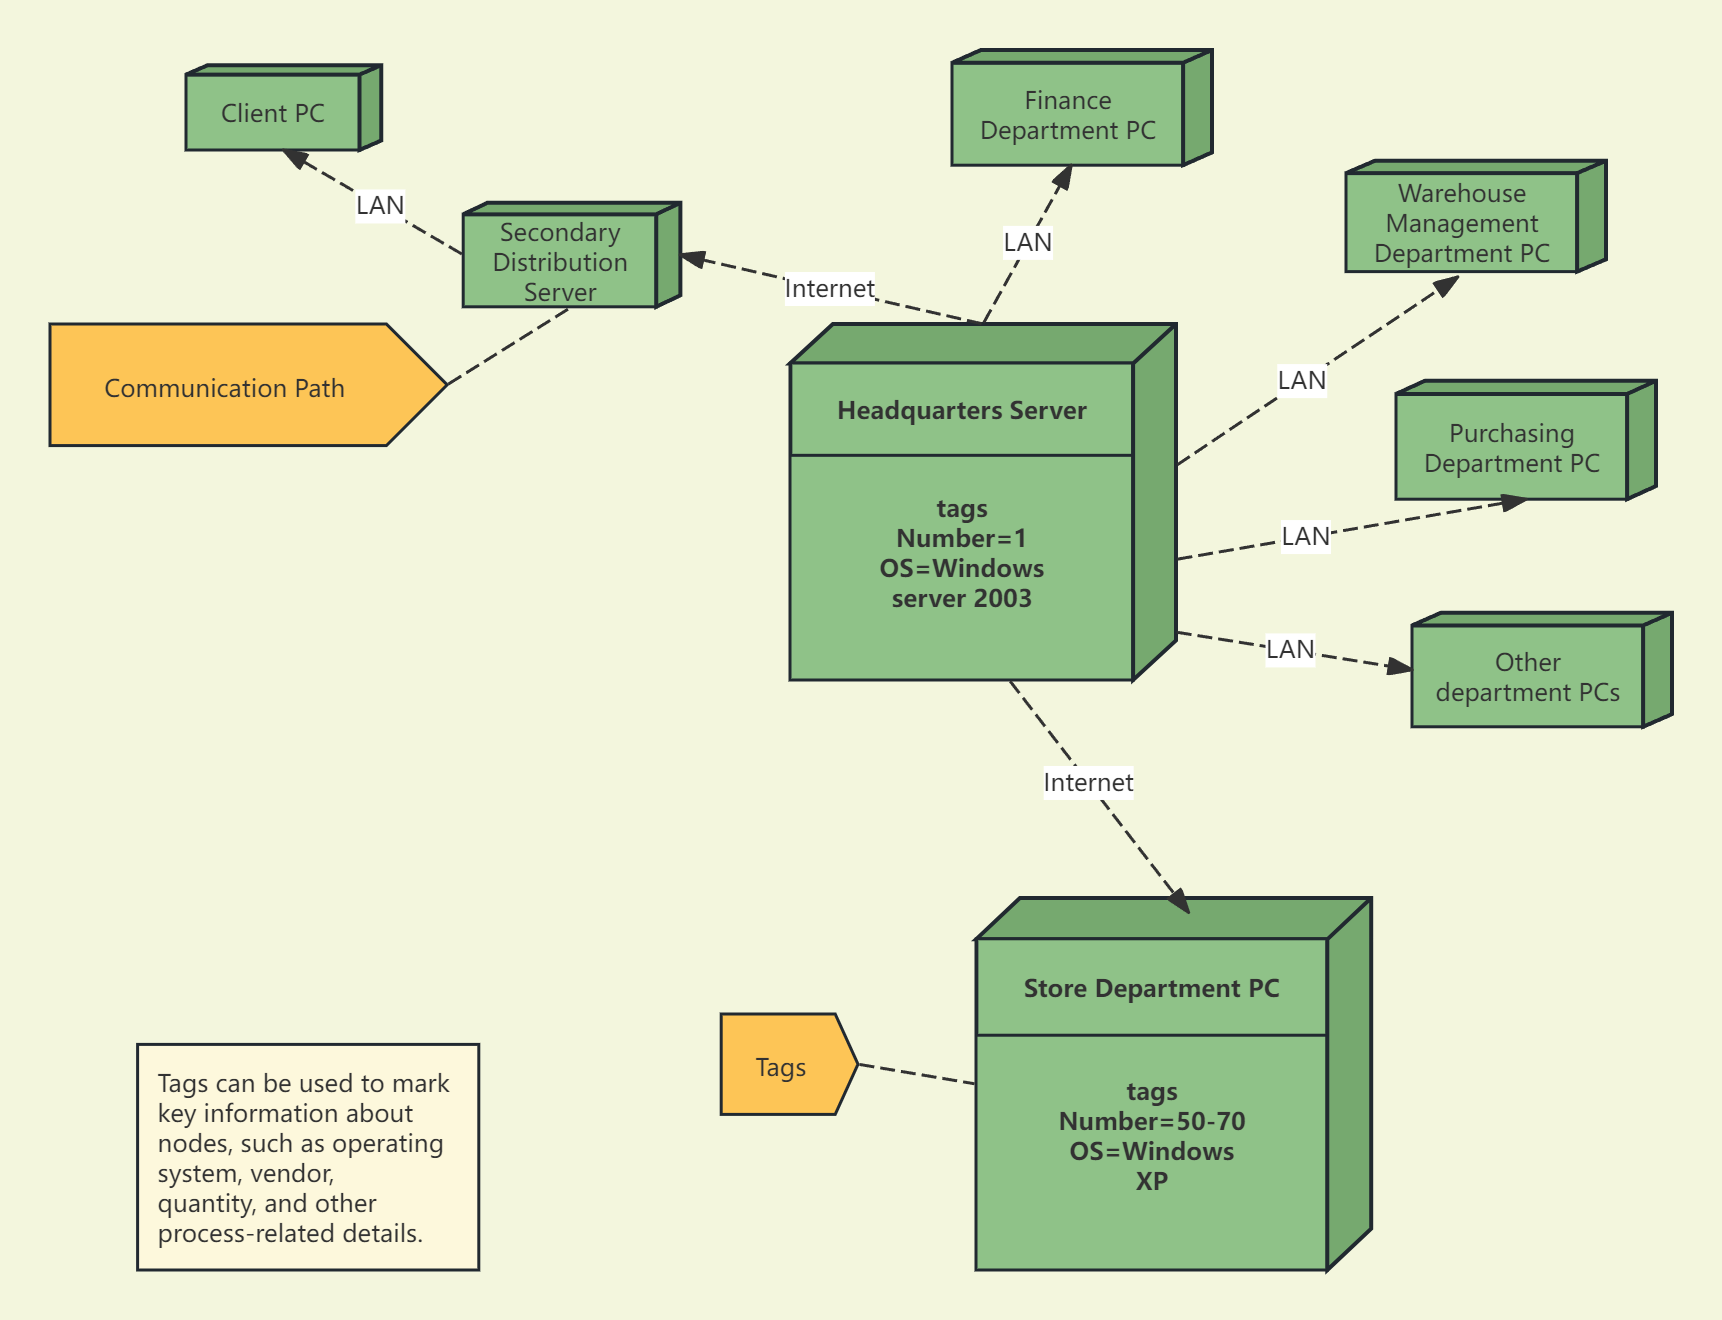
Deployment Diagram also known as an implementation diagram or configuration diagram, it is a static diagram in UML (Unified Modeling Language) that is used to show the physical architecture of software and hardware in a system. It describes the physical topology of the hardware in the system and the software executed on this structure. Through the deployment diagram, you can understand the physical relationship between software and hardware components and the distribution of components on processing nodes. The following is a detailed explanation of the deployment diagram:
Definition and characteristics
Definition: A deployment diagram is a graphical representation used to show the physical architecture of the software and hardware in a system.
Features:
Emphasizes the physical distribution and connectivity of hardware and software components.
Shows the structure of a runtime system, communicating how the hardware and software elements that make up the application are configured and deployed.
Often used to help understand distributed systems.
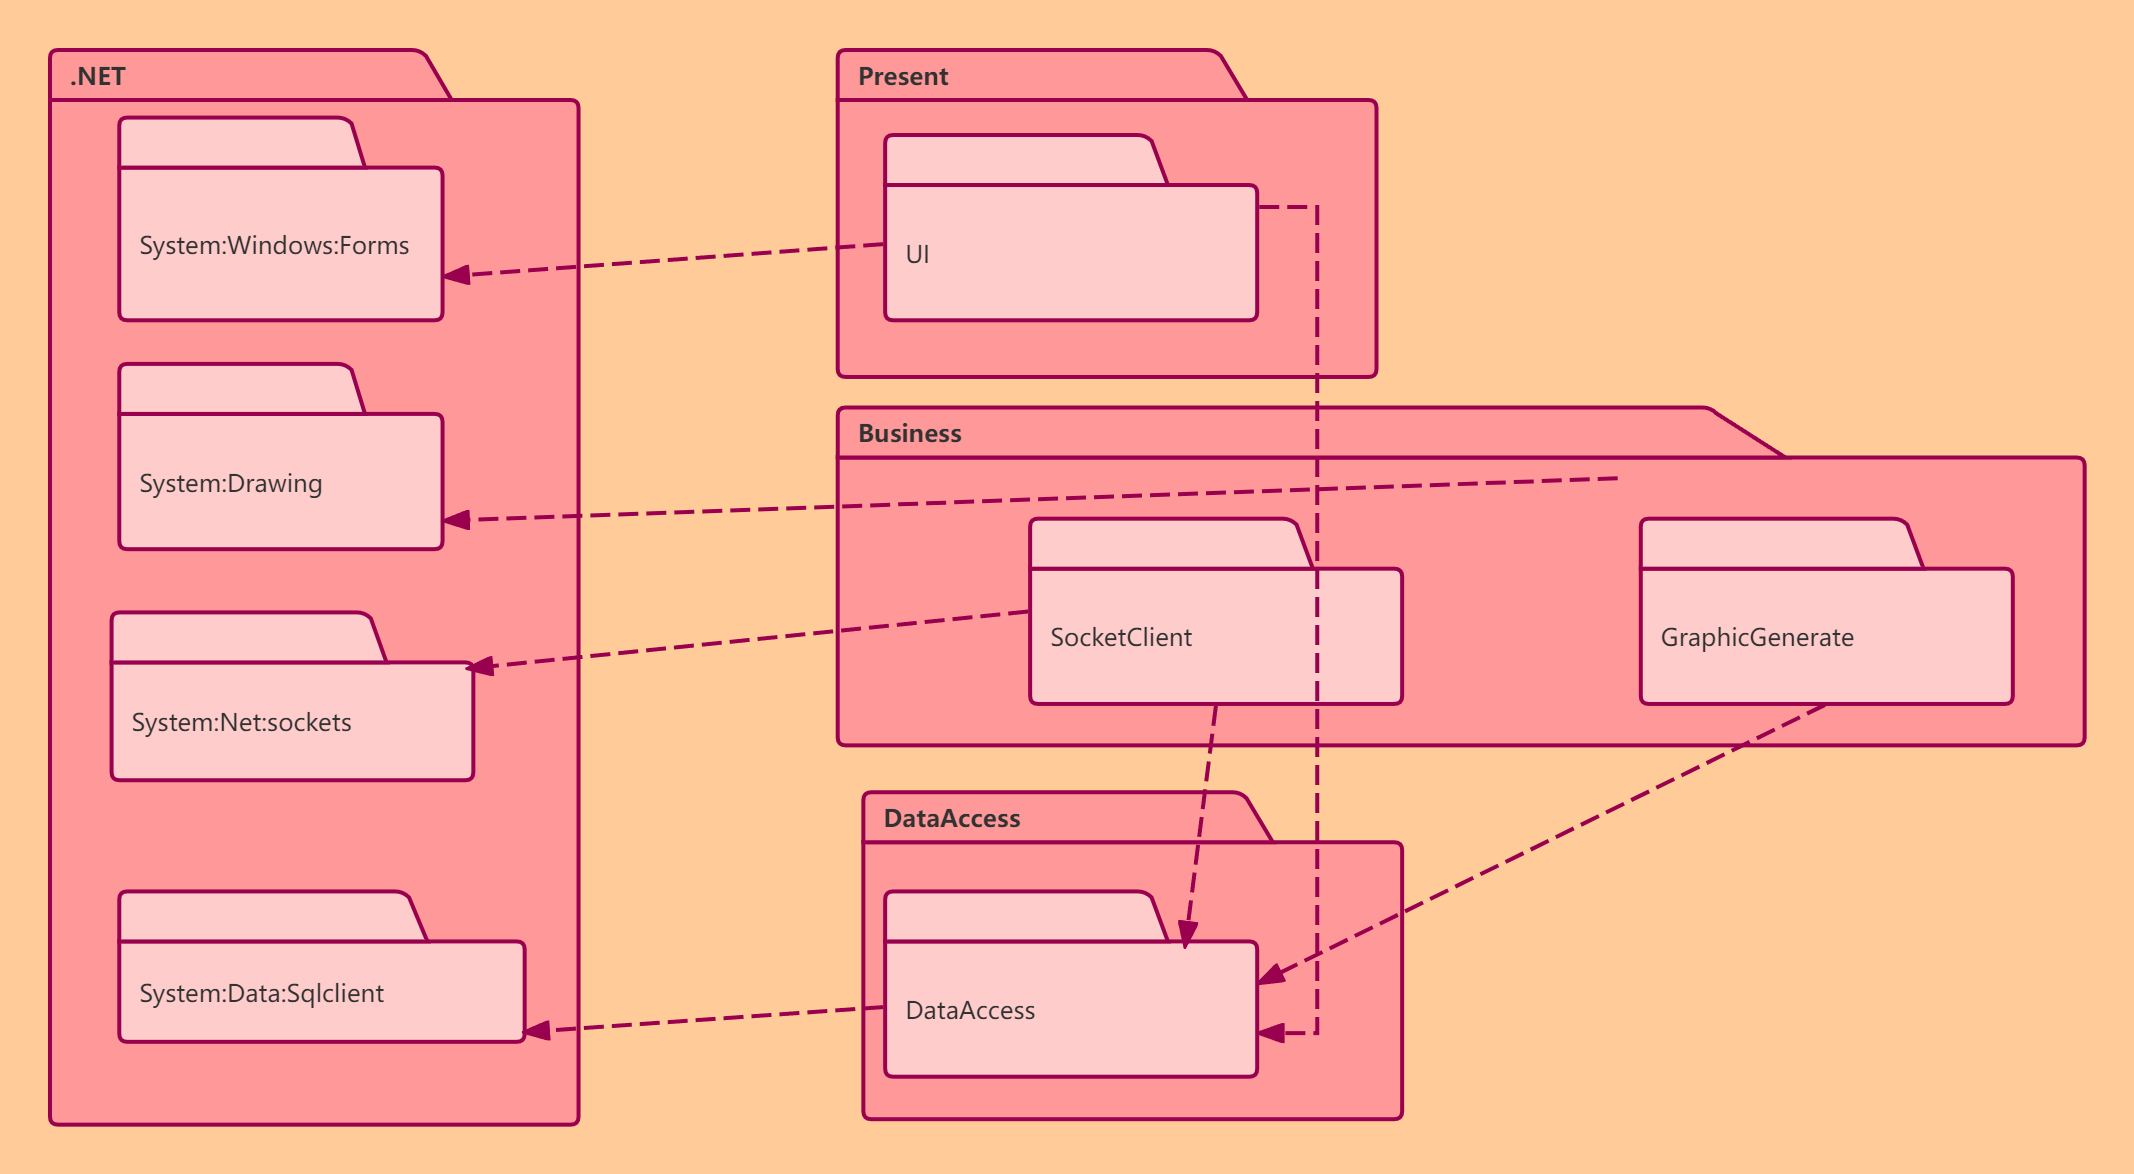
Package diagram is mainly used to describe the package in the system and the organizational structure of the elements contained in the package and the dependencies between them. The following is a detailed explanation of the package diagram:
Definition and characteristics
Definition: A package diagram is a combination of model elements represented by a folder-like symbol in UML, which is used to describe the organization of packages and contained elements in a model.
Features:
Emphasize the organizational structure and hierarchical relationship of packages.
Shows dependencies between packages.
Can contain various types of UML elements, such as classes, interfaces, use cases, etc.
Also known as a section view, it is an internal structure diagram that shows the relevant graphics in a certain section direction. Section views are generally used in engineering construction drawings and mechanical parts design to supplement and improve design documents. They are detailed designs in engineering construction drawings and mechanical parts design, and are used to guide engineering construction operations and mechanical processing. In addition, section views are also used in biological research, meteorological analysis and other fields. The following is a detailed explanation of section views:
Definition and characteristics
Definition: A section view is an orthographic projection of the remaining part onto the projection plane, which is made by imagining that an object is cut in half with a cutting plane and the part between the observer and the cutting plane is removed.
Features:
It can intuitively display the internal structure and construction form of objects.
Clearly express design ideas and intentions to facilitate construction personnel to understand and implement.
When drawing, the position and direction of the cutting plane need to be selected according to the specific situation to ensure that the internal features of the object can be fully displayed.
Improve communication efficiency: UML diagrams display the structure and behavior of the system in a visual way, so that developers can better communicate and understand the design and functions of the system. Reduce development risks: Before software development, the entire software design can be modeled and verified through UML diagrams, which can detect potential problems and risks early, thereby reducing uncertainty in the development process. Support object-oriented development: UML diagrams support object-oriented design and development methods, including concepts such as classes, objects, interfaces, inheritance, and associations, allowing developers to describe and build software systems more naturally.
Learning UML diagrams requires mastering their basic concepts and symbol specifications, and deepening understanding and application through practice. It is recommended that beginners start learning from basic UML diagrams such as class diagrams and use case diagrams, and gradually master more complex behavioral diagrams. At the same time, applying UML diagrams in conjunction with specific software development projects can better understand their role and value in actual work.
As a powerful modeling tool, UML diagram plays an important role in the software development process. Mastering UML diagram can not only improve development efficiency and quality, but also promote communication and collaboration among developers. Through the introduction of this article, readers can understand the main classification and use of UML diagram in a short time, laying a foundation for subsequent learning and practice . It is a software commonly used to draw UML diagrams. It has built-in professional UML graphic symbol elements and arrow lines, supports custom adjustment of styles and colors, and can be shared with others through links. After completion, it can be freely exported to image or PDF file format. It is very easy to operate and no pressure for novices to use.
ProcessOn is a software commonly used to draw UML diagrams. It has built-in professional UML graphic symbol elements and arrow lines, supports custom adjustment of styles and colors, and can be shared with others through links. Once completed, it can be freely exported into pictures or PDFs. The file format is very easy to operate, and there is no pressure for novices to use it.