In today's data-driven era, decision tree diagrams, as an intuitive and powerful analytical tool, are gradually becoming a powerful assistant for decision makers in all walks of life. This article will introduce the concept, composition, drawing tutorials , examples , etc. of decision tree diagrams in an easy-to-understand way to help readers master this powerful tool and improve decision-making efficiency and quality.
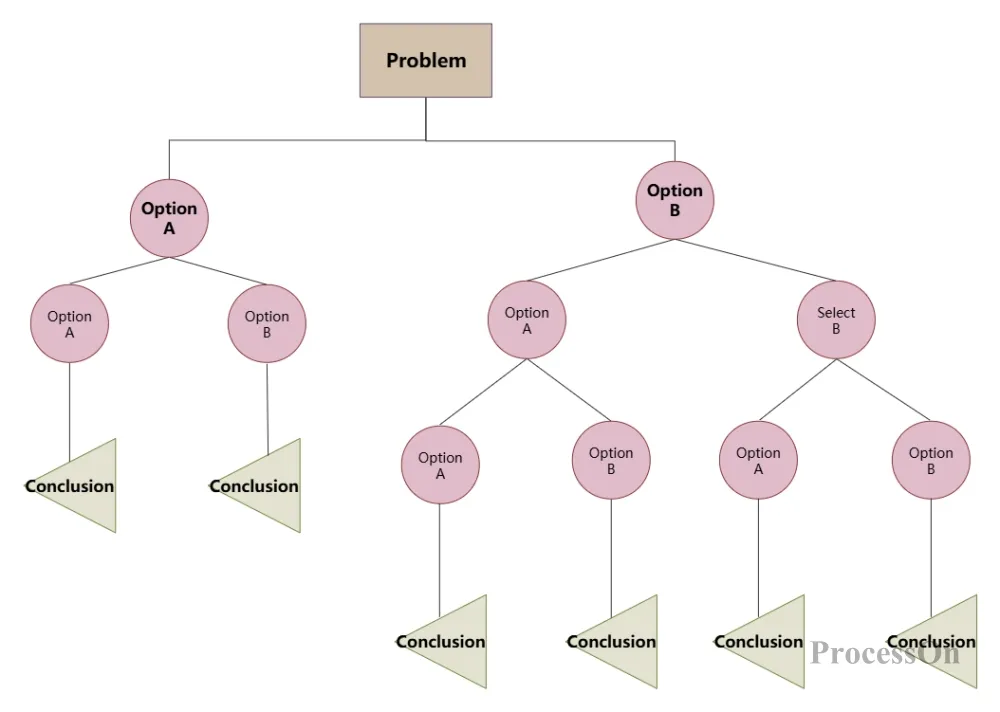
The decision tree diagram is a graphical tool for evaluating project risks and conducting decision analysis based on the probability of various situations. It uses branch nodes to represent different decision paths, and leaf nodes represent various possible results or outputs. Each internal node (non-leaf node) represents a test condition or decision point. Depending on the value of the condition, the decision path will lead to different child nodes.
Use Now-Decision Tree Diagram Template
The decision tree diagram mainly consists of five parts:
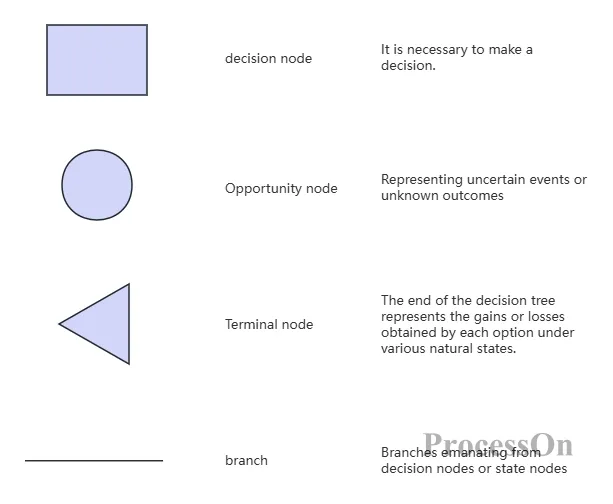
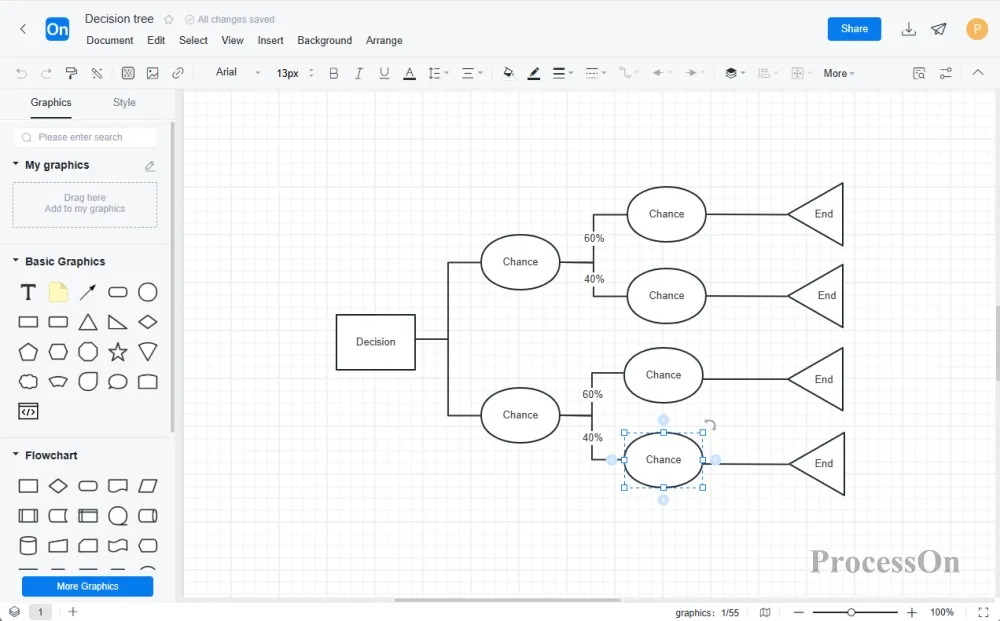
Decision node (tree root): usually represented by a square node. This is the starting point of the decision tree, indicating that a decision needs to be made . In multi-level decision making, there can also be multiple decision points in the middle of the decision tree.
Solution branches : Several branches are derived from the decision node, each of which represents a possible solution or decision path. These branches are called solution branches .
Chance nodes : Represented by circular nodes, they represent uncertain events or unknown results . By comparing the economic effects or states of each opportunity node, the best solution can be selected or the next action can be determined according to certain decision-making criteria.
Probability branch : The branch derived from the state node is called a probability branch . The number of probability branches indicates the number of possible natural states. The content and probability of occurrence of the state need to be noted on each branch.
Terminal node (leaf): Also called the end node , usually represented by a triangle node. This is the end point of the decision process, reflecting the final state or decision result under different conditions. These values are marked on the right side of the result node to evaluate the pros and cons of each solution.
Business decision-making: Companies can use decision tree diagrams to analyze market strategies, product pricing, inventory management and other issues to help management make more scientific decisions.
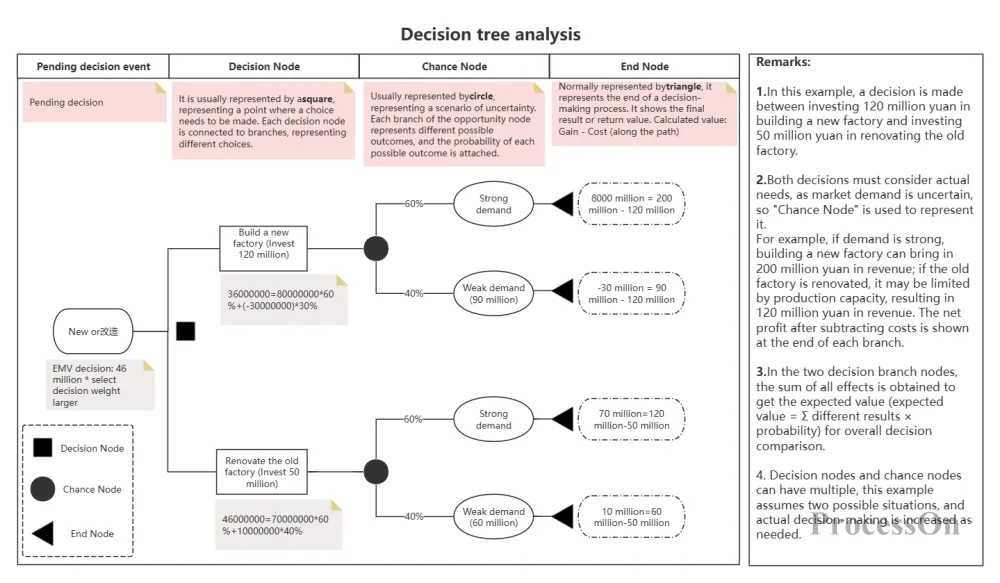
Use Now - Decision Tree Analysis Example
Medical diagnosis: By building a decision tree, doctors can quickly determine the possible type of disease based on the patient's symptoms and improve diagnostic efficiency.
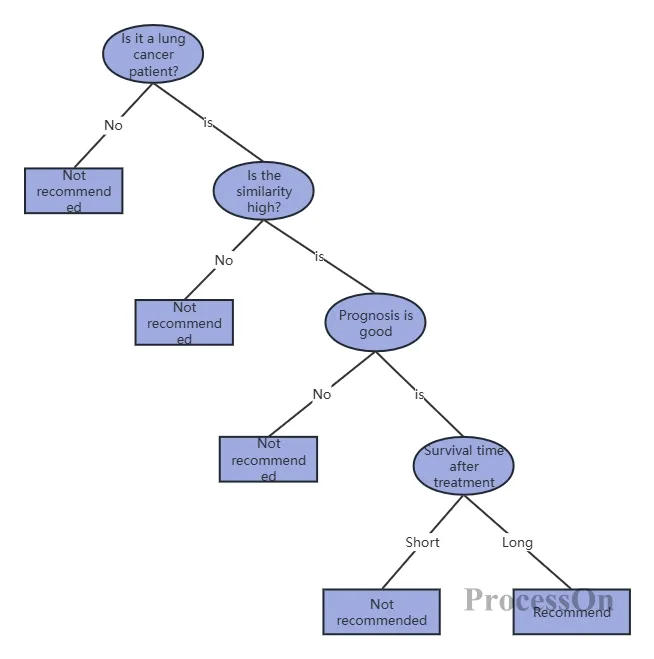
Use Now - Treatment Decision Tree
Financial risk assessment: Banks and financial institutions use decision trees to assess the credit risk of loan applicants and determine loan amounts and interest rates.
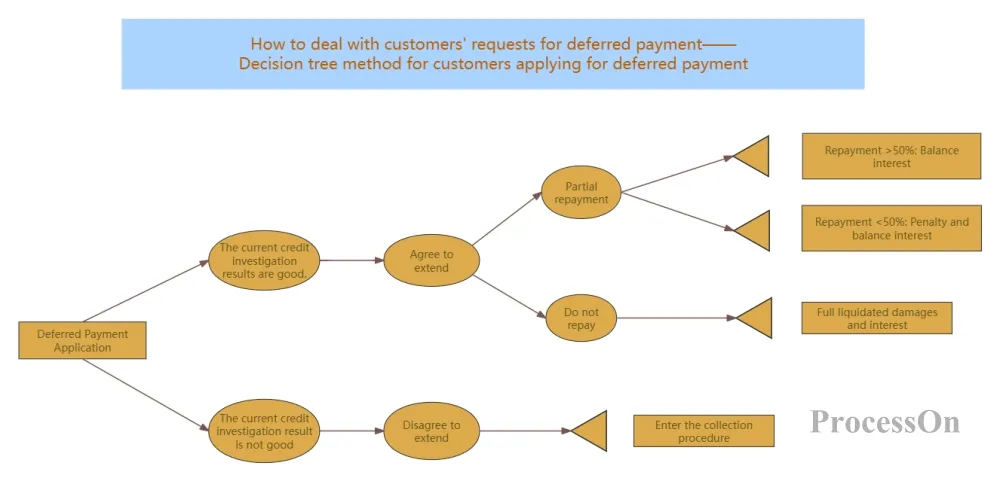
Use Now - Decision Tree for Applying for Deferred Payment
Step 1: Identify goals and problems
First, identify the specific problem or decision goal you want to solve. This will serve as the root node of the decision tree.
Step 2: Collect data
Collect all possible variables and conditions related to the decision, including historical data, expert opinions, etc.
Step 3: Select feature variables
The characteristic variables that have the greatest impact on the decision are selected from the collected data and used as the internal nodes of the decision tree.
Step 4: Build a decision tree
Starting from the root node, draw branches according to the first feature variable.
Each branch represents a possible value of the feature variable, and child nodes and branches are drawn on each branch according to the next important feature variable until all possible decision paths are covered.
Finally, the decision results or outputs are labeled on each leaf node.
Step 5: Verification and optimization
Use cross-validation, pruning and other methods to verify the accuracy of the decision tree and avoid overfitting.
According to the verification results, the selection of feature variables, division of branches, etc. are adjusted to optimize the decision tree structure.
There are many tools for drawing decision tree diagrams, and it is very important to choose a tool that suits your needs. Common tools include Visio, Word, ProcessOn, etc. Users can choose the appropriate decision tree diagram maker according to their needs. Here we mainly explain how to use Word and ProcessOn to make a decision tree diagram.
1. First, open a blank document in Word.
2. Switch the tab to "Insert", click on the shape, and select the graphic symbol of the flowchart . First, draw a box on the canvas to represent the decision point, and then create a connection line to describe each possible solution.
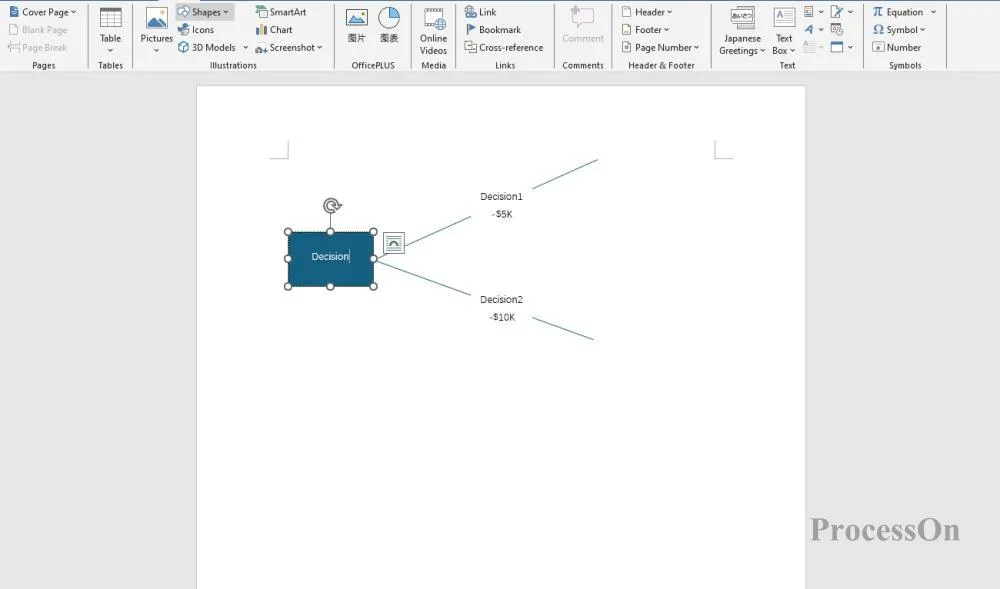
3. Add chance nodes (circles) or continue to add decision nodes (boxes) based on actual conditions. Mark possible solutions after decision nodes, and draw branches and possible results after chance nodes.
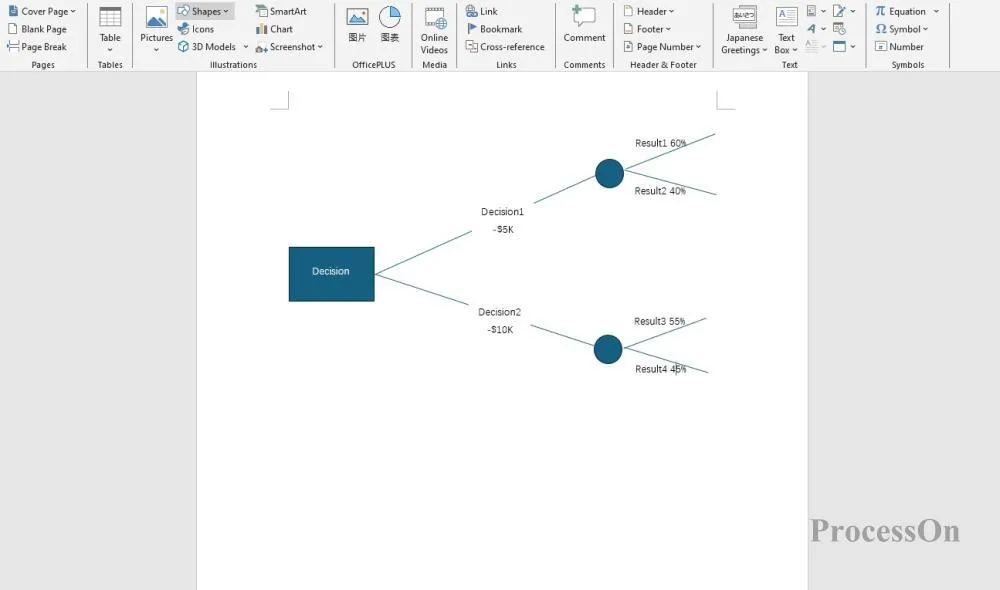
4. Until all possible decision paths are covered , label the output results or values at each terminal node.
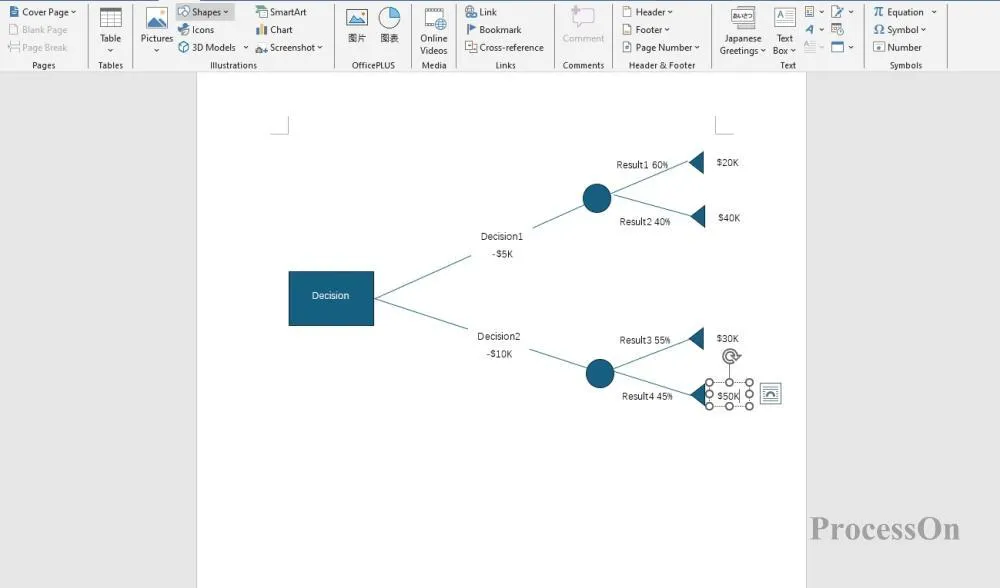
1. Open ProcessOn official website, enter the personal file page, click New to create a flowchart
2. rectangular symbol in the graphic library on the left side of the flowchart maker to the canvas as a decision node , double-click the graphic to add text, and click the "+" on the graphic to create branches between graphics.
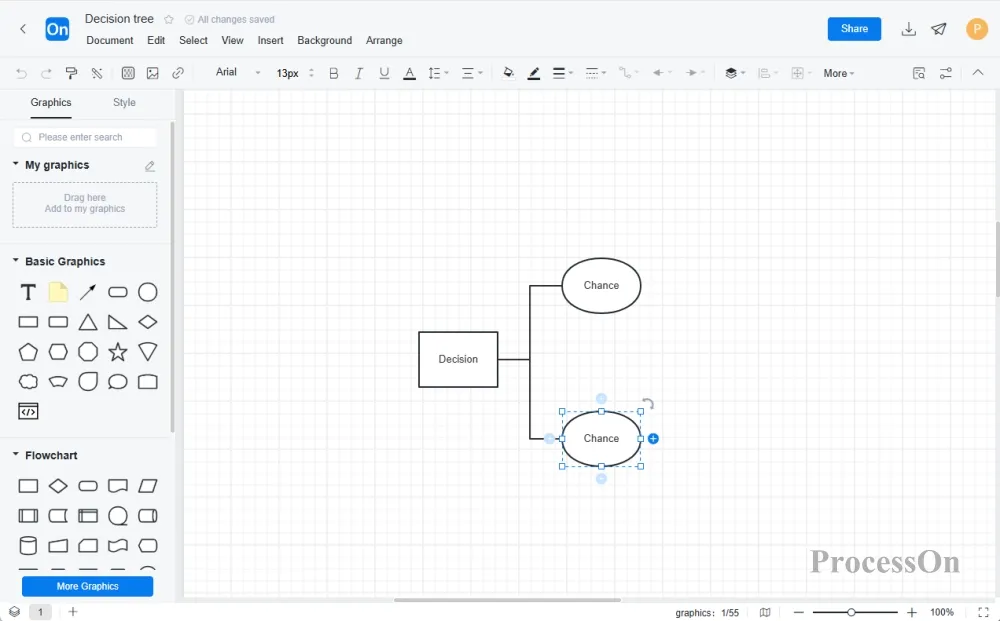
3. Supplement the decision tree with the following decision nodes, chance nodes, terminal nodes and branch elements.
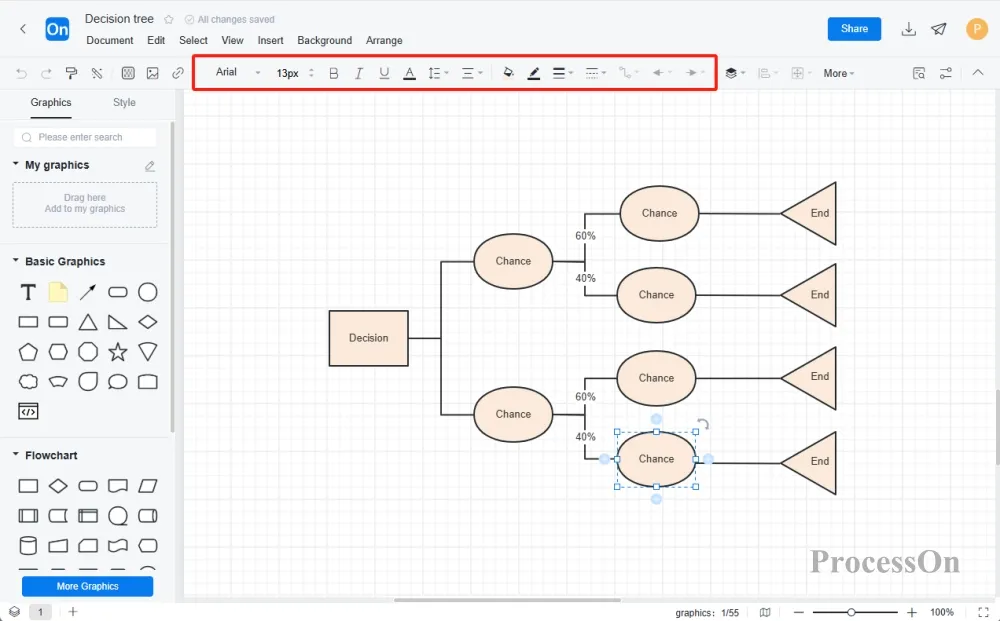
4. Select a node or branch, and use the top toolbar to set the text style and line style.
Decision trees and probability trees are both decision analysis tools. Probability trees are a method of making optimal decisions by representing the probabilities of possible decisions of decision objects as tree diagrams. The main differences between probability trees and decision tree diagrams are:
Construction complexity: Decision trees are relatively simple and are mainly based on known probabilities and profit and loss values; probability trees require accurate predictions of the probability of conditional occurrence and detailed evaluation of the resulting benefits.
Application scenarios: Decision trees are suitable for simple decision problems; probability trees are suitable for complex decision problems, especially when the decision process involves multiple uncertain factors and probability distributions.
Decision basis: Decision trees mainly rely on the decision maker's personal experience and judgment; probability trees provide decision makers with a more objective and quantitative basis for decision making by calculating expected values.
The decision tree algorithm is a common method in classification problems. It divides data into different subsets through a tree structure, and each subset corresponds to a category. In the classification task, the decision tree learns a mapping relationship from features to categories. Decision trees can be used in a variety of classification scenarios, such as:
Medical diagnosis: By analyzing the patient's symptoms, medical history and other characteristics, decision trees can help doctors diagnose diseases.
Credit assessment: Using characteristics such as a person’s credit record, income, and liabilities, a decision tree can predict a person’s credit rating.
Spam identification: By analyzing the email title, body, sender and other features, the decision tree can identify spam.
Although decision trees are mainly used for classification problems, they can also be used to solve regression problems by modifying the algorithm. In regression tasks, decision trees learn a mapping relationship from features to continuous values. For example, using the CART (Classification And Regression Tree) algorithm, decision trees can be used to predict continuous values such as house prices and stock prices.
The decision tree algorithm is also important in feature selection. In the process of building a decision tree, the algorithm will select the best features for division, which are usually the features that have the greatest impact on the classification or regression results. Therefore, through the decision tree algorithm, the importance of features can be evaluated, so as to perform feature selection.
Decision tree algorithms are the basis of ensemble learning methods such as random forests and gradient boosted trees. By combining multiple decision trees, the stability and generalization ability of the model can be improved. For example, random forests can reduce overfitting and improve the accuracy of the model by integrating multiple decision trees.
The above is the relevant content of decision tree diagram. As a powerful decision analysis tool, decision tree diagram can help us better understand complex problems through scientific algorithms and guide us to make more wise decisions.