Dependency diagram is a diagram used to represent the dependencies between components or modules in a system. These dependencies can be direct or indirect, and they reveal how system components are related and interact with each other. Through the dependency diagram , developers can intuitively see which components depend on other components and how these dependencies affect the overall structure and behavior of the system.
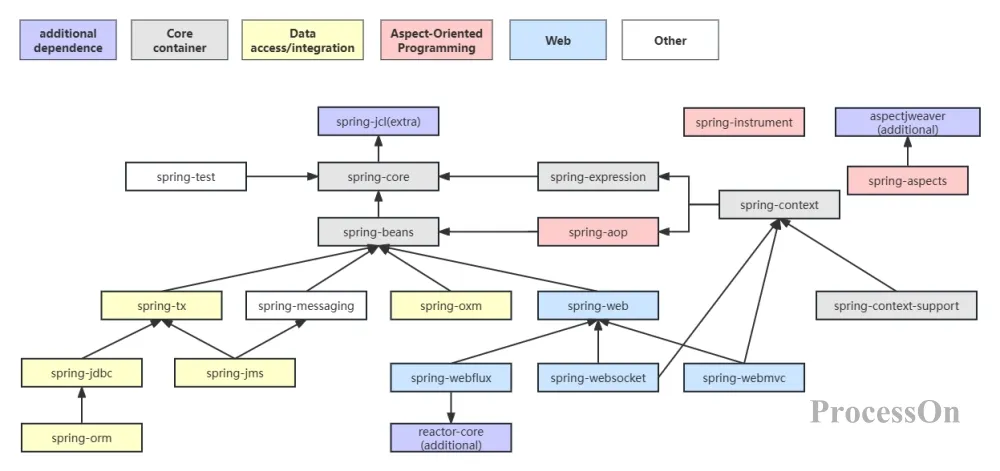
Spring5 module dependency graph
Dependency graphs have different classifications and uses in different fields. The main classifications are:
In UML (Unified Modeling Language), dependency diagrams are used to represent the dependency relationships between classes and interfaces. Such dependency relationships usually have the following characteristics:
Unidirectionality: A dependency is unidirectional, meaning that one class depends on the definition or implementation of another class.
Accidental and temporary: Dependencies are usually accidental and temporary, that is, changes in one class may affect another class, but this relationship is not long-term and stable.
Weak Relationship: A dependency relationship is a weaker relationship than an association relationship.
In UML, dependencies are usually represented by dashed arrows pointing to the dependent class.
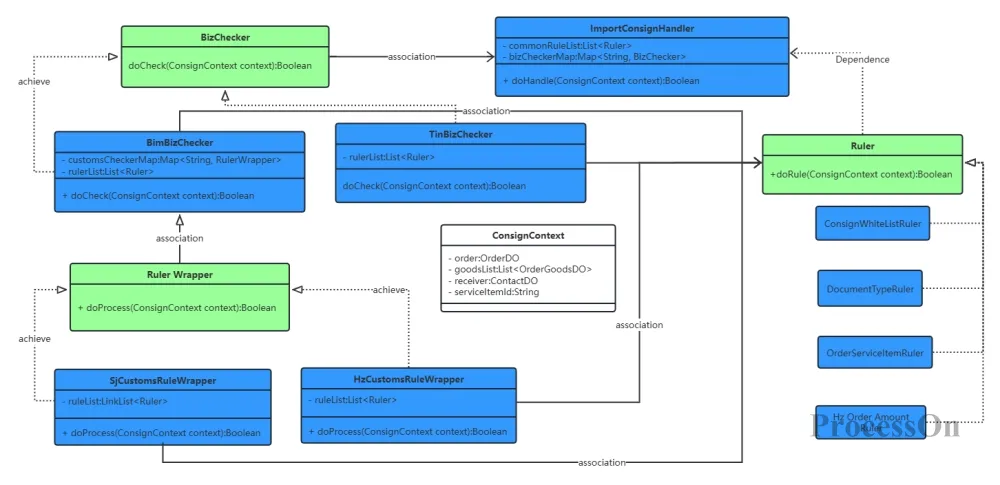
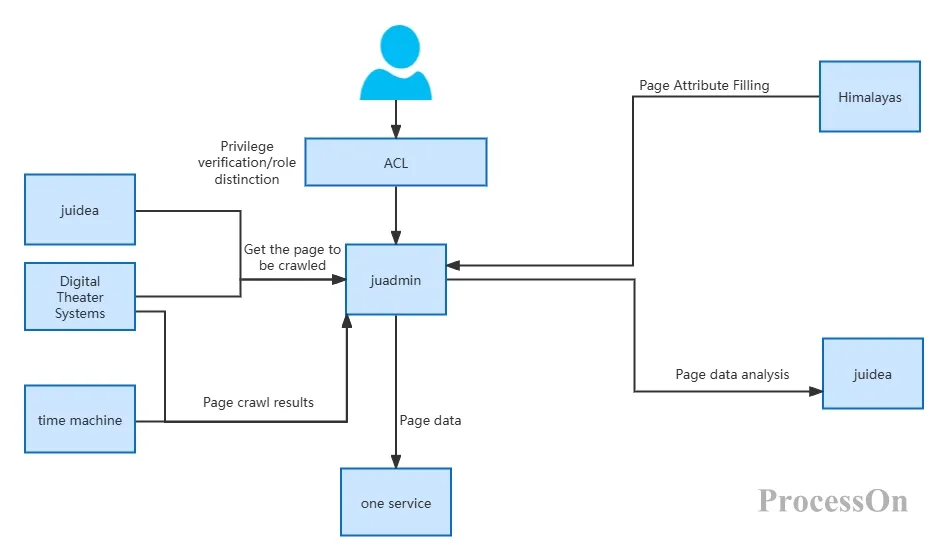
Shipping interface dependency graph
software development and system design , dependency graphs are often used to represent data dependencies and control dependencies between variables, functions, or statements in a program. Such dependency graphs help compilers perform code optimization, data flow analysis, control flow analysis, and other tasks.
Data dependency graph: used to represent the data flow relationship between variables, that is, the value of one variable depends on the value of another variable. This dependency helps the compiler perform data flow analysis to ensure the correct use of variables.
Control dependency graph: used to represent the control relationship between statements, that is, the execution of one statement depends on the execution result of another statement. This dependency helps the compiler perform control flow analysis to optimize the execution efficiency of the program.
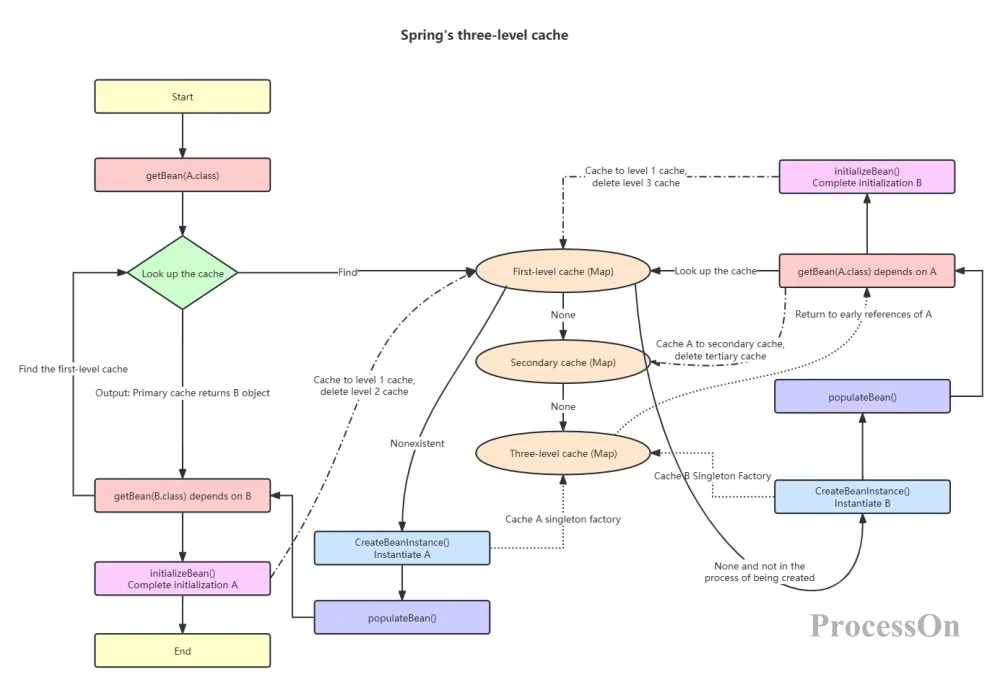
Spring Circular Dependency Graph
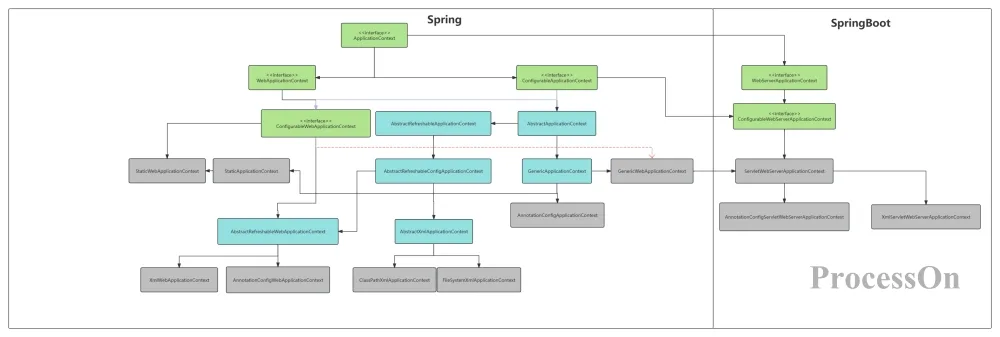
System dependency graph : The system dependency graph is a graph that integrates the entire system based on the program dependency graph. The system dependency graph helps analyze the function call relationship, data flow relationship, and control relationship in the system to understand the overall structure and behavior of the system.
The PERT chart (Program Evaluation and Review Technique) can be considered a dependency chart. It is a tool used for project management, especially for planning and time management of complex projects. It uses a network diagram to represent the sequence of tasks and activities in a project, and helps project managers identify the critical path, which is the shortest time path required to complete the project.
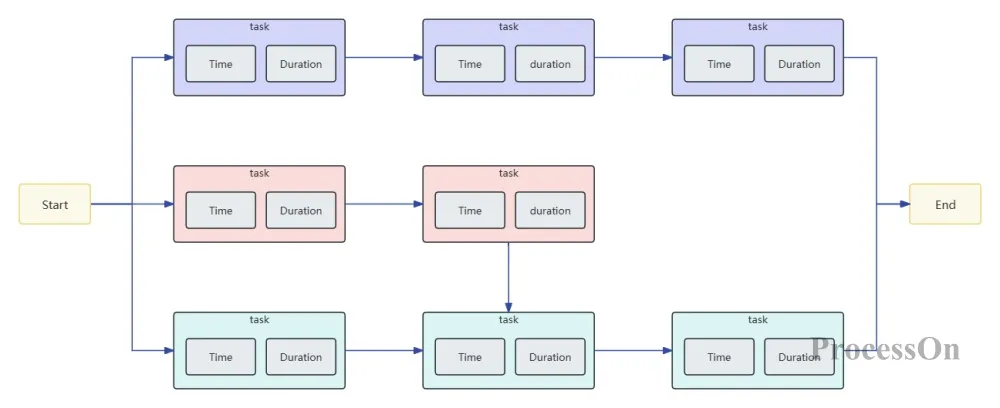
If you want to know more about the PERT chart, you can go to the A Beginner's Guide to PERT Charts:A Powerful Tool for Project Management article to view it.
drawing dependency diagrams , and it is very important to choose a handy tool. Common ones include Visio, Lucidchart , ProcessOn, etc. Users can choose the appropriate dependency diagram maker according to their needs. Here we mainly explain how to use ProcessOn to make dependency diagrams . ProcessOn is a professional online drawing maker that supports drawing dependency diagrams, flow charts, UML diagrams, network topology diagrams and other professional graphics. The site contains tens of thousands of templates, which can quickly create graphics and support collaborative editing with others.
1. Open the ProcessOn official website, go to the personal file page, and click New to create a flowchart .
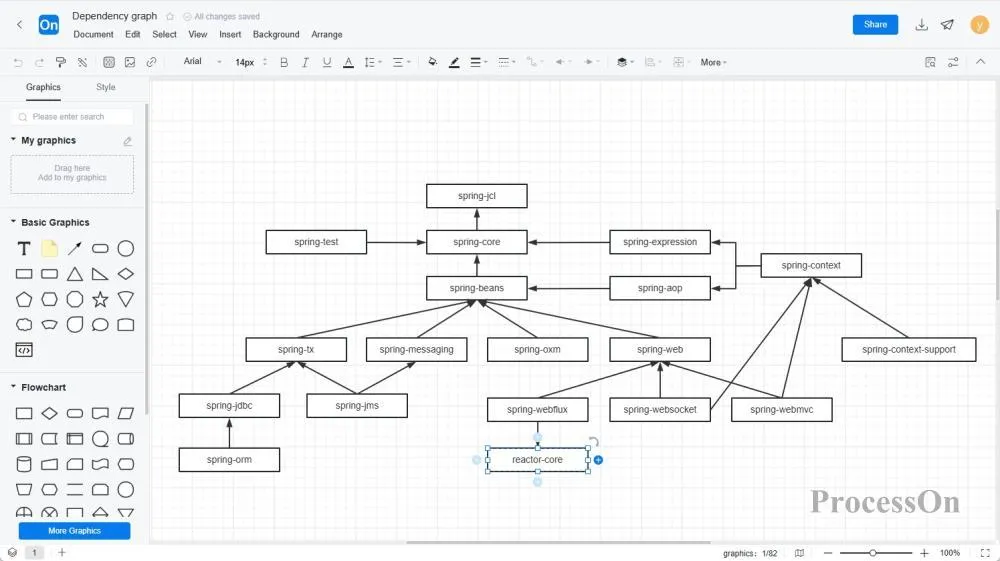
2. Drag a shape from the shape library on the left side of the maker onto the canvas to create a node that represents the component or module in your system . Usually, you can represent a node by inserting a rectangle and double-clicking to edit its content . Click the "+" on the shape to create a connection between shapes. The connection line represents the dependency relationship between components.
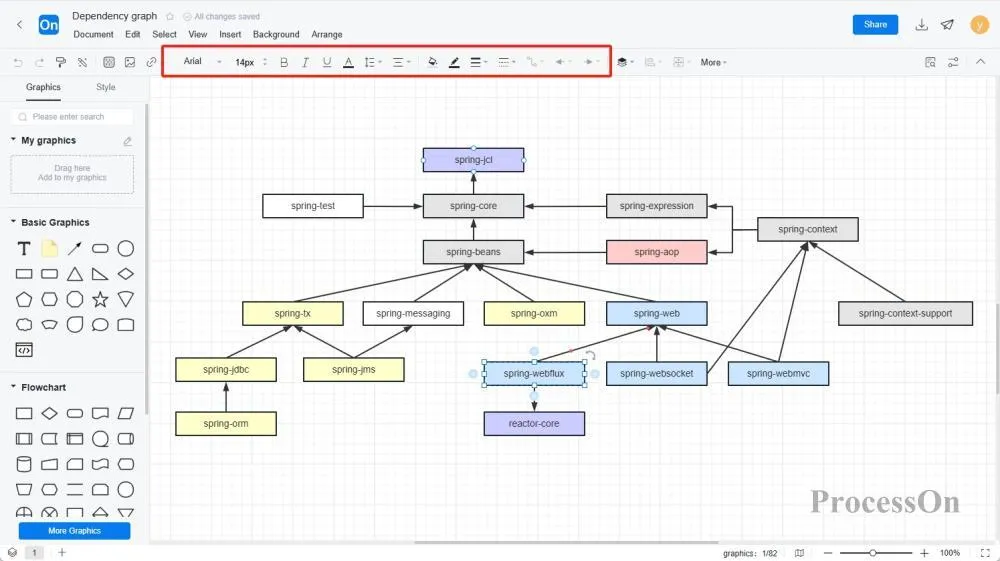
3. Select the graphic, the top toolbar supports setting text style and line style, you can modify the font, font size, color, border style, etc. Select the line, the top toolbar can set the line to a dotted line.
when drawing and using dependency graphs :
Keep it simple: Try to simplify your dependency graph to include only necessary components and dependencies. This helps improve readability and reduce misunderstandings.
Use standard notations: Follow standard notations and representations to ensure your dependency graphs are consistent and understandable across different teams and projects.
Update regularly: As your system evolves and changes, update your dependency graph to reflect the latest dependencies.
Verification and testing: After drawing, the dependency graph is verified and tested using tools or manual methods to ensure its accuracy and reliability.
From complex software development projects to project management , dependency graphs reveal the interdependencies between elements in an intuitive way, allowing decision makers to find the key path to solve large and complex problems. Through the introduction of clear concepts, examples , drawing tutorials, etc., I believe you have a deeper understanding of dependency graphs . I hope this article can provide you with useful reference and guidance for applying dependency graphs in actual work .