In today's data-driven world, how to clearly and intuitively display complex information has become a common challenge faced by all fields. tree diagram is a powerful data visualization tool with a clear hierarchical structure and intuitive expression . This article will explore the concept of tree diagram, application scenarios, and detailed tutorials on how to draw tree diagrams to help readers master this powerful tool for data visualization.
A tree diagram is a type of diagram that uses a tree structure to display the hierarchical relationship of data. It is usually composed of a root node, branches, and leaf nodes, where the root node represents the starting point of the data or the top-level classification, the branches represent the hierarchical relationship between the data, and the leaf nodes are specific data items or the bottom-level classification. Tree diagrams can intuitively display the size, proportion, and hierarchical depth of data through branches of different lengths or colors, and are very suitable for displaying hierarchical data such as organizational structures, classification catalogs, and family pedigrees.
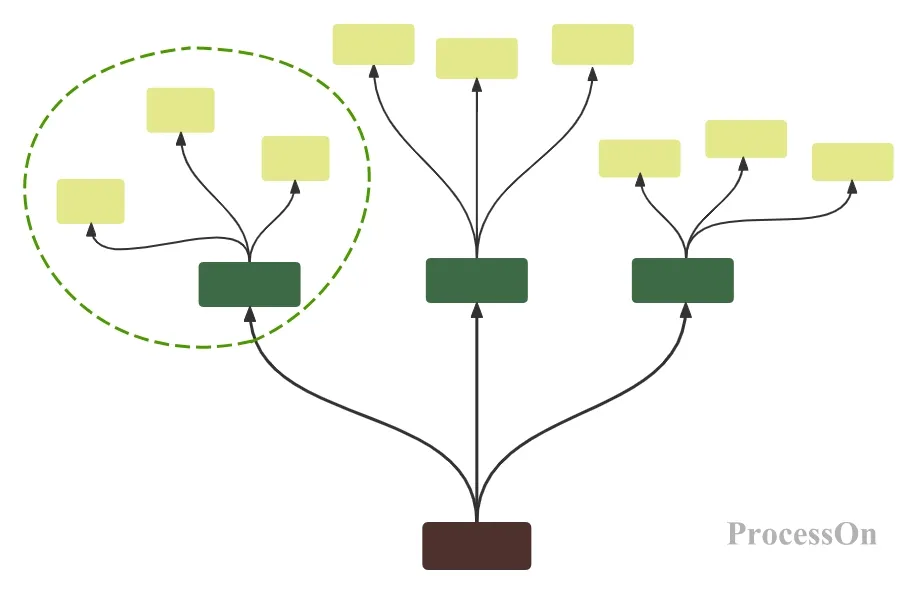
Organizational chart: Companies often use tree diagrams to display the company's hierarchical structure, including department divisions, job relationships, etc., to help employees quickly understand the company's structure.
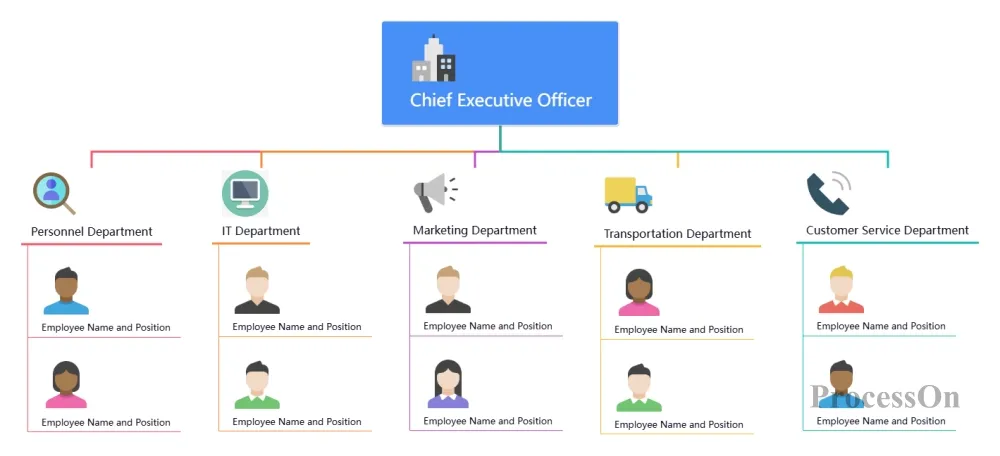
Company Organization Chart Template
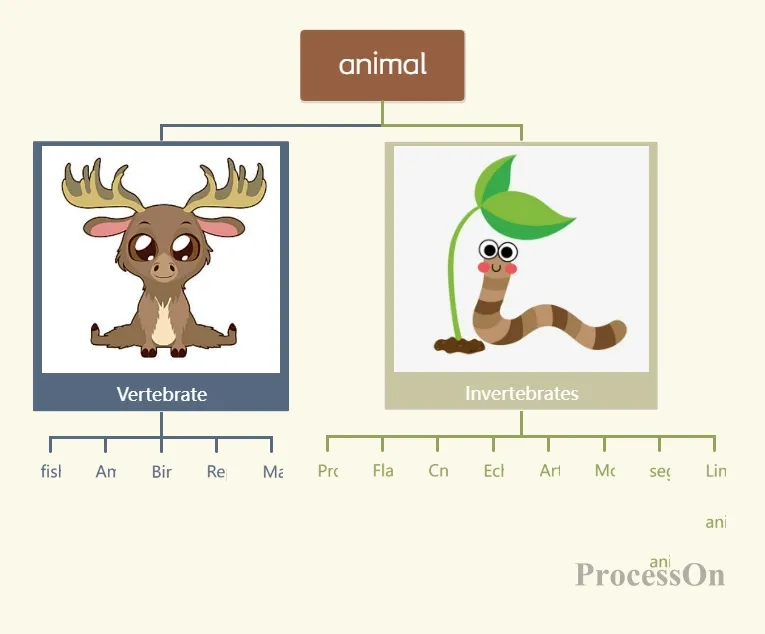
Category catalog: Tree diagrams can effectively display the classification system of items/products , making them easier to browse and search.
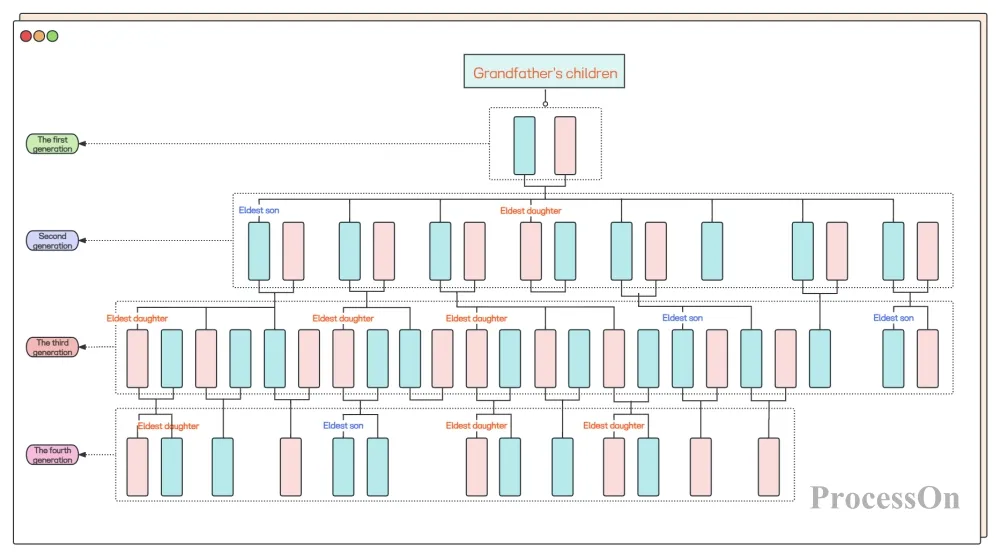
Family tree: In historical and biological research, tree diagrams are often used to draw family trees and species evolution trees to show genetic relationships or developmental contexts.
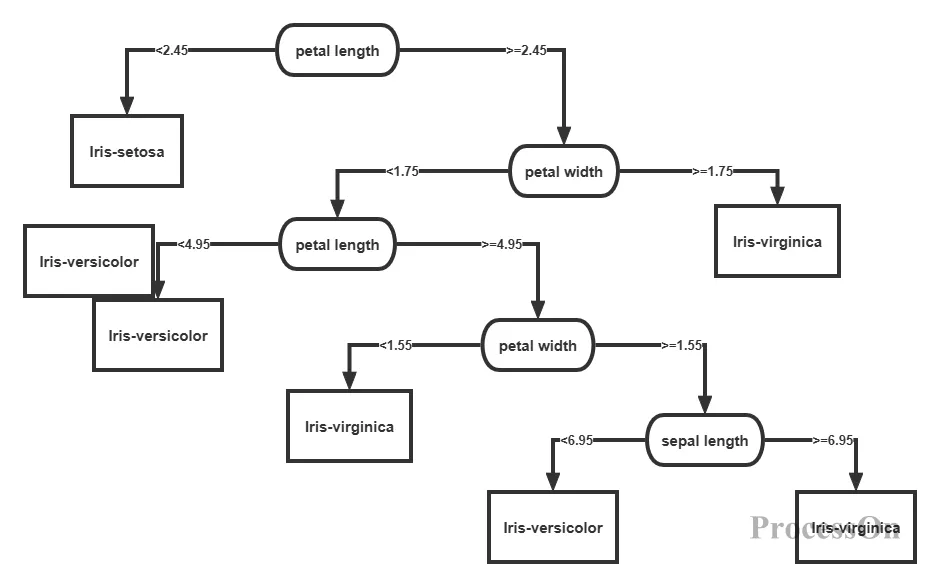
Decision tree: A method of listing the relevant steps of solving a problem and the conditions and results of each step through diagrams. It is used to evaluate project risks, judge its feasibility, and assist decision makers in making the best choice . It is also commonly used in the field of machine learning to analyze data and predict future trends.
There are many tools for drawing tree diagrams, and it is very important to choose a tool that suits your needs. Common tools include Visio, Word, ProcessOn, etc. Users can choose the right tree diagram maker according to their needs. For beginners, ProcessOn is recommended , which provides a rich template and easy-to-use interface. Here we mainly explain how to use ProcessOn to make a tree diagram.
To draw a tree diagram, whether you draw it manually or using a software tool, you need to follow certain steps. As a comprehensive drawing tool, ProcessOn can draw a tree diagram using a mind map maker or a flowchart maker.
1. Go to the personal file page and create a new mind map.
2. Switch the [Structure] button on the right toolbar to the tree diagram structure, and double-click the central topic to name the starting point of the tree diagram.

3. Click the [Enter] key to create a branch node of the tree diagram, continue to click the [Enter] key to create the same-level nodes of the branch node, and click the [Tab] key to create the child nodes of the branch node.
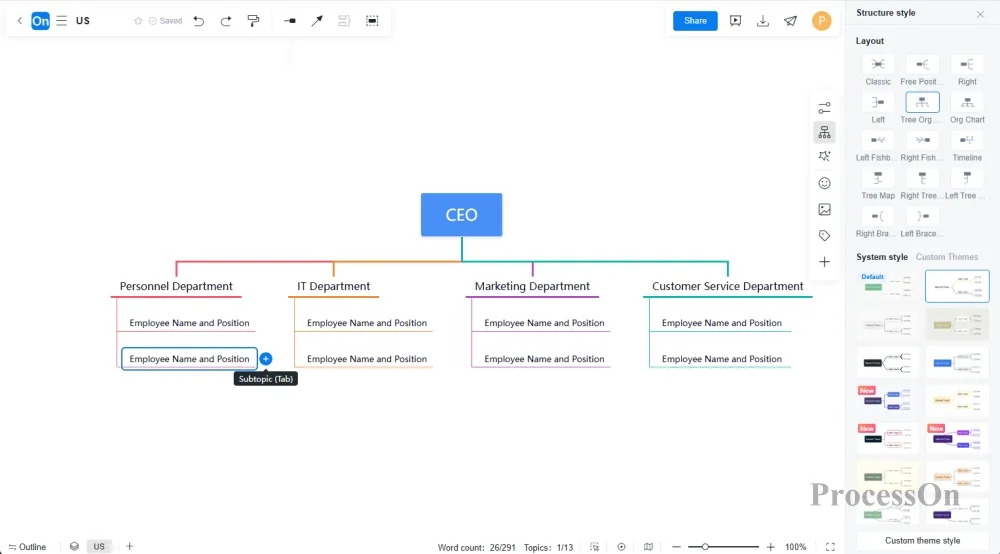
4. After completing the filling of the tree diagram content, you can click the toolbar on the right to beautify the style and supplement the details. You can add icons, labels, notes, pictures and other content to the nodes.

1. Go to the personal file page and create a new flowchart.
2. Drag a graphic from the graphics library on the left to the canvas as the root node . Starting from the root node, add branches and child nodes one by one according to the data hierarchy . Select the node and click the "+" around the node to add a connection. Pay attention to maintaining the clarity and balance of the branches and avoid crossing or overlapping. If you want to make a more designed tree diagram, you can import pictures to the canvas and create a tree diagram with graphics from the graphics library.
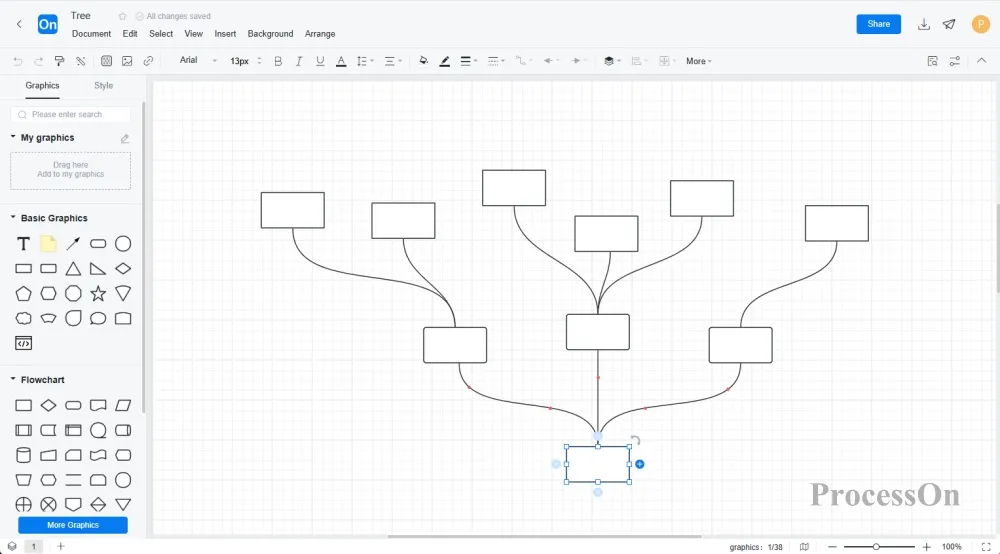
3. Select each node and use the top toolbar to adjust the color and size of the nodes and text as well as the thickness and color of the branches as needed to enhance the readability and aesthetics of the chart. If necessary, you can add comments or instructions next to the chart to help readers better understand the content of the chart.
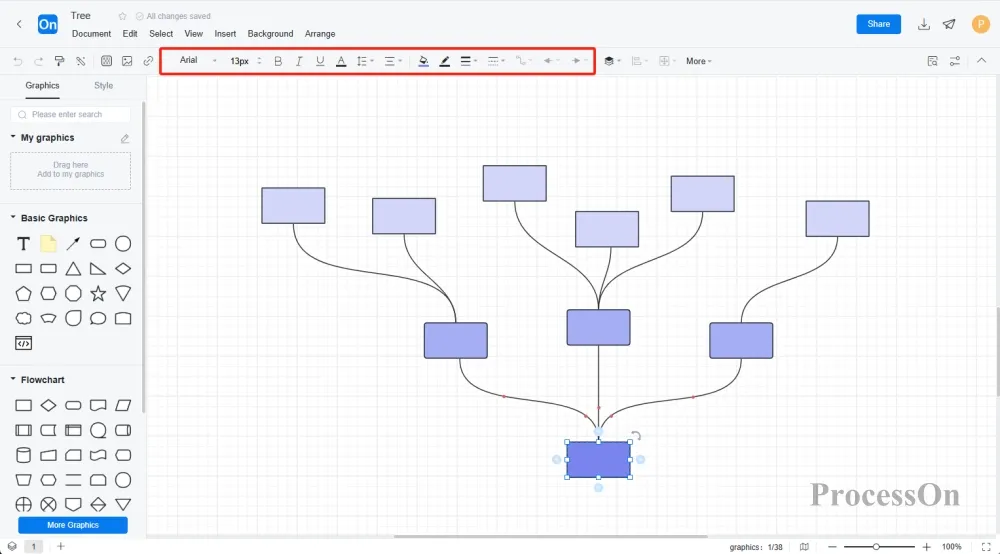
The mind map maker is easy to operate and suitable for making tree diagrams with relatively simple structures. The flowchart maker has a large degree of freedom in operation and is suitable for making flowcharts with relatively complex structures.
Finally, export the completed tree diagram to a suitable format (such as PNG, PDF) for use in reports, presentations, or sharing with others.
There are many creative and beautiful tree diagram templates and examples on ProcessOn, which can be cloned and used directly.
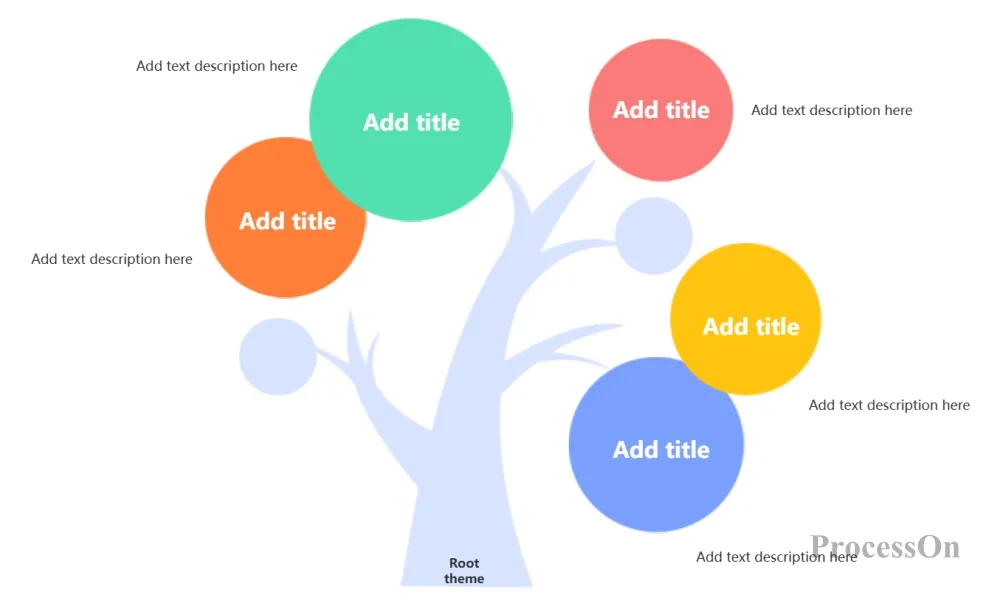
Tree diagram creative template
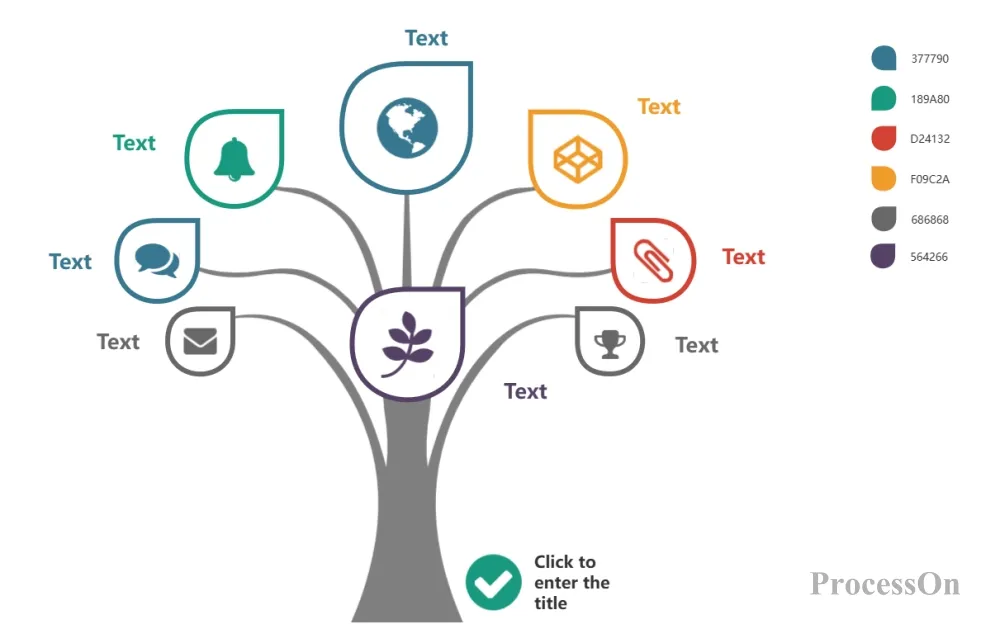
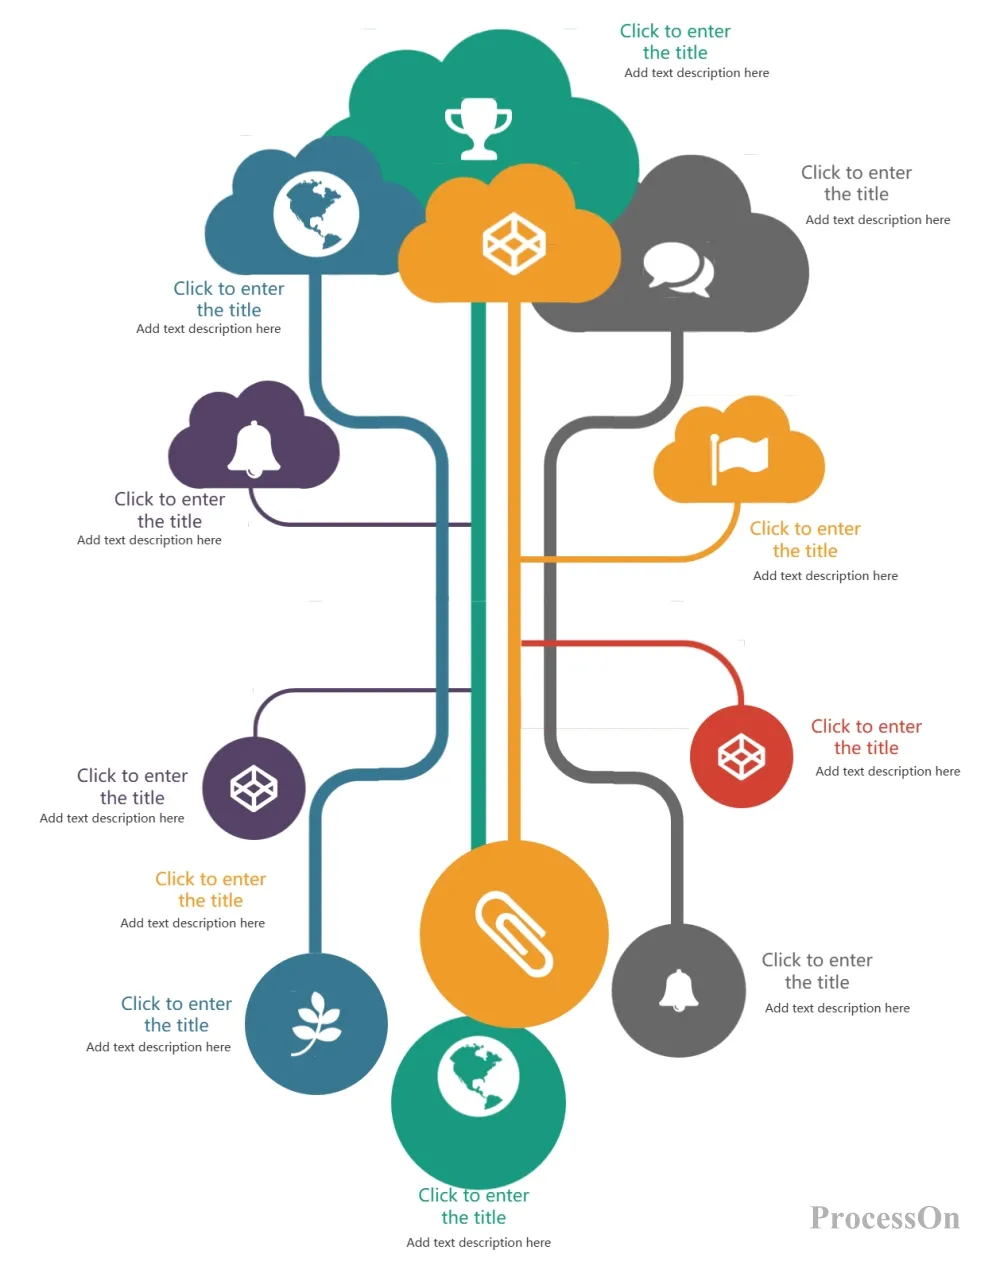
Tree diagram creative template

Decision Tree Diagram Template
By following the above steps, even beginners can easily draw a tree diagram that is both beautiful and practical. Remember, effective data visualization is not only a display of technology, but also a combination of a deep understanding of data and creative expression. I hope this article can inspire you to use tree diagrams more and make data visualization a powerful assistant in your work and life.