The fishbone diagram, as the name suggests, looks like the skeleton of a fish, with the head and tail connected by a thick line, just like the spine.
The fishbone analysis method, also known as the cause-and-effect analysis method, was developed by Japanese management guru Kaoru Ishikawa. It is an analysis method that sees the essence through phenomena. It can help us quickly find the root cause of the problem. It is simple, practical, in-depth and intuitive.
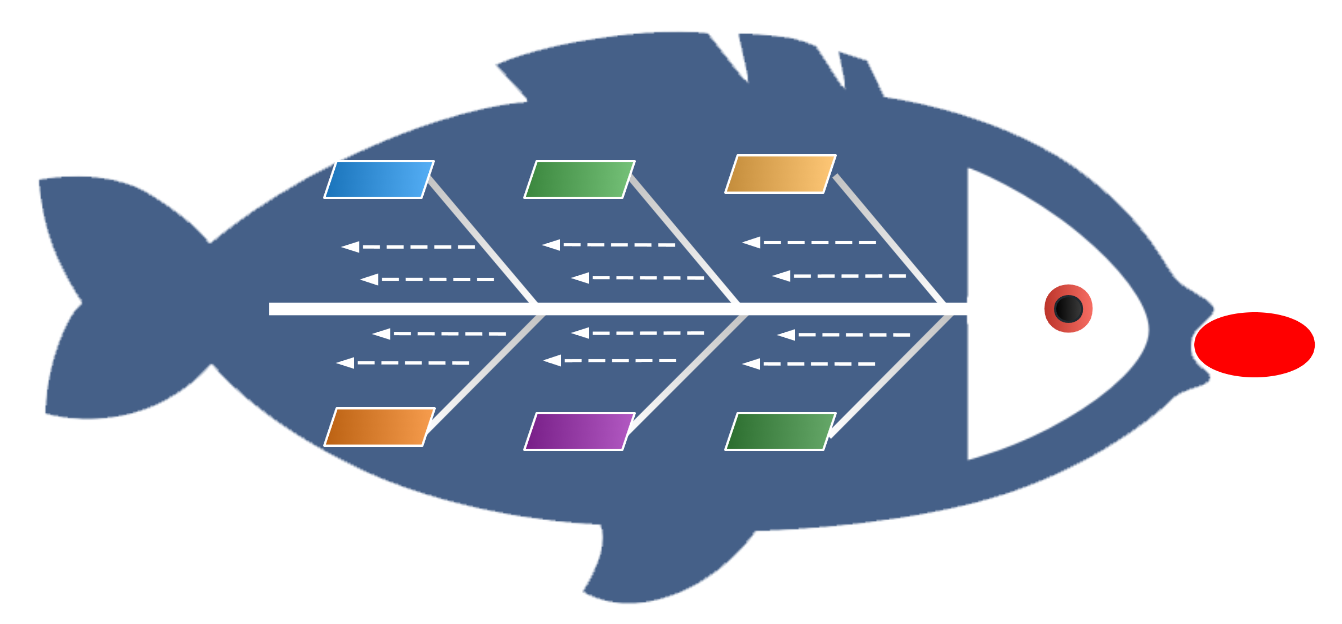
The basic principle of fishbone analysis is to take a problem (as the head of the fish), list the major causes of the problem (the main trunk of the fishbone), and then continue to break down the major causes and explore the minor factors (branches of the fishbone). This process is repeated layer by layer until a solution or action step is found to solve the problem.
ProcessOn mind map supports drawing fishbone diagram, and flowchart also supports drawing fishbone diagram. Come and use it for free .
There are two commonly used fishbone diagrams: the cause-type fishbone diagram (fish head on the right) and the countermeasure-type fishbone diagram (fish head on the left), which are used to analyze and solve problems. The fishbone diagram is a non-quantitative tool that can help us quickly identify the potential root causes of the problem. 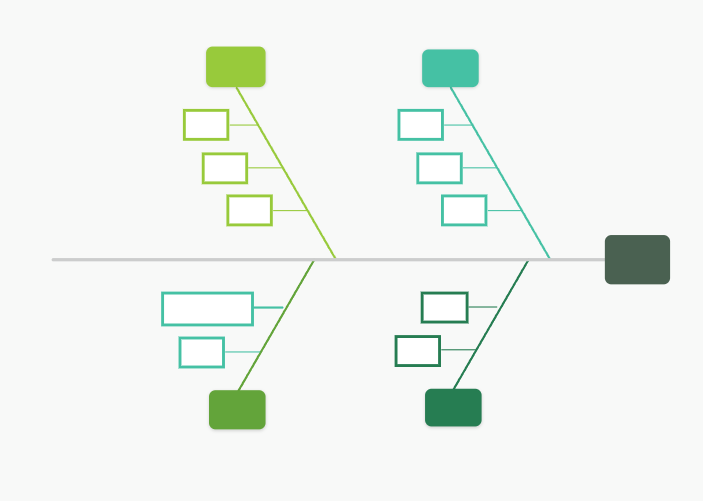
Cause-type fishbone diagram (fish head on the right)
Countermeasure fishbone diagram (fish head on the left)
It is easier to draw a fishbone diagram using ProcessOn mind map than a flowchart. Today, we will teach you how to draw a fishbone diagram using a flowchart, so that the flowcharts you create will look better.
Step 1: Create a new flow chart in the ProcessOn personal file page and draw the fish head
Steps:
Step 1: Drag a triangle in the editing area, use the rotation function to rotate the triangle 90 degrees clockwise, and fill the triangle with black.
Step 2: Drag a circle in the triangle to act as the fish eye
Step 3: Copy the fish head, paste it, and use the rotation method to draw the fish tail
Step 4: Insert a main bone between the fish head and tail
Step 2: Add large bones, medium bones, and small bones
Steps:
Step 1: Insert an arrow (big bone) on the main bone, and keep the angle between the big bone and the main bone at 60 degrees. The number of big bones is determined according to your needs, usually more than 4. In order to ensure that the big bones are the same length, it is recommended to use the copy and paste function.
Step 2: Add middle bones, small bones, etc.
Step 3: Add text to each skeleton
Steps:
Step 1: Insert vertical text into the fish head, which is the central theme
Step 2: Add text to each skeleton
In this way, a complete fishbone diagram is completed, and the effect diagram is shown in the picture below.
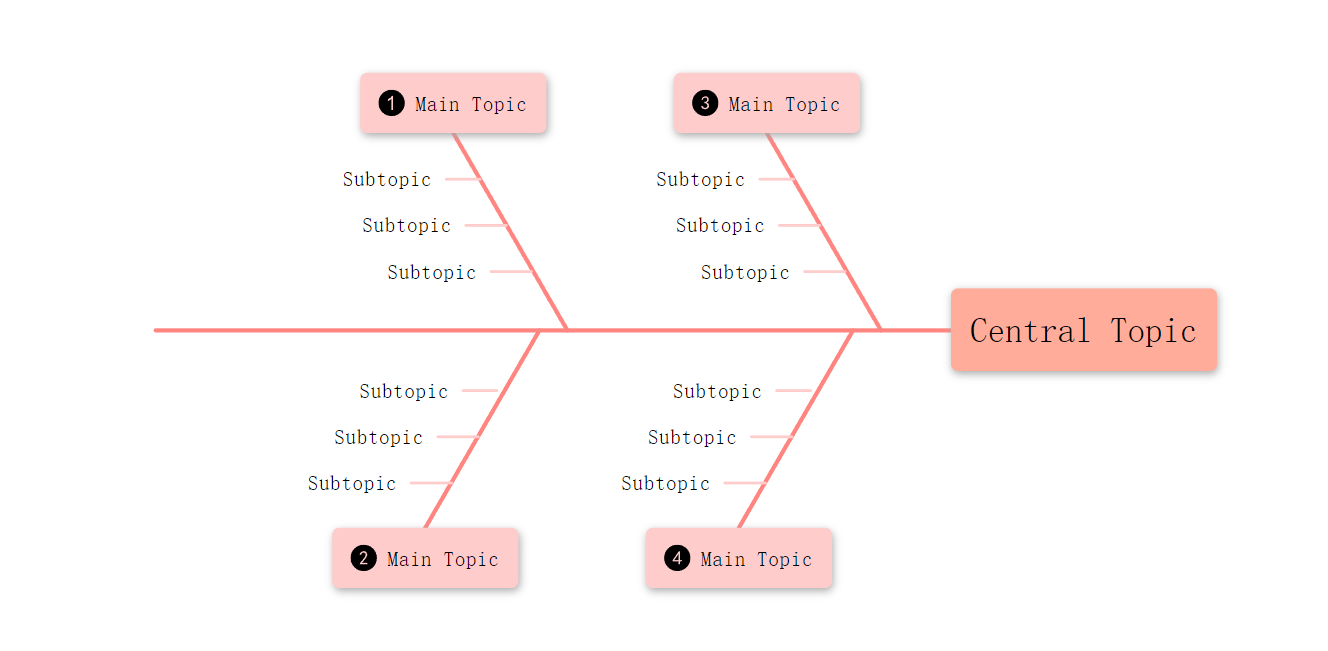
Follow the steps to create a fishbone diagram using ProcessOn flowchart
The fishbone diagram has a wide range of application scenarios. It can be used to solve problems in study, work, and life. It can be used for problem analysis, countermeasure analysis, event analysis, cause-and-effect analysis, etc.
Problem Analysis
For example, when analyzing the cause of machine equipment failure, you can try to establish a diagnostic framework, starting from the thinking chain of "equipment problem-firewall setting-software failure-VPN configuration problem", and explore the root cause of the problem step by step.
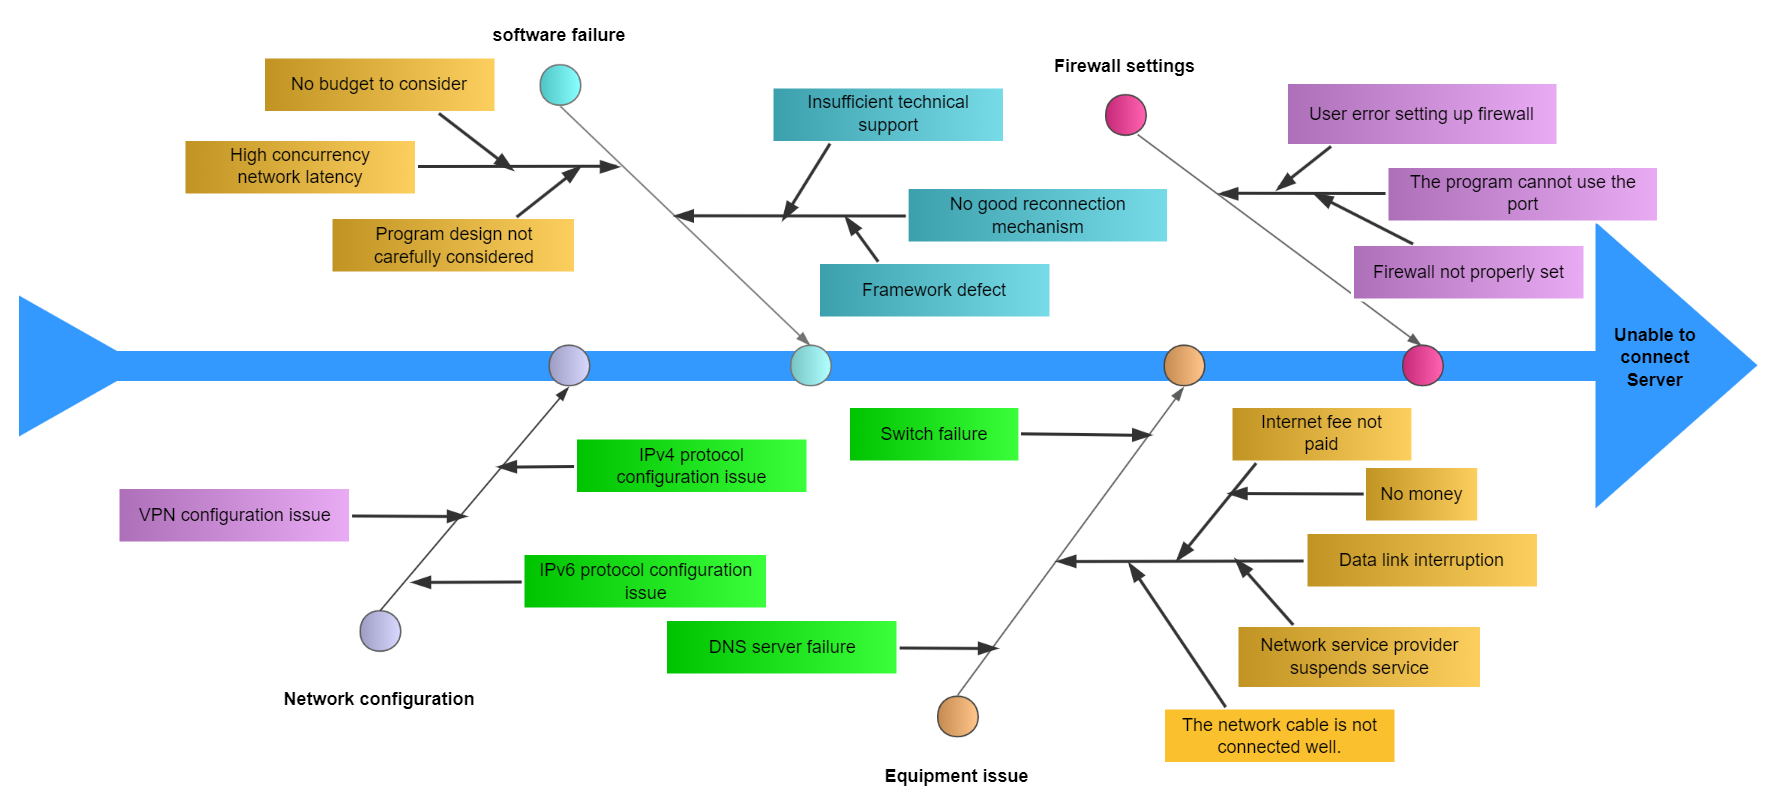
Fishbone diagram for machine equipment failure analysis
For example, if the road construction is not completed on time, by thinking about the link entrance from the perspective of personnel-machine-raw materials-methods-links, you can find the root cause of the failure to complete the task on time.
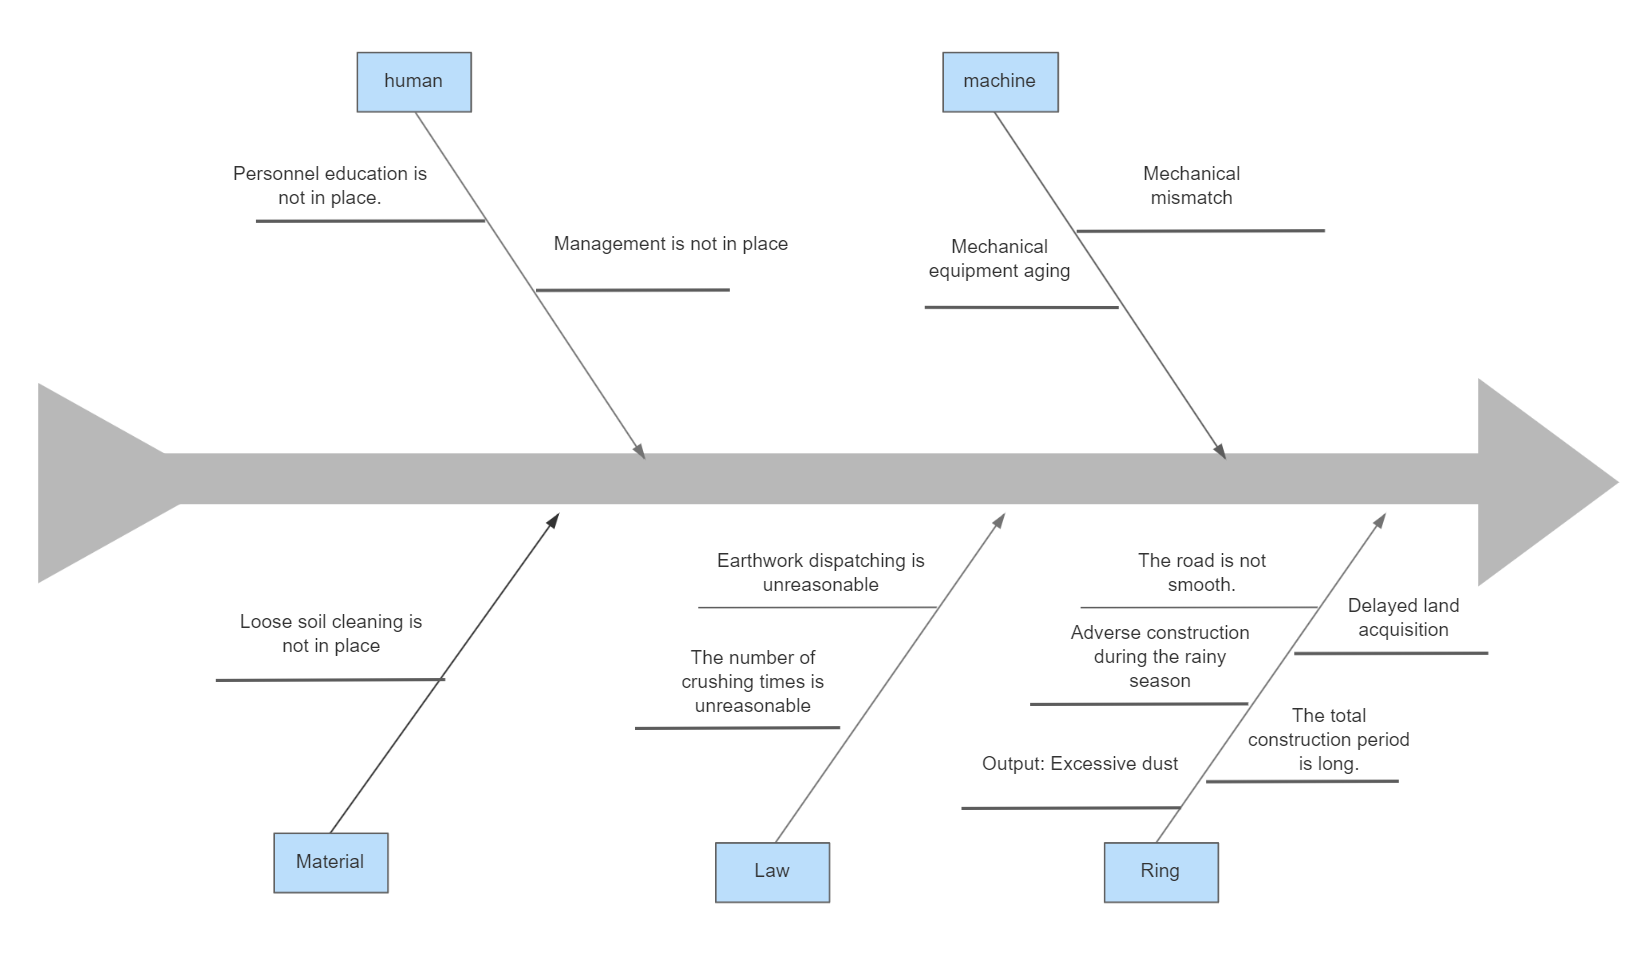
Road Construction Delay Analysis
Countermeasure Analysis
There are solutions to every problem. When facing a problem, it is important to find out the cause and to find the corresponding solution based on the cause. When analyzing the solution, using fishbone analysis is also a good idea. For example, the following fishbone diagram is used to analyze how the company can develop better.
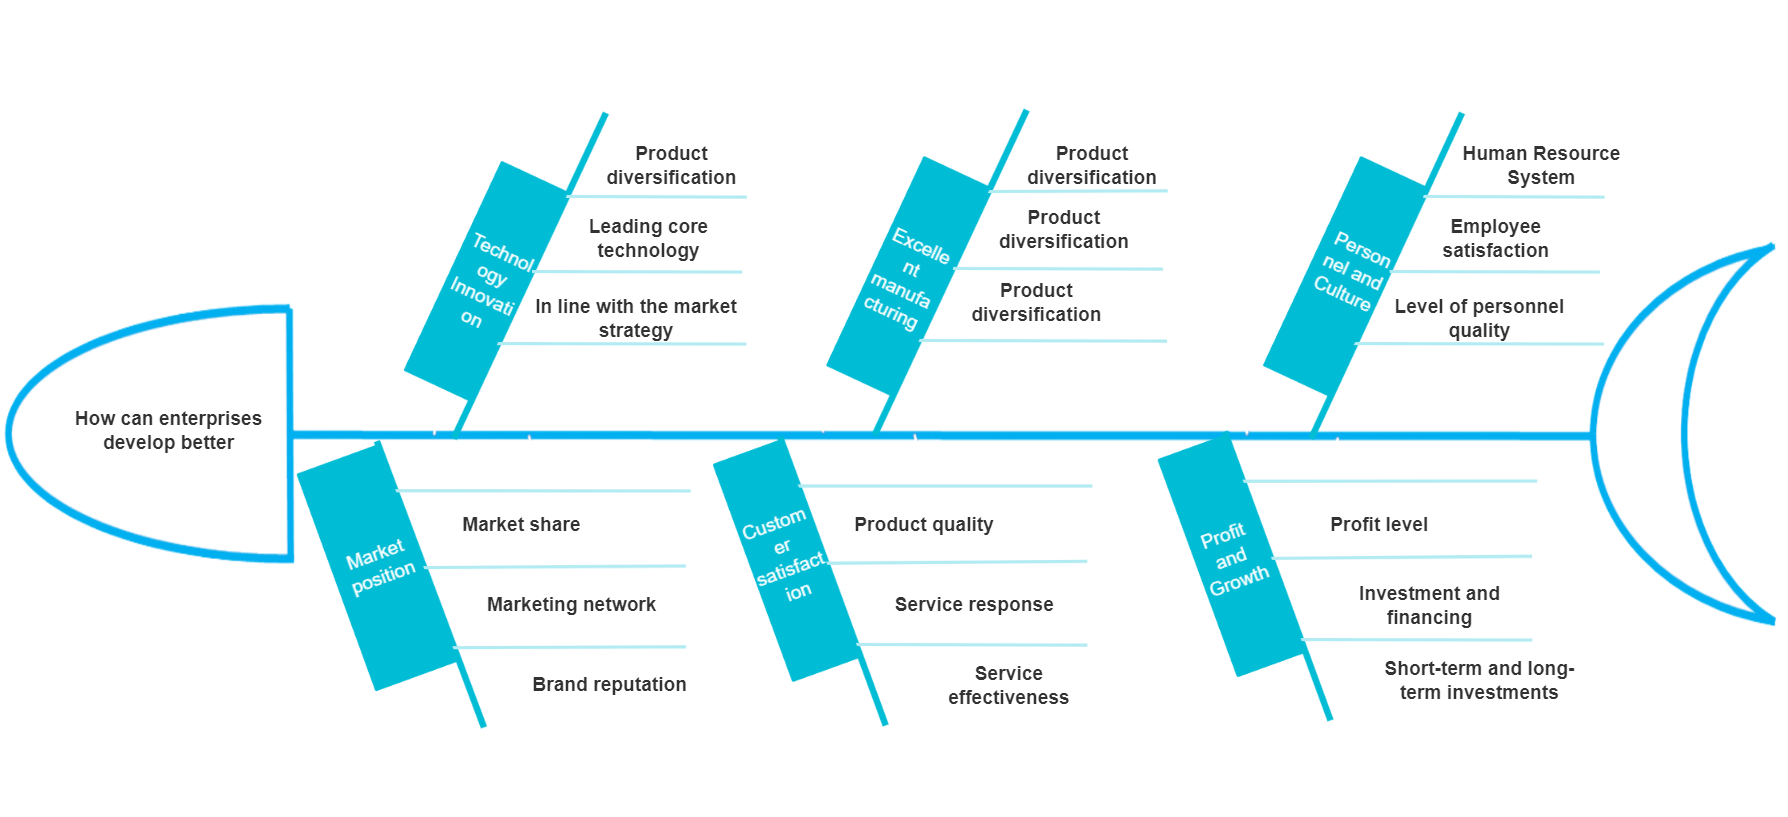
How can enterprises better develop and analyze the fishbone diagram
There is also the problem of how to lose weight, which seems small but is actually difficult to do. We need to conduct targeted summaries and analyses on diet, exercise, professional treatment, and lifestyle habits to find out the causes and come up with countermeasures.
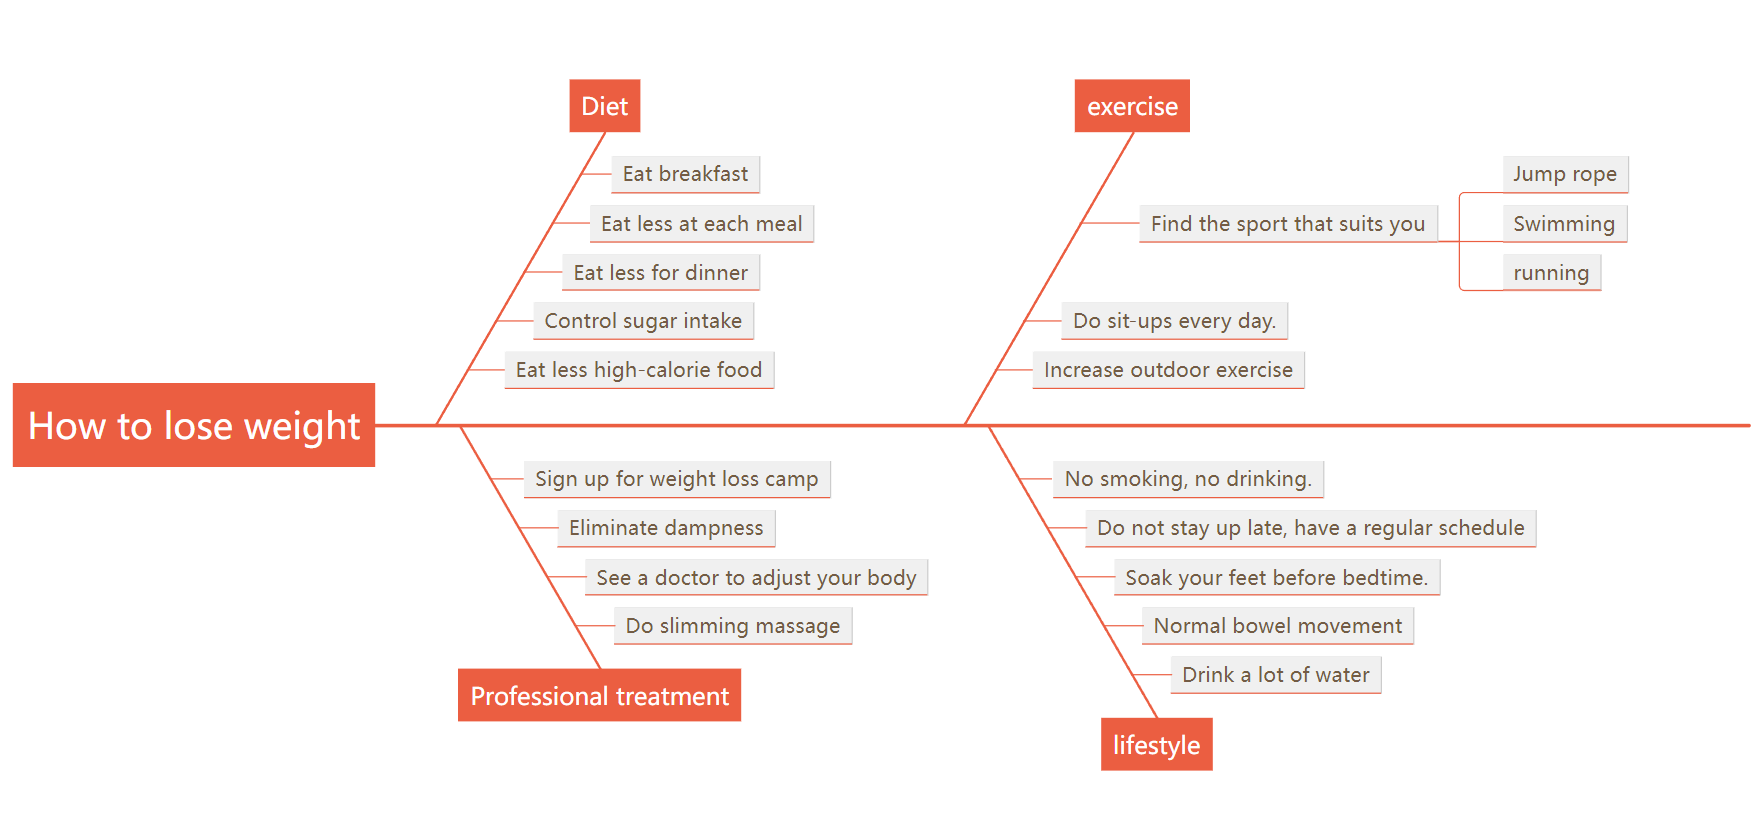
How to lose weight fishbone diagram
In summary, the fishbone diagram is a tool to help us analyze problems and find solutions. From digging out the essence of the problem to disassembling the problem, through this way of finding solutions to the problem, work efficiency will definitely be greatly improved.
More exquisite fishbone diagram templates can be cloned and used with one click . Just search for "fishbone diagram" in the ProcessOn template community .