A flowchart, also known as a program flowchart, is a graphical representation of the flow of information, ideas, or components through a system. It is a block diagram representation of an algorithm, workflow, or process. It uses different types of boxes to represent different types of steps, and arrows connect every two steps. This representation method is convenient for explaining how to solve a known problem. Flowcharts are widely used in analyzing, designing, recording, and manipulating processes or procedures in many fields.

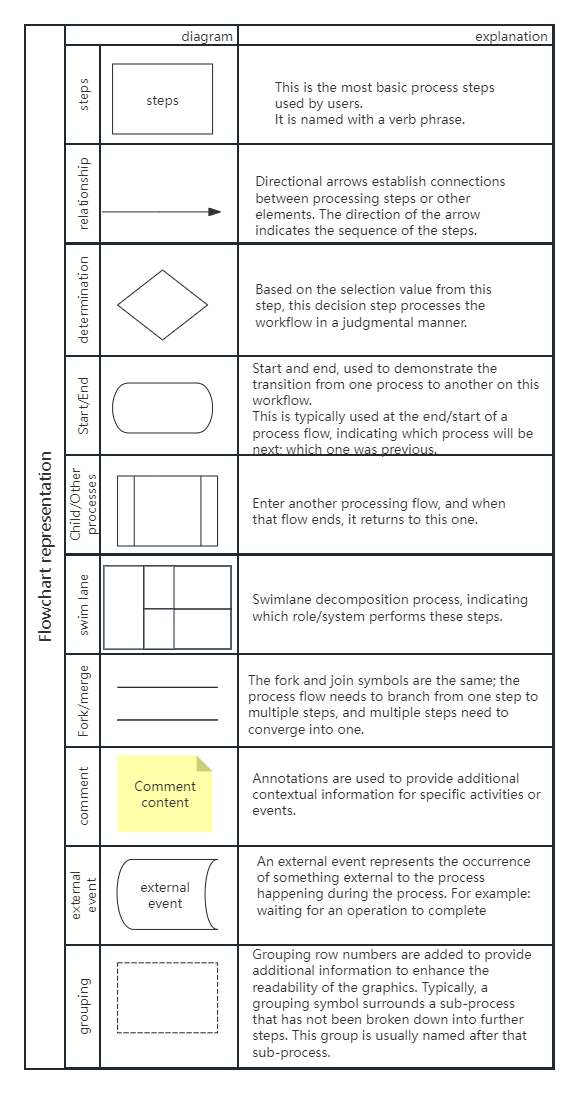
In practical applications, flowcharts are the most frequently used graphics to record the formulation of process standards for various work processes, facilitate more standardized process sorting, and continuously adjust and optimize the operation process that best suits a certain actual process.
Whether in daily life or at work, when we encounter a task, we should first understand the background, stakeholders, task content, expected results, etc. of the task, and then use appropriate flowcharts to clarify the entire process based on the task situation, so as to optimize the process and display the task process in a graphical way.

Commonly used sequential flow charts
The most commonly used flowcharts are divided into basic flowcharts, cross-functional flowcharts, timing diagrams, and state flow diagrams. Each type of diagram can clearly show how the work is carried out from different directions and angles, and can also make it easier for us to understand how the project is carried out from beginning to end from a stage or the overall situation. Below I will use the ProcessOn flowchart to introduce the four types of flowcharts one by one.
As the most basic and simple flowchart method, the basic flowchart generally does not distinguish between user roles and scenarios. It is suitable for simple scenarios and sorting out single process situations. It can also be used as a fragment of the overall process.
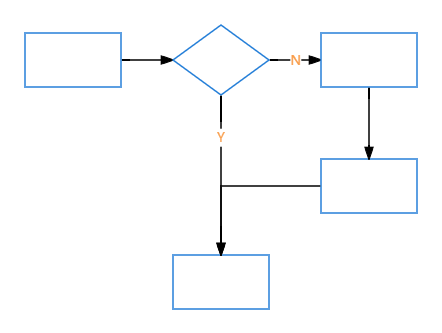
Basic Flowchart Style Template
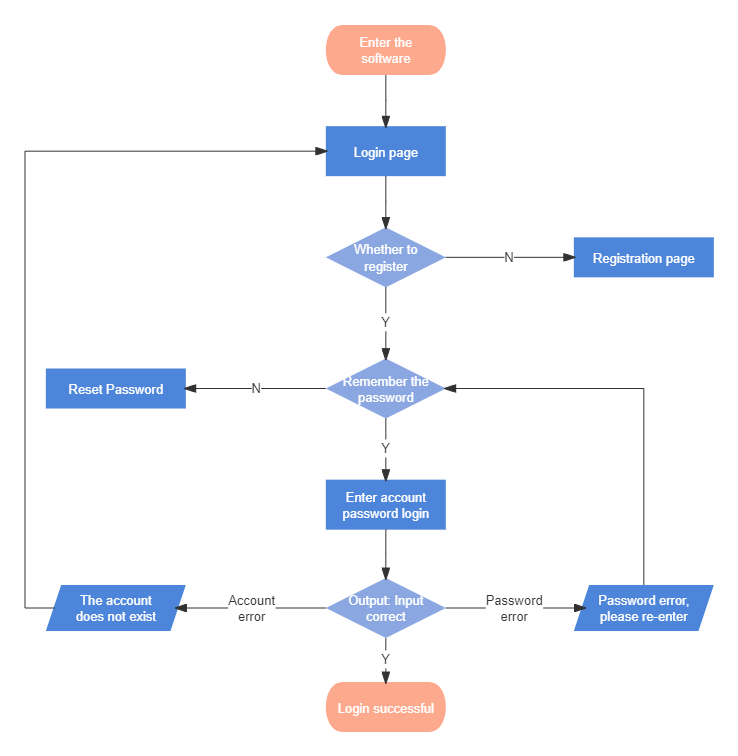

Product Login (Basic) Flowchart
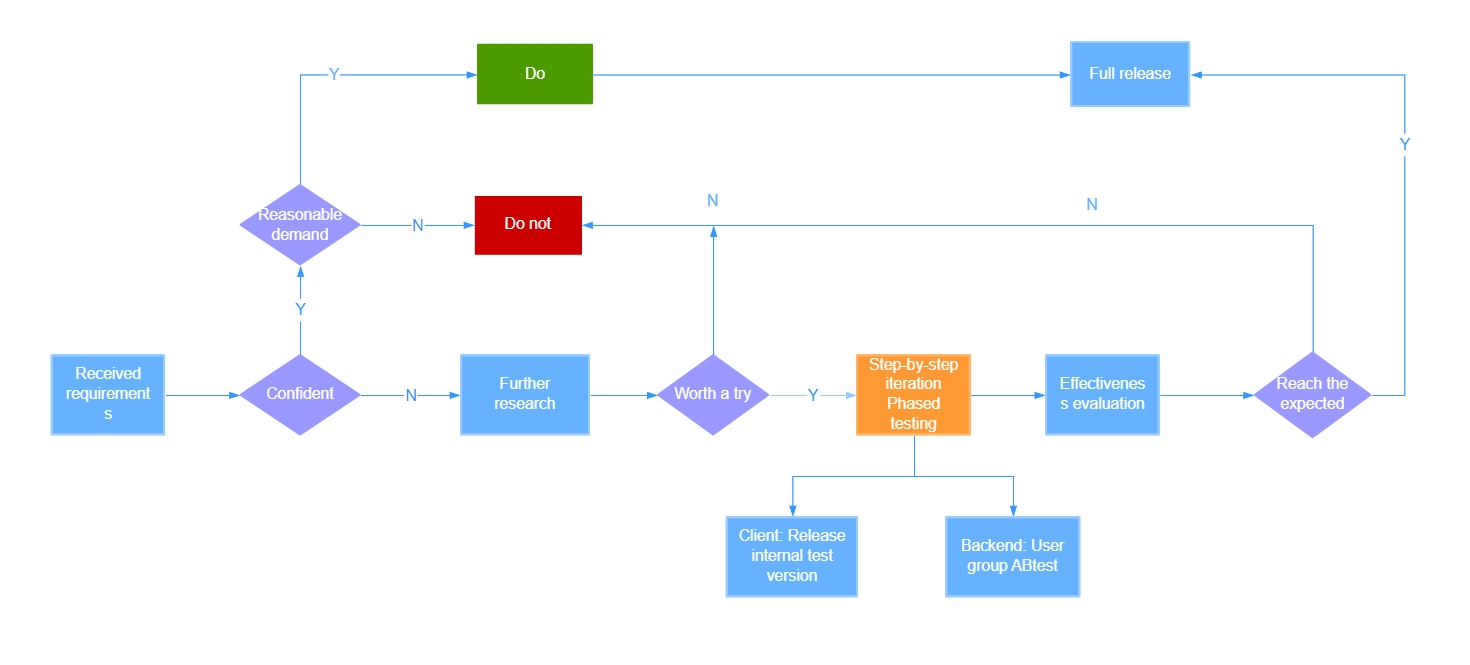
Needs Assessment Process Logic Diagram
The cross-functional flowchart is based on the basic flowchart, and the overall process is divided into functional departments or project roles to sort out the overall work process, so that we can clearly understand when each functional department and role needs to intervene in different project stages, and what kind of process needs to be involved at what time. It mainly highlights the division of labor of each functional role on the basis of the project process, so that people in different functional roles can quickly find the process nodes they need to be involved in and need to deal with, and the actions they need to take.

Software development flow chart (Lane chart)
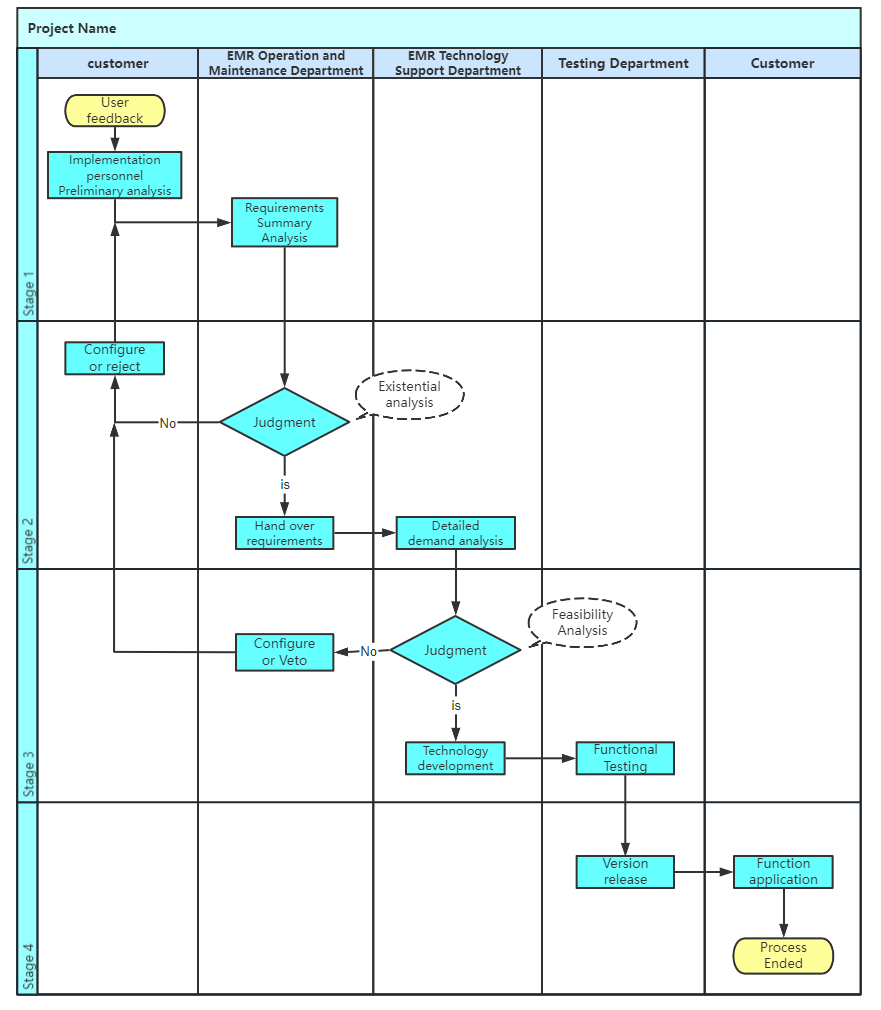
Cross-departmental requirement ments analysis process design diag ram
A timing diagram, also known as a sequence diagram or a sequence diagram, shows the dynamic collaboration between multiple objects by describing the time sequence of messages sent between objects. It is mainly used to describe the sequence and process of execution during the flow of a project process. The form of execution (synchronous, asynchronous, etc.) allows us to understand how the functions of each step interact from a chronological perspective, and to more clearly define the order of flow before and after an execution process.

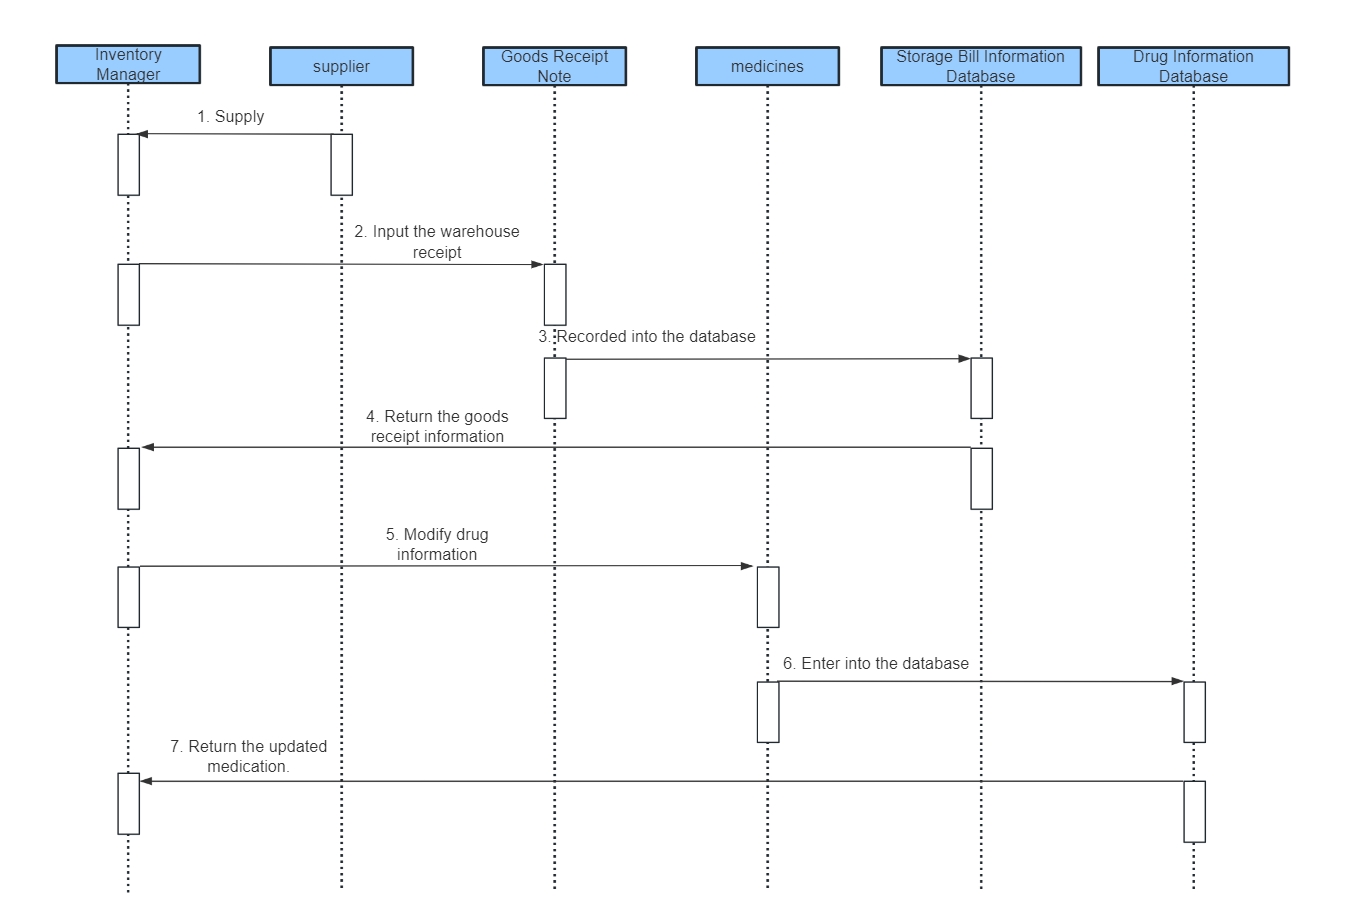
Inventory Management Sequence Diagram
The state flow chart, also known as the state machine, is mainly used to generate different state changes in a node of the project process through different operations. It can help us understand the triggering conditions for the node to change from state A to various states such as B, C, D, etc., and understand the preconditions and post-results of state changes. Here, all states can be exhaustively listed and all the actual state flows that will occur can be arranged in order to form a state flow chart.
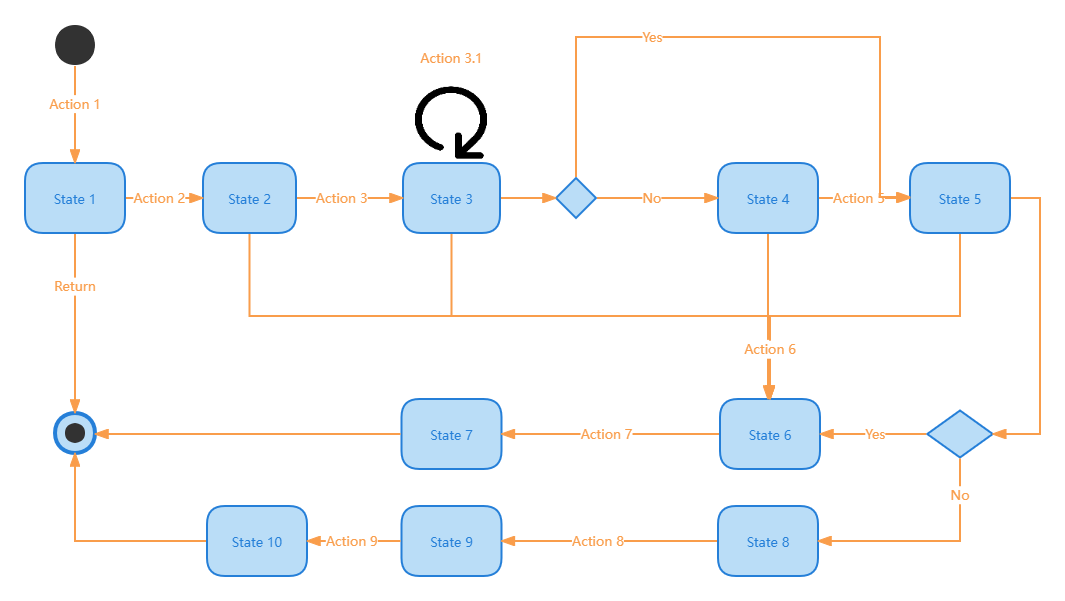
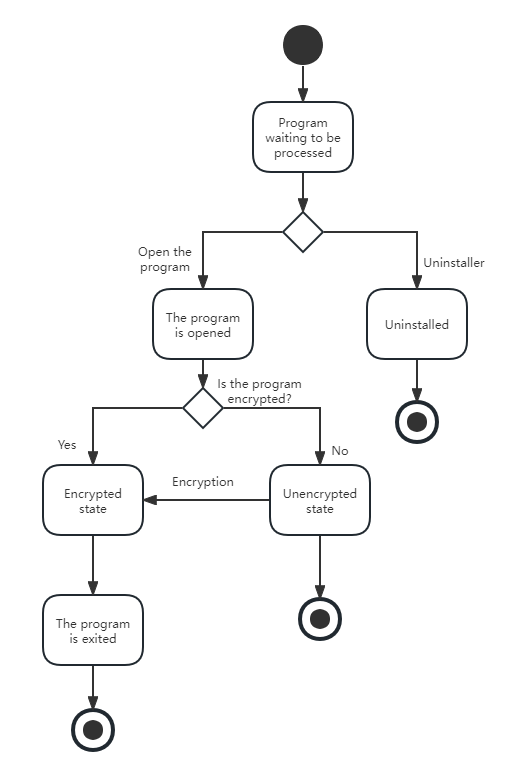
Statechart - Program Management
I believe that through the introduction of this article and the sharing of various types of flowchart templates , you have a deeper understanding of flowcharts. Come and experience the ProcessOn flowchart.