

As an important visualization tool for thinking, the core value of fishbone diagram is to sort out and analyze the causal relationships of problems in an intuitive and visual way. and to make everyone understand the root cause of the problem clearly through multi-dimensional and multi-level analysis of the problem phenomenon. The fishbone chart is an effective visualization tool in team collaboration to stimulate brainstorming and build consensus among team members, thereby helping them to identify the interplay of factors and key issues, and use this to set priorities and solutions. So how should the fishbone mind map be drawn?
The fishbone diagram was developed in the process of improving product quality. After a product is produced, if there is a quality problem, there will be many reasons, but which one is causing it? This is a headache, grabbing your eyebrows and beard can make the problem even more serious.
The emergence of fish bones is precisely to solve this problem.
By brainstorming and looking for the causes of problems from different perspectives, everyone can organize these causes according to their relevance and categorize them on the fish skeleton, forming a clear hierarchy, organization, and a causal diagram with different priorities.
The shape of the picture is like a fish skeleton, and it is easy to see at a glance which ones are important and which ones are secondary. Large bones are important causes, while small bones are secondary causes, and they are subordinate relationships. Through this intuitive way of thinking, we can easily identify the root cause of the problem.
It can be seen that the fishbone diagram is not only a presentation method, but also a way of thinking in essence.
The fishbone diagram allows people to understand the cause of the problem at a glance, which is an expression method.
But around the fish skeleton, we find the problem through brainstorming, and then list the problem on the fishbone shelf through deductive induction logic, which is the way of thinking. Through the display of the fishbone diagram, people can see the cause of the problem at a glance, which is the expression.But around the fish skeleton, we find the problem through brainstorming, and then list the problem on the fishbone shelf through deductive induction logic, which is the way of thinking.
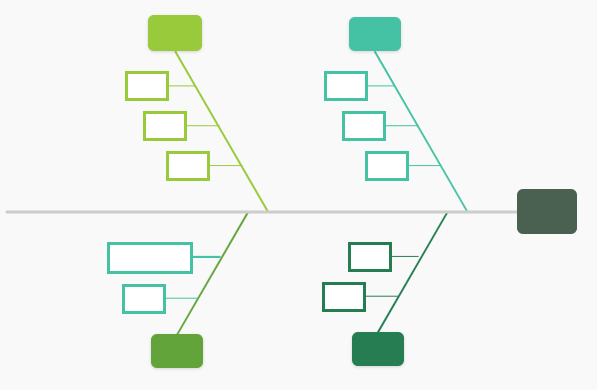
The application scenarios of fishbone diagrams are very extensive, mainly focusing on problem analysis, quality improvement, process optimization, and project management.
① Quality problem analysis: When there are quality problems with products or services, fishbone diagrams can be used to systematically identify and record all potential causes that may cause problems, such as poor raw materials, equipment failure reasons, etc.
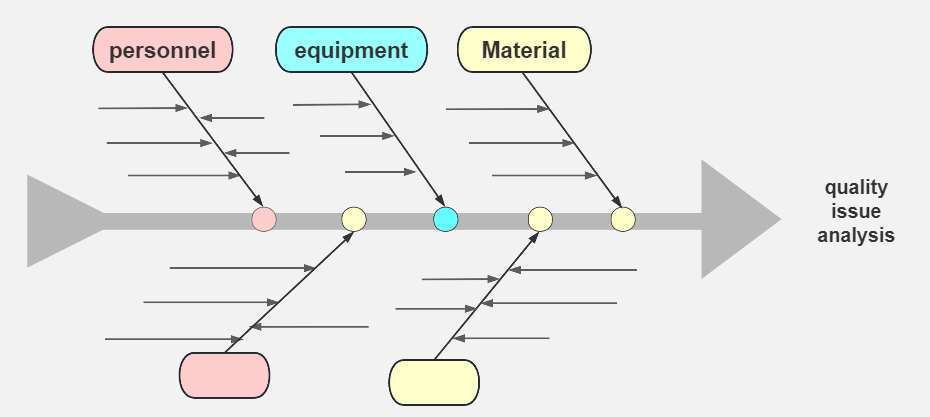
Quality problem analysis fishbone diagram
② Production efficiency improvement: In the manufacturing industry, fishbone diagrams can be used to analyze various factors that affect production efficiency, including operational processes, employee training, etc., in order to identify the fundamental reasons that constrain the improvement of production efficiency.
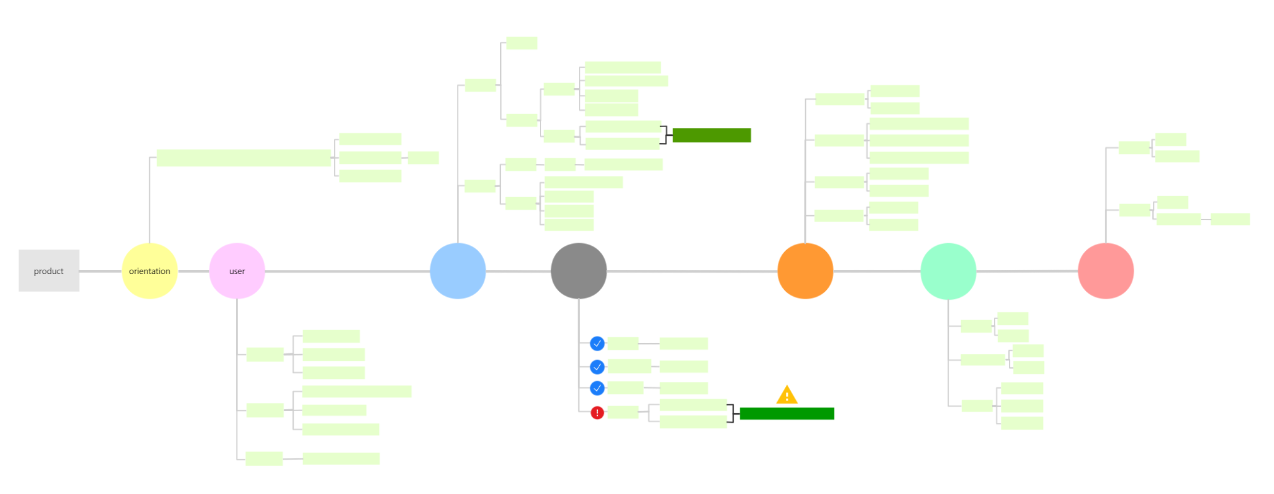
Production efficiency improvement fishbone diagram
③ Project risk assessment: The application of fishbone diagrams within the project management process can identify risk factors and their root causes that may negatively affect the achievement of project objectives, thereby aiding in the formulation of risk management strategies.
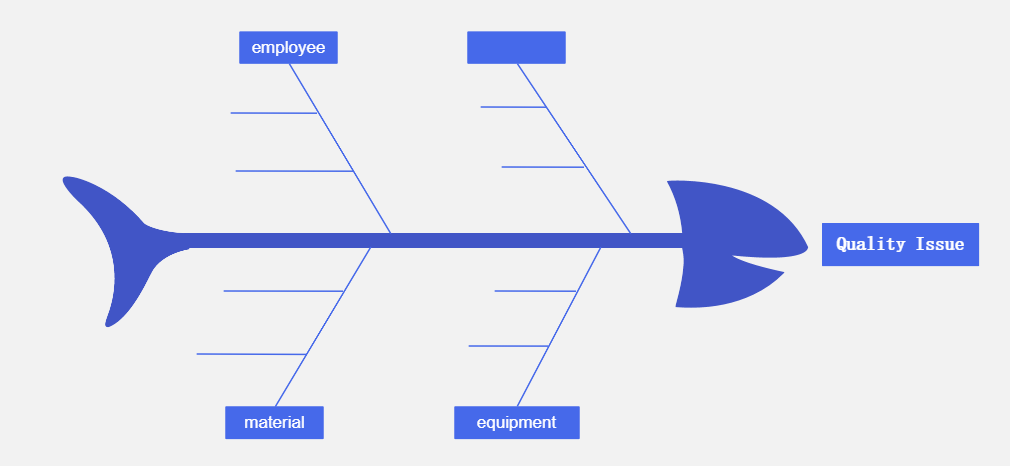
Project risk assessment fishbone diagram
After understanding the basic principle of fishbone analysis, it can be concluded that the process of drawing fishbone diagrams is not complicated and can be summarized into the following three steps:
·Write the problem that needs to be solved on the fish bone.
·Think from various perspectives, identify the various factors, and mark them on the main bone of the fish.
·Dig deeper into the cause, think more deeply about specific details, and mark them on the fishbone branch.

PS: If you don't have enough time, you can also use the cloning function of ProcessOn to quickly create a fishbone diagram. The template library is rich in content, and you can also make changes and use it directly on this basis, which is very convenient and fast.
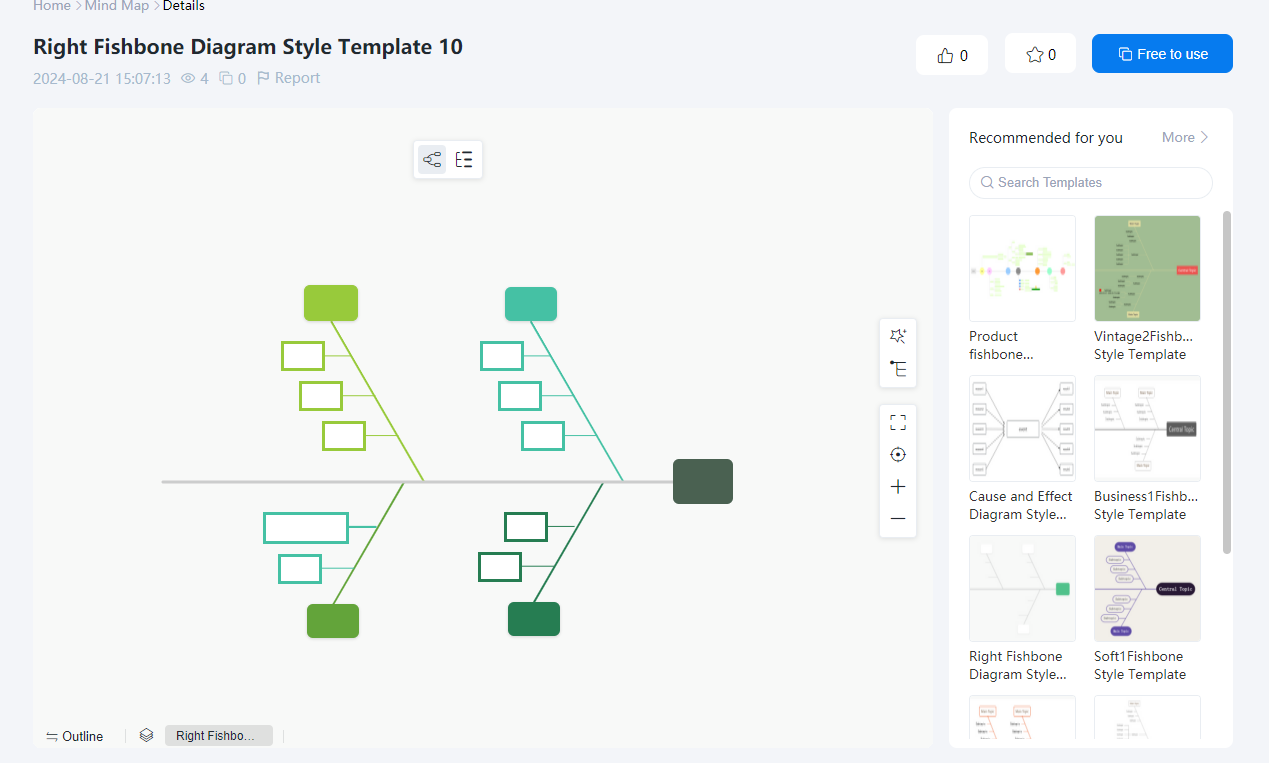
I believe that after reading the above content, everyone has understood that fishbone diagram is an important thinking visualization tool, which not only has a wide range of application scenarios, but also is very simple and convenient to draw. At the same time, in the ProcessOn template community, you can easily clone various fishbone diagram templates, greatly improving work efficiency. Come and use it on ProcessOn now.