An organizational chart, also known as an org chart, is a graphic representation of the departments, positions, and their relationships within an organization. It clearly depicts the organizational hierarchy, responsibility allocation, and information flow path, and is an important tool for understanding and analyzing organizational operations. An organizational chart usually includes boxes (representing departments or positions), lines (indicating superior-subordinate relationships or collaborative relationships), and text descriptions (position names, responsibilities overview, etc.).

Clarify the division of responsibilities: The organizational chart helps employees clearly understand their position in the organization, scope of responsibilities, and collaboration with other departments, thereby promoting work efficiency.
Optimize resource allocation: By analyzing the organizational chart, management can identify uneven resource allocation or redundant departments, thereby making rational adjustments and improving resource utilization efficiency.
Promote communication and collaboration: A clear organizational structure helps reduce communication barriers and promote effective collaboration between departments and employees.
Support decision-making: During organizational change or strategic planning, the organizational chart serves as basic data to provide management with a basis for decision-making .
Improve organizational transparency: Displaying the organizational chart externally can enhance the trust and understanding of the organization among customers, partners and the public.
Functional organizational chart: departments are divided according to functions, such as marketing, sales, production, finance, etc., emphasizing specialization and division of labor and cooperation.
Product-based organizational structure chart: Teams are formed around product lines or projects, and each team is responsible for the full life cycle management of a specific product. It is suitable for organizations with many product types and fast-changing market demands.
Regional organizational structure chart: Divide departments according to geographical locations, such as China, Europe, etc., to facilitate localized management and rapid response to market changes.

Matrix organizational structure chart: Combining the characteristics of functional and product types, it forms a dual chain of command, which not only retains professional division of labor but also emphasizes cross-departmental collaboration, and is suitable for complex and changing environments.
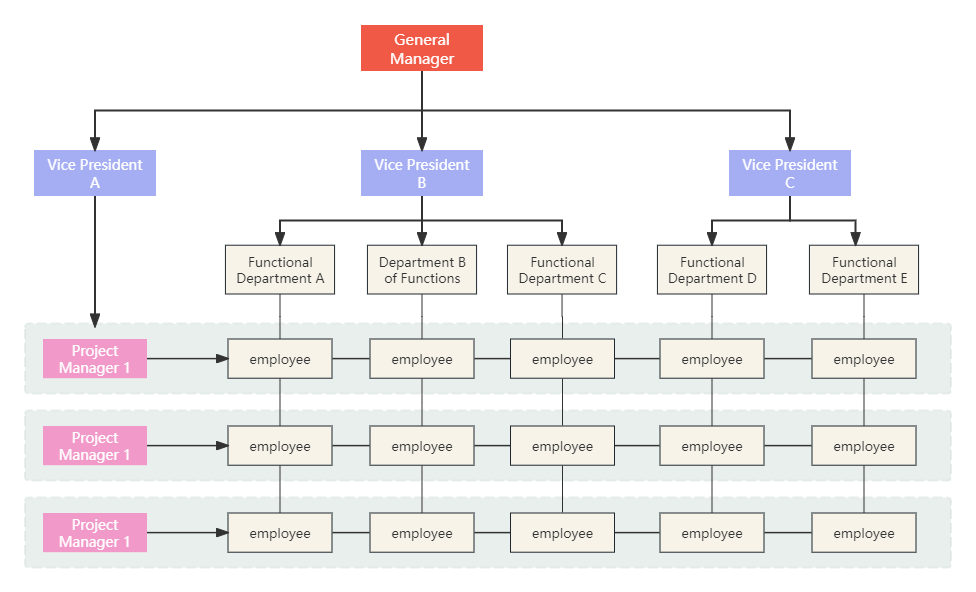
Network organizational chart: centered on projects or tasks, flexible formation of temporary teams across organizations and regions, emphasizing flexibility and rapid response capabilities.
Identify the goal: Clarify the purpose and scope of the organizational chart, such as the entire company, a specific department, or a project team.
Collect information: Collect detailed information about each department and position in the organization through interviews, questionnaires, etc., including names, responsibilities, reporting relationships, etc.
Design layout: Choose an appropriate layout method (such as a tree diagram, flow chart, etc.), and decide whether a hierarchical display is needed based on the size and complexity of the organization.
Draw a chart: Use drawing software or hand-drawing tools to draw an organizational chart according to the designed layout.
Review and Adjustment: Invite the heads of relevant departments to review the content of the chart to ensure accuracy; make necessary adjustments and optimizations based on feedback.
Release and update: The finalized organizational chart will be released to all employees, and a regular update mechanism will be established to reflect the dynamic changes in the organizational structure.
Below, the editor takes ProcessOn as an example to explain how to draw an organizational chart.
ProcessOn's mind map or flowchart both support the drawing of organizational charts. Mind maps have built-in organizational chart structures, which are more convenient to operate. You only need to fill in text and key information; flowcharts have greater freedom in drawing organizational charts and support more personalized editing needs.
1. Mind map to draw an organizational chart
First, enter the ProcessOn personal file page, click New in the upper left corner - Mind Map, enter the editor, click "Structure" in the right toolbar, and switch to the organizational chart structure. Double-click the canvas /Enter key to add a main branch , such as Marketing Department, Product Department, Human Resources Department, etc., and use the Tab key to add a sub -branch under the main branch .
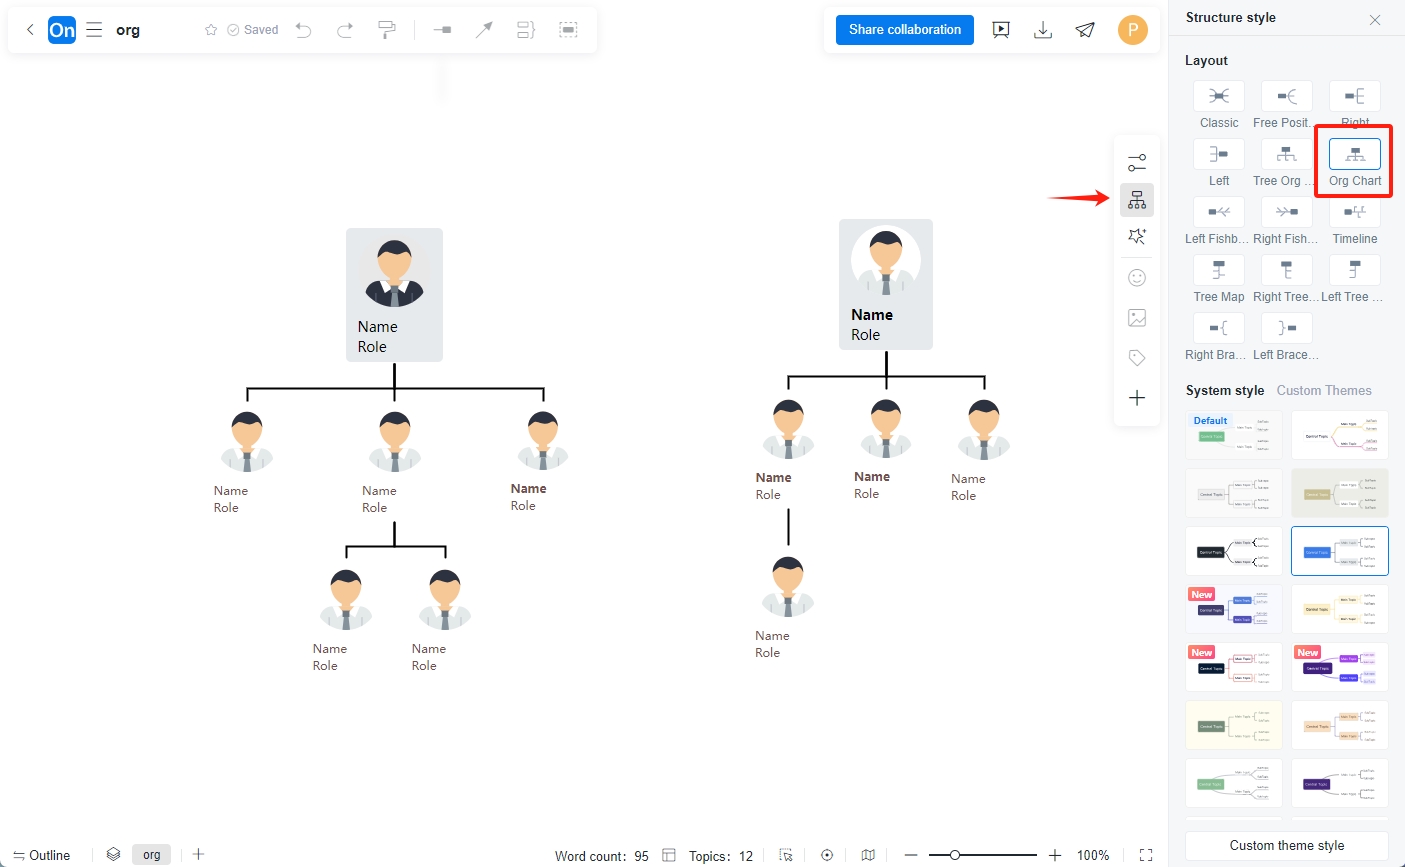
You can insert elements such as icons or pictures into branches to enrich the visibility and appearance of the organizational chart .
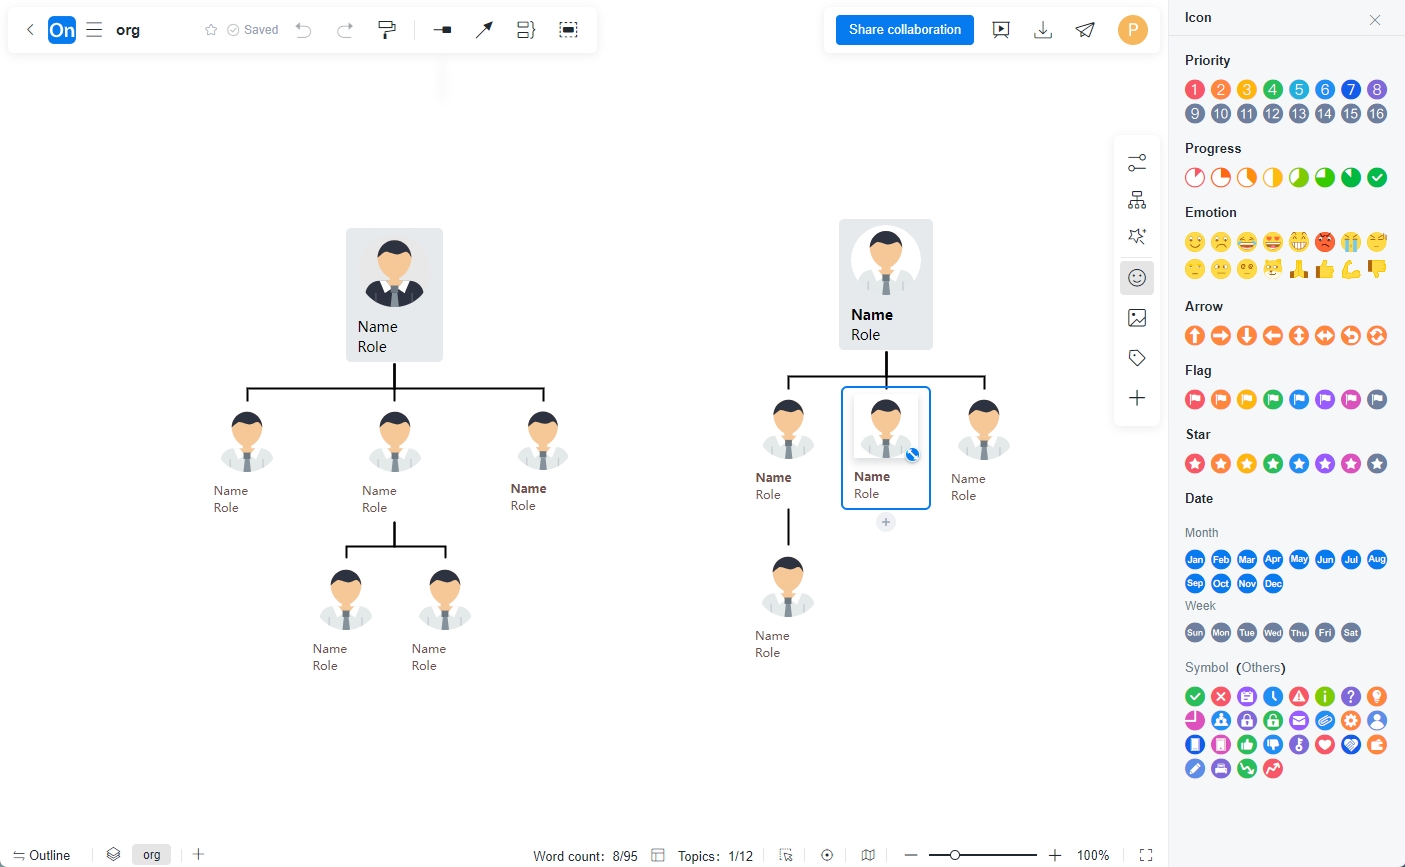
using mind mapping to draw an organizational chart is that it is simple and efficient. The structure of the organizational chart has been fixed for you in the mind map editor . You only need to use shortcut keys to continuously create multi-level organizational chart nodes without excessive layout.
2. Draw a flowchart and an organizational chart
First, go to the ProcessOn personal file page and click New - Flowchart in the upper left corner.
Drag arrows, circles and other elements from the graphics library on the left to the canvas, and assemble them into an organizational chart according to your needs .
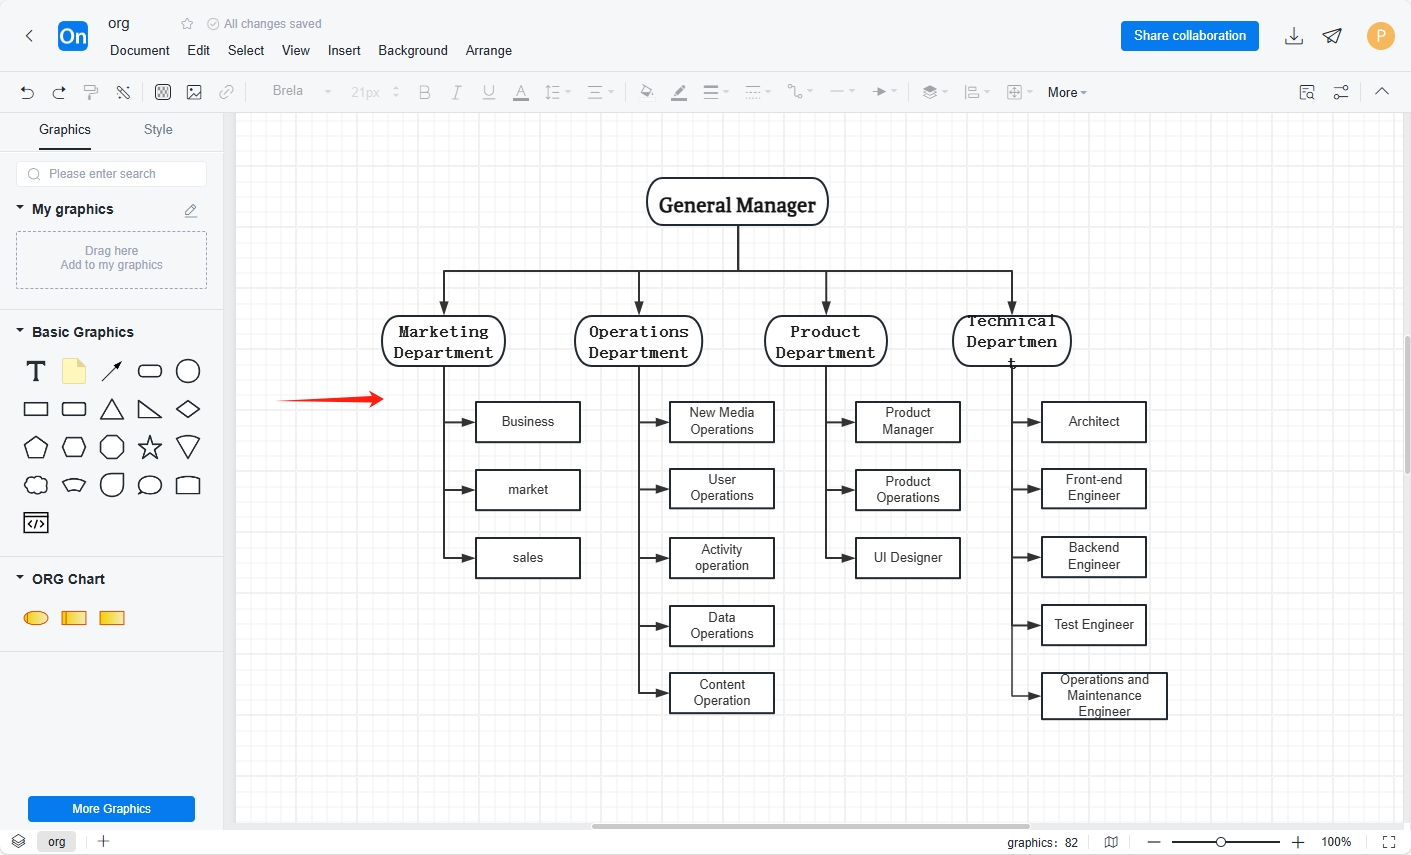
The top toolbar supports modifying the styles of text, graphics, and lines, including font, font size, color, etc.
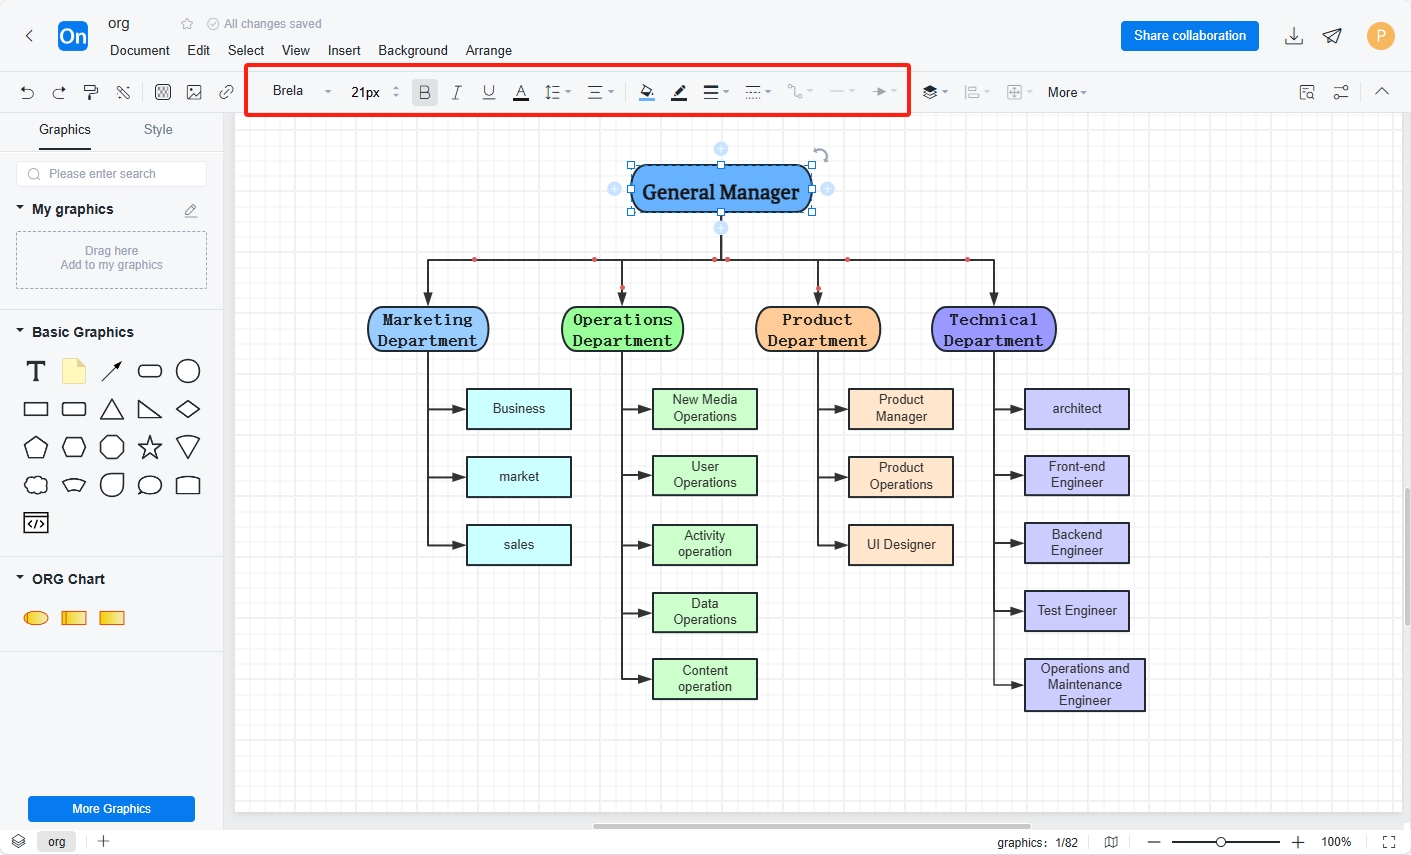
using flowcharts to draw organizational charts is that it provides a large number of icons, and the drawing process is very free, so organizational charts with complex layouts or styles can be completed .
After reading the above article, I believe you have a deep understanding of the concept and drawing method of organizational structure chart . Then come and experience making an organizational structure chart ! → Draw an organizational structure chart .