

Swimlane Diagram, also known as cross-functional flow diagram, aims to analyze and show different processes of various departments on the same task process, and clarify the stage of the process link, the person in charge of the process link, the organization or department. The origin of the name of the lane chart is the division of functional departments in the flow chart, which is similar to the swimming pool lane.
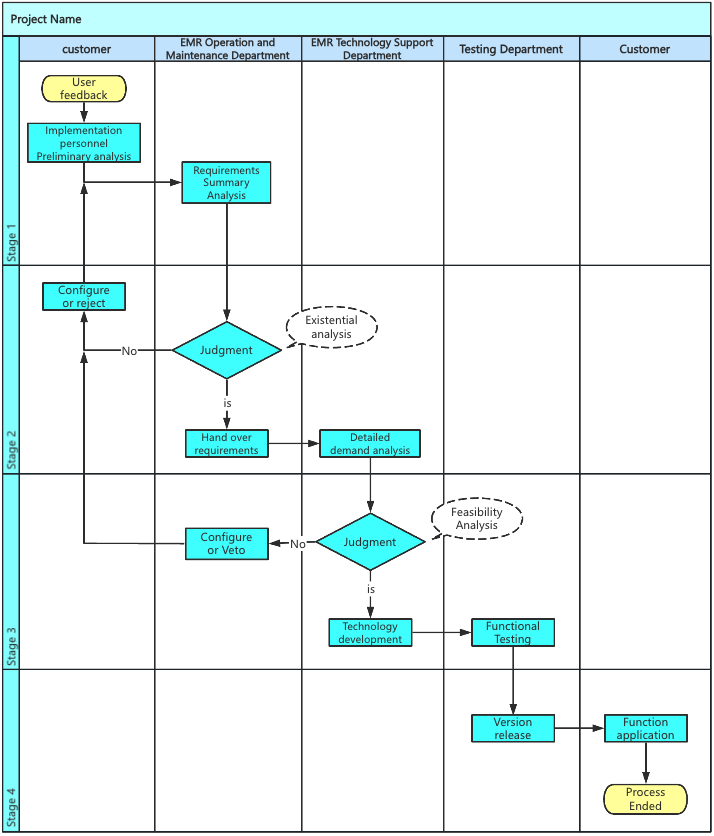
The lane chart can clearly reflect the relationship between the different functions of the enterprise, so that each department can define its own task scope, and identify what needs to be done at each stage. For enterprises, the lane map can make the work deployment more streamlined and improve work efficiency.
According to the direction of the lane placement, it can be divided into vertical lane diagram and horizontal lane diagram.
The lane is placed perpendicular to the canvas, which is the vertical lane diagram; The lanes are placed horizontally on the canvas, which is a horizontal lane diagram. In the actual drawing, there is not much difference between the two typesetting, you can choose according to your preference.
1) Pool: The pool is an external frame of the lane diagram, and the lane and process are included in the pool.
2) Swimming lanes: Multiple lanes can be created in the pool.
3) Process: actual business process.
4) Dimension: The dimension of the lane diagram, as explained below.
1) Department dimension: It is distinguished by departments or responsibilities, and the tasks that each department is responsible for are clearly defined.
2) Stage dimension: It is distinguished by task stages, and the task links that need to be handled in each stage are clearly defined. For example: before sale - during sale - after sale.
3) Activity dimension: can be understood as each task on the flowchart. The basic flow chart contains only the activity dimension, while the lane chart adds two more dimensions to this, namely departments and stages. The phase dimension is added or not depending on the situation.
Before drawing, clarify the following questions:
1) Which departments or roles are involved in the process?
2) What are the relationships between these departments or roles?
3) Where does the process begin and end?
4) What is the end result of the process?
5) What is the main line flow and sequence?
6) Do you need to add a phase dimension?
Step 1: Open the ProcessOn personal file page and create a new flowchart
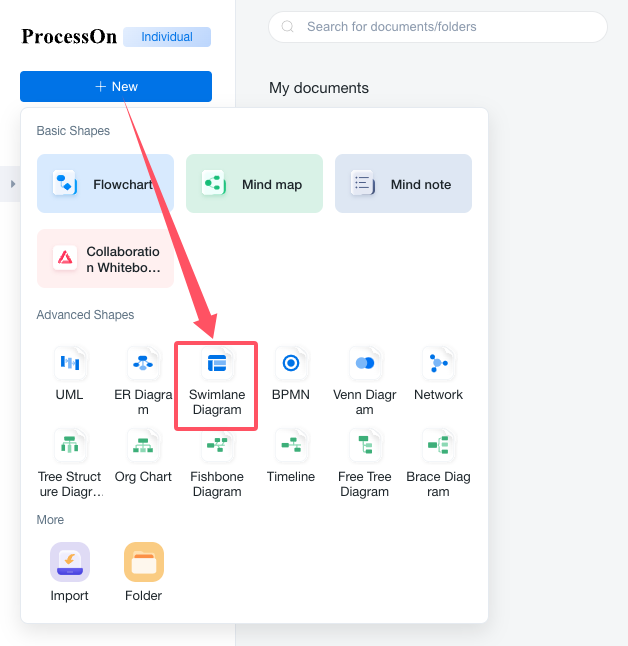
New "Lane Map"
Step 2: drag the pool + lane graphics to the canvas
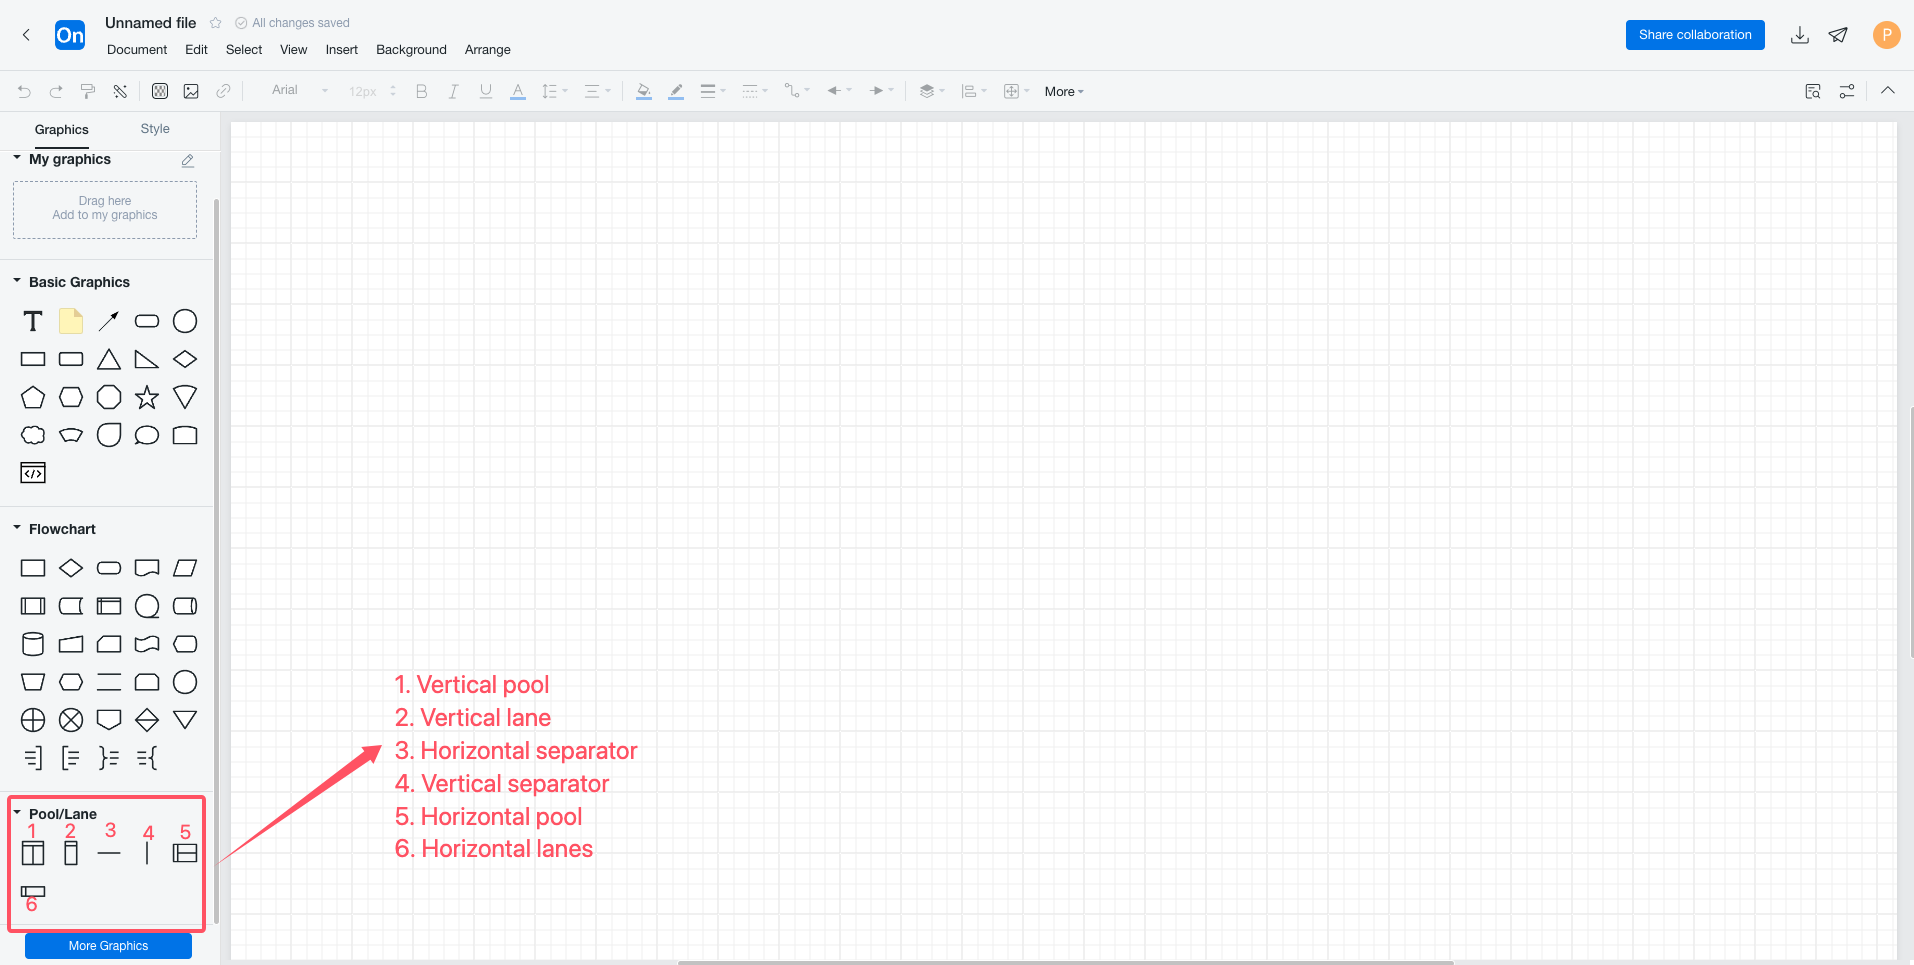
Lane diagram graphic element
1) Drag a pool to the canvas, then drag a lane to the pool, and the lane will automatically merge into the pool.
2) Drag multiple lanes into the pool to create multiple lanes.
3) Use delimiters to create another dimension, which can be used or not depending on the situation.
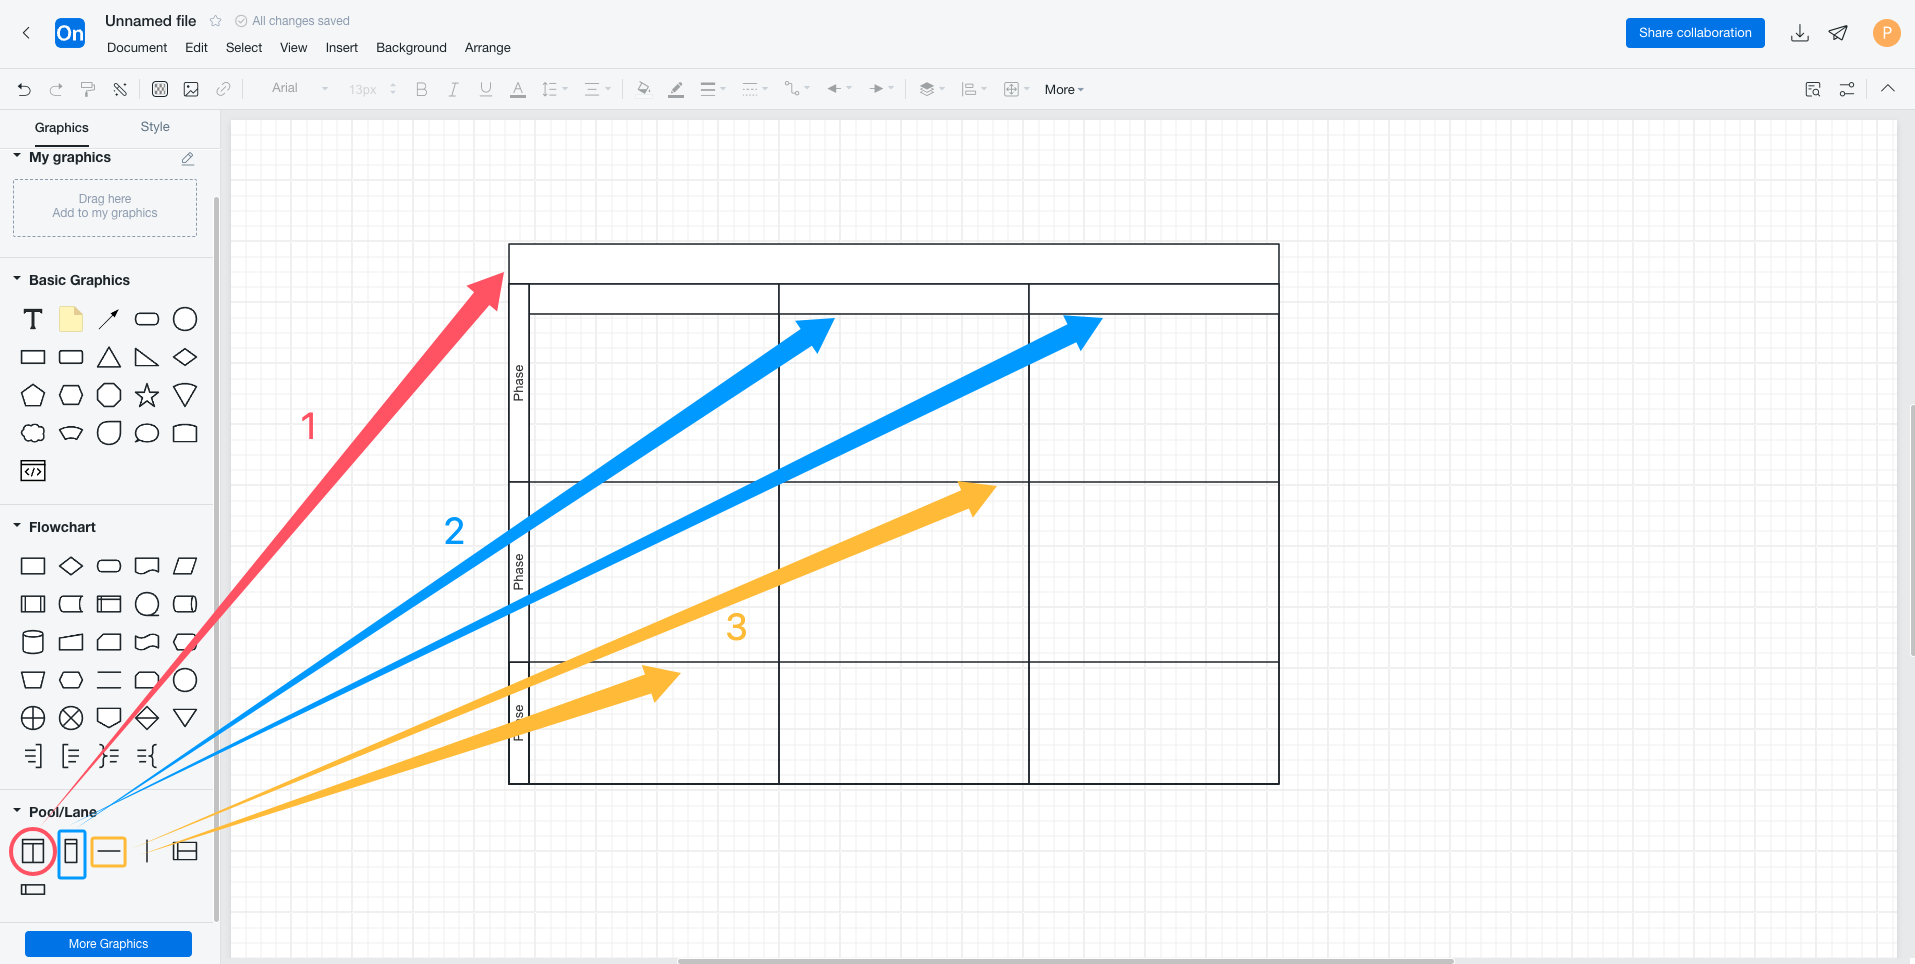
Drag pool and lane map
Tips:
Tip1: Vertical pool, vertical lane, horizontal separator is a group, horizontal pool, horizontal lane, vertical separator is a group, do not mix oh.
Tip2: Dragging the lane directly onto the canvas automatically creates a pool.
Tip3: Select the pool title and a toolbar will appear to quickly adjust the number of lanes.
Step 3: Add a title for the lane
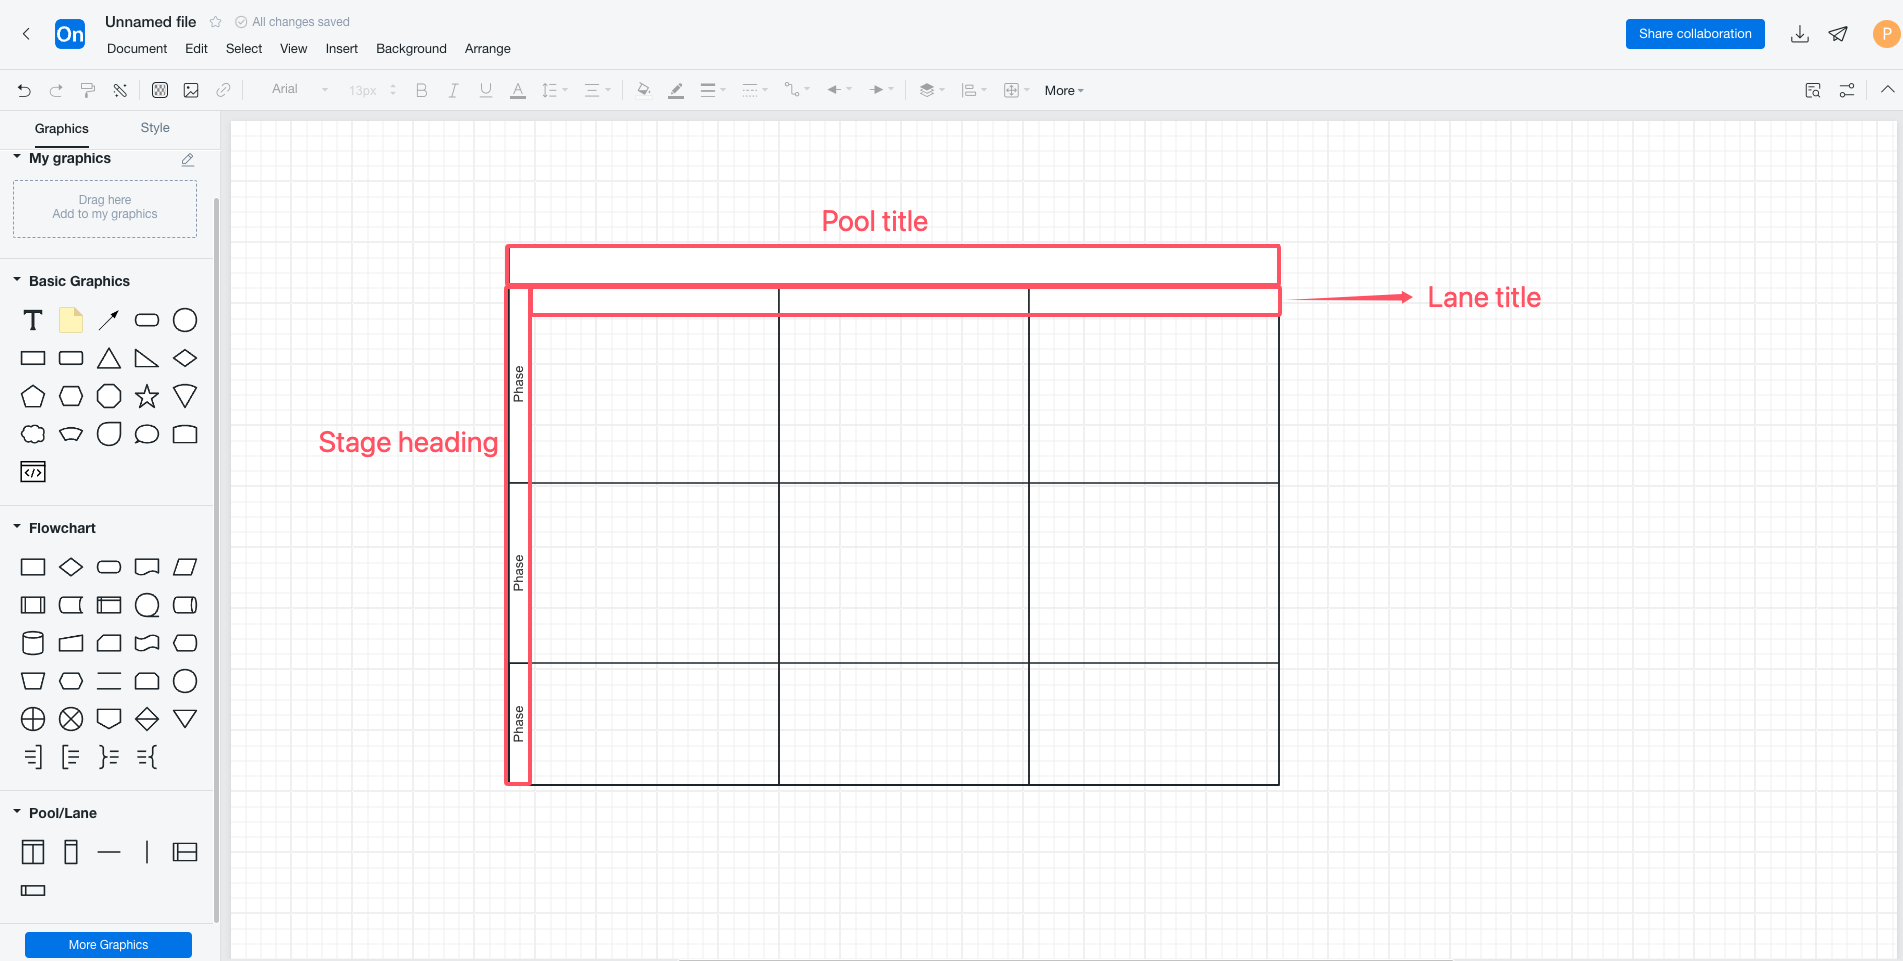
The lane chart title indicates
Double-click on the title to add or modify the pool title, lane title, and stage title (if any). The lane title and stage title are generally the department name and stage name, and the content of the two titles can be interchanged and can be customized by the enterprise.
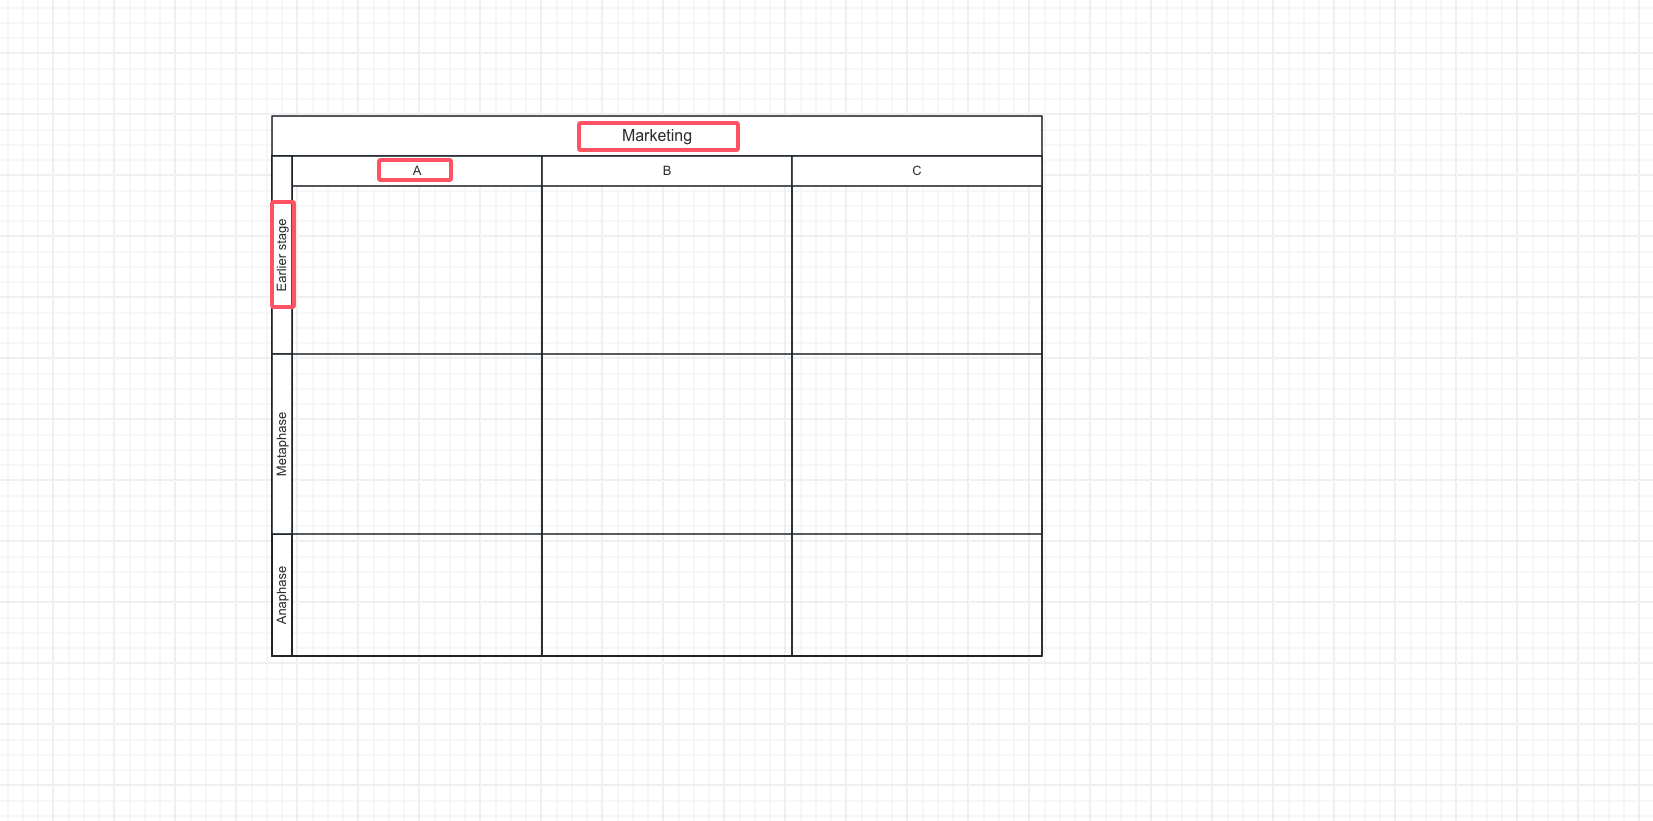
Lane map to modify the title of the schematic
Step 4: Drag and drop the graph to create the process
Follow the diagram to create the process, but make sure that each step of the process corresponds to the department and stage (if any).
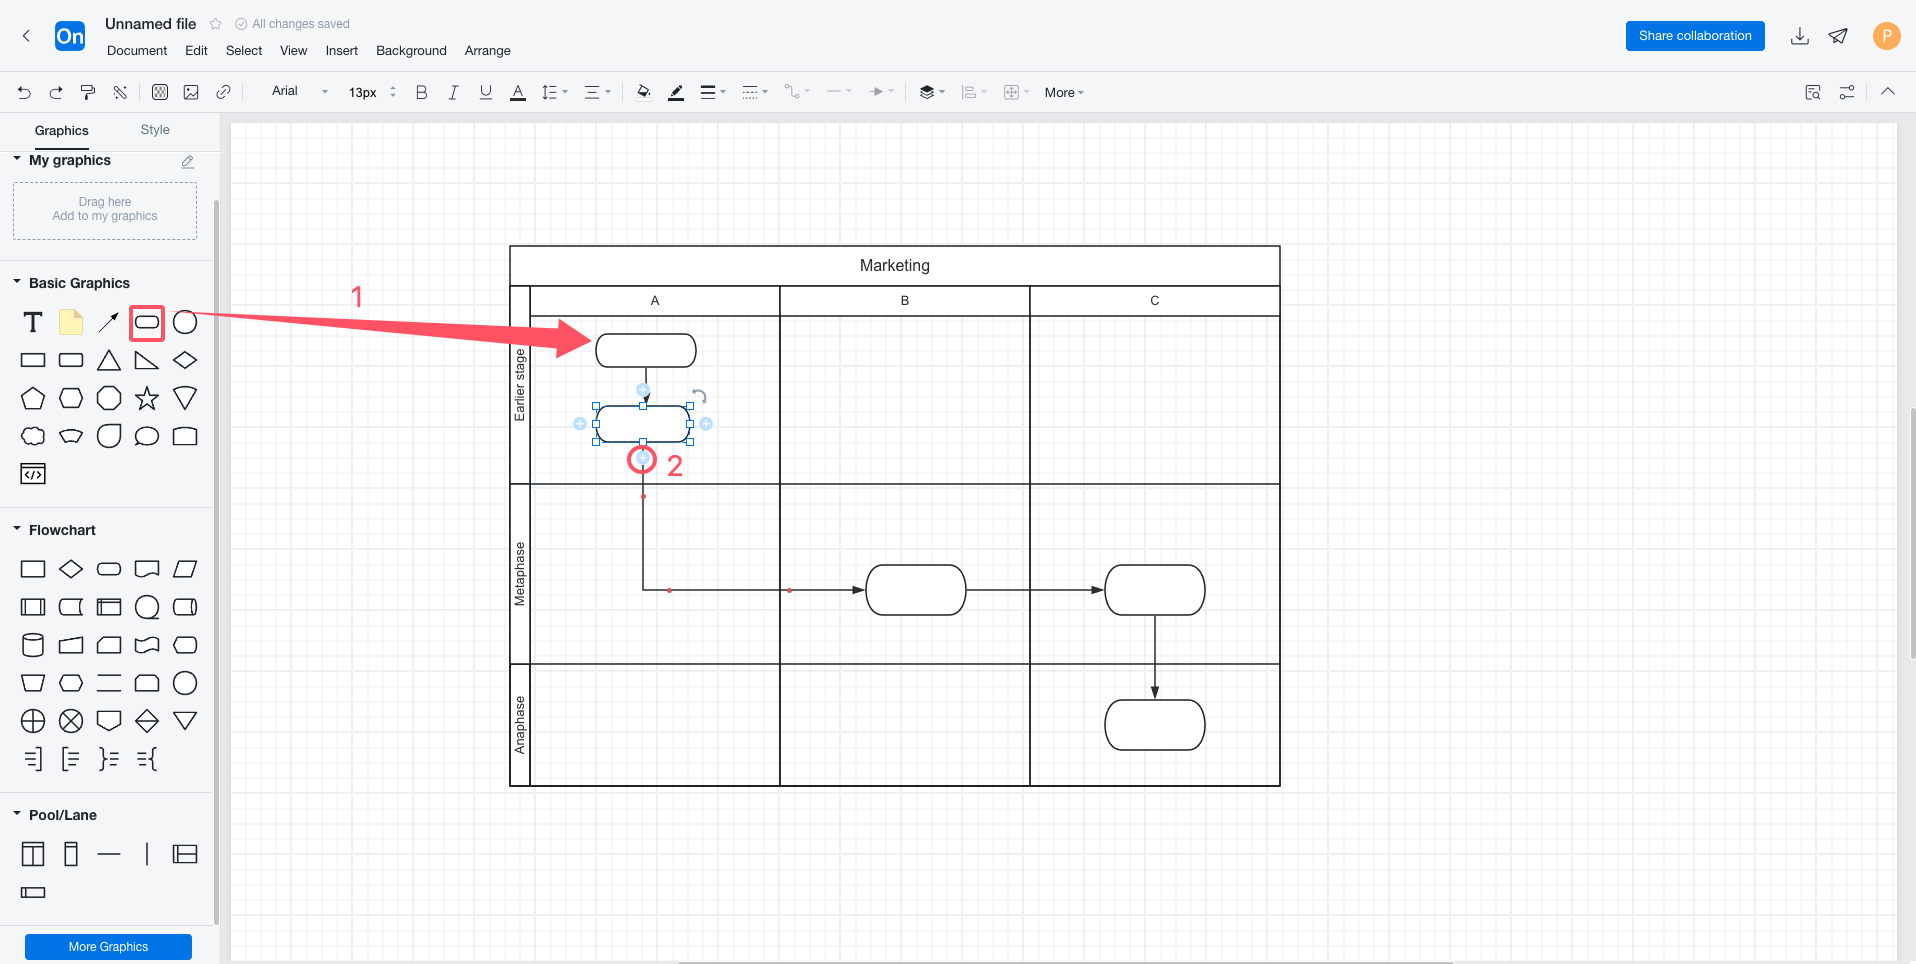
Establish the flow diagram of lane diagram
Step 5: Lane diagram adjustment and style
1) Adjust the width of the lane: Click on the title of the lane to be adjusted, that is, the lane will be selected, and drag the surrounding control points to adjust.
2) Adjust the width of the stage: Click on the title of the stage to be adjusted, that is, the stage will be selected, and drag the surrounding control points to adjust.
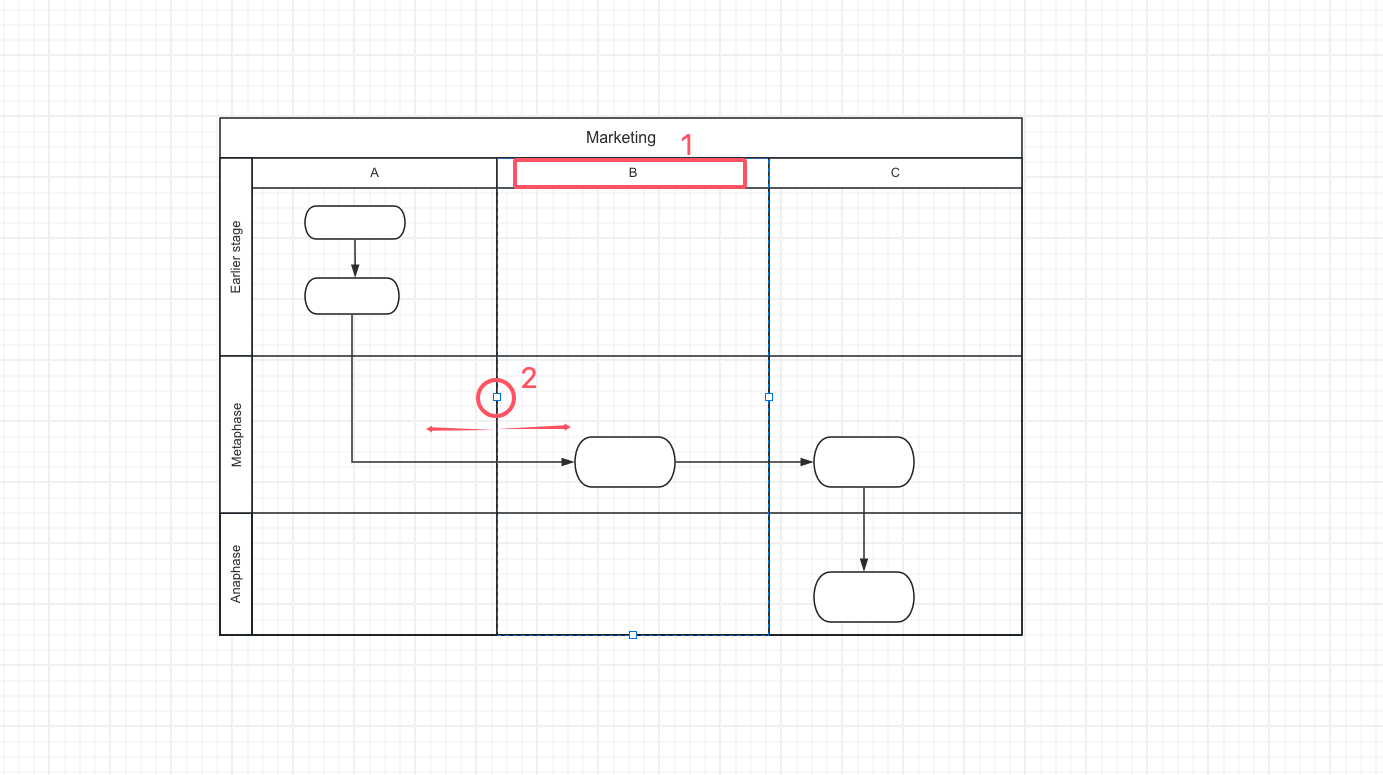
Adjust lane/stage width signals
3) Add a lane: Drag the lane to the pool.
4) Add phase: Drag the separator onto the pool.
5) Delete the lane/stage: Click the lane/stage title and press Delete.
Tips:
By adding stages with delimiters, there will be an additional "stage" at the bottom that cannot be renamed. We can hide this by "putting it away" by clicking on the pool title and dragging the control point.
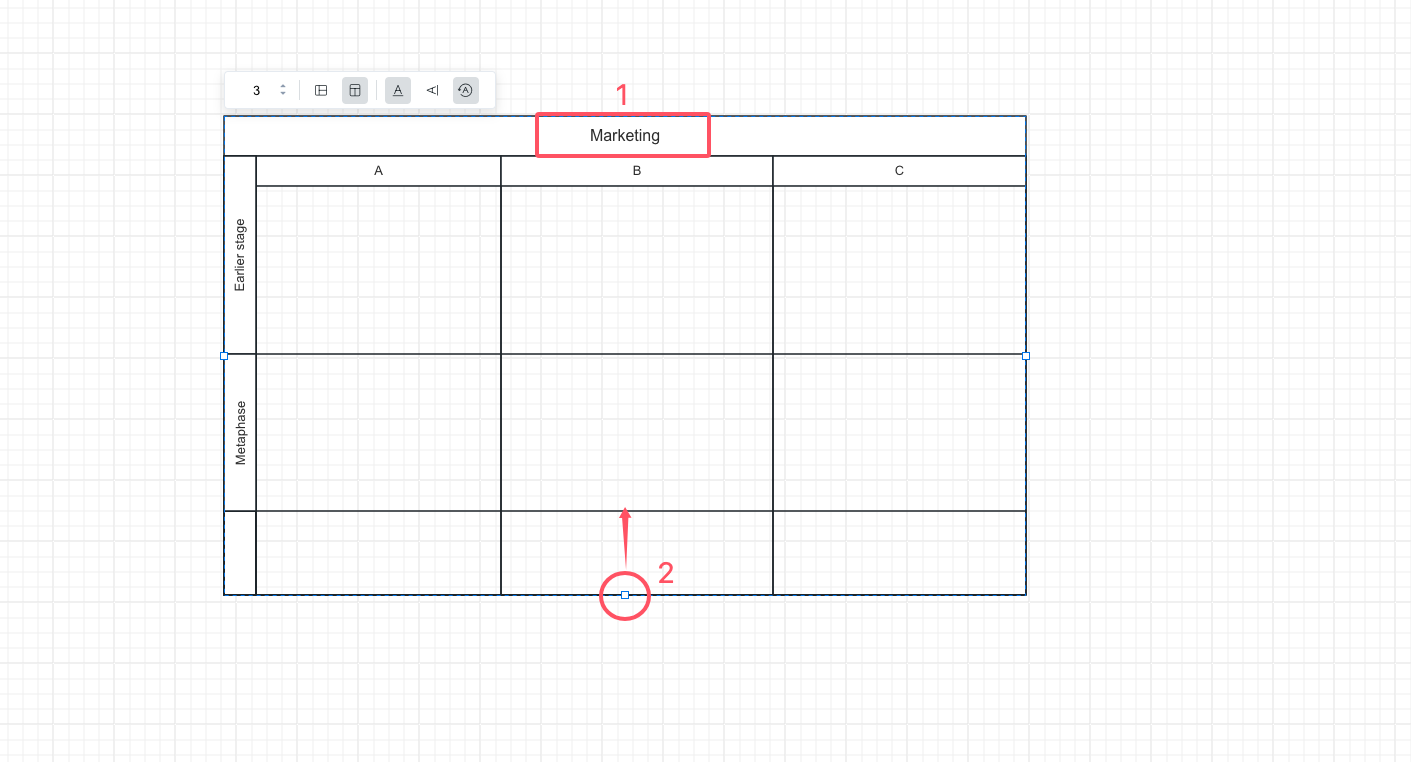
Hide unnameable phase gesture
6) Modify the style: Select the lane/stage title, you can modify the style, such as fill color, font size, etc.
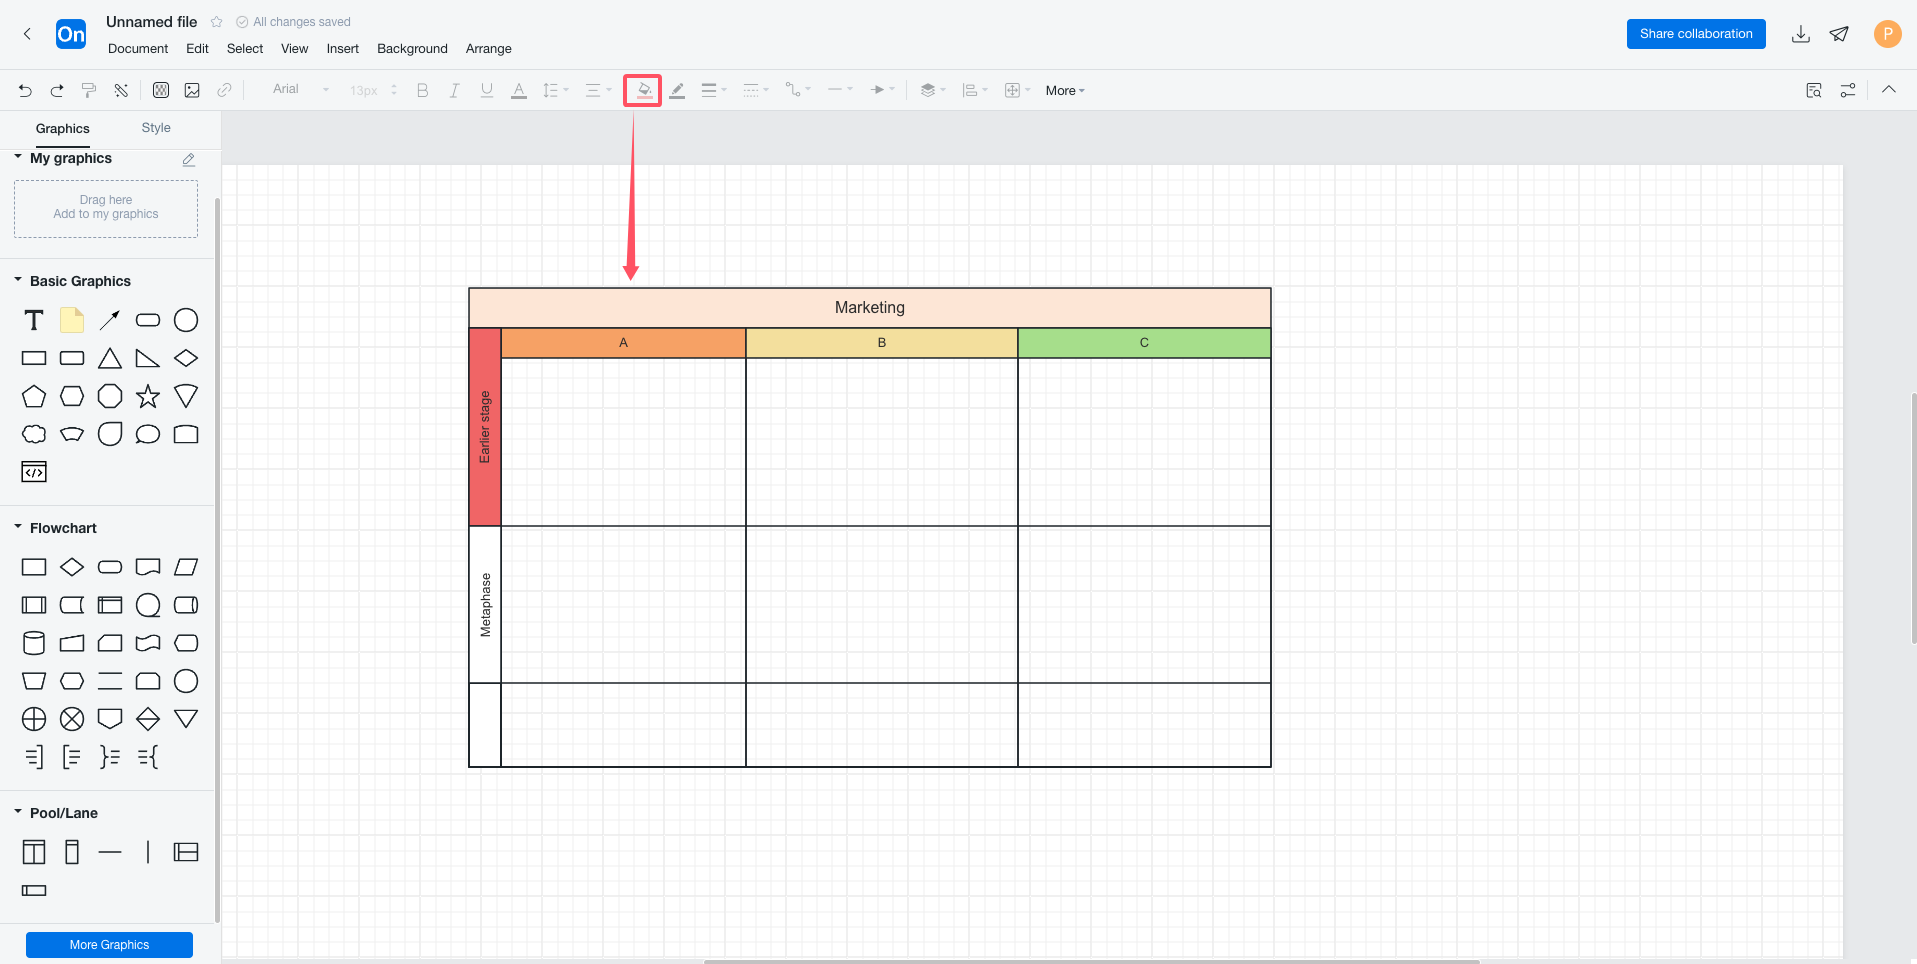
Lane diagram modified style schematic
The above is a complete lane diagram drawn by ProcessOn flowchart, follow the tutorial to try it out.
1) The dimension of the lane diagram should not be too specific, such as specific to a person, so that the subsequent personnel changes may need to readjust the process, generally specific to departments, posts, roles.
2) The expression in the same dimension should be unified, such as the department dimension, not some posts and some departments.
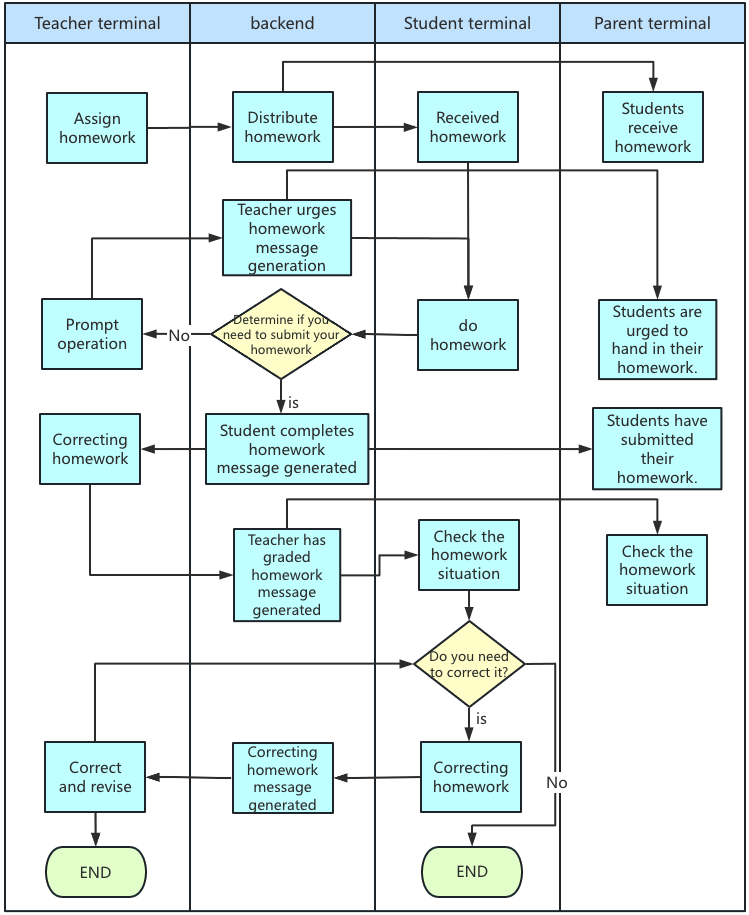
Operating system swim lane diagram
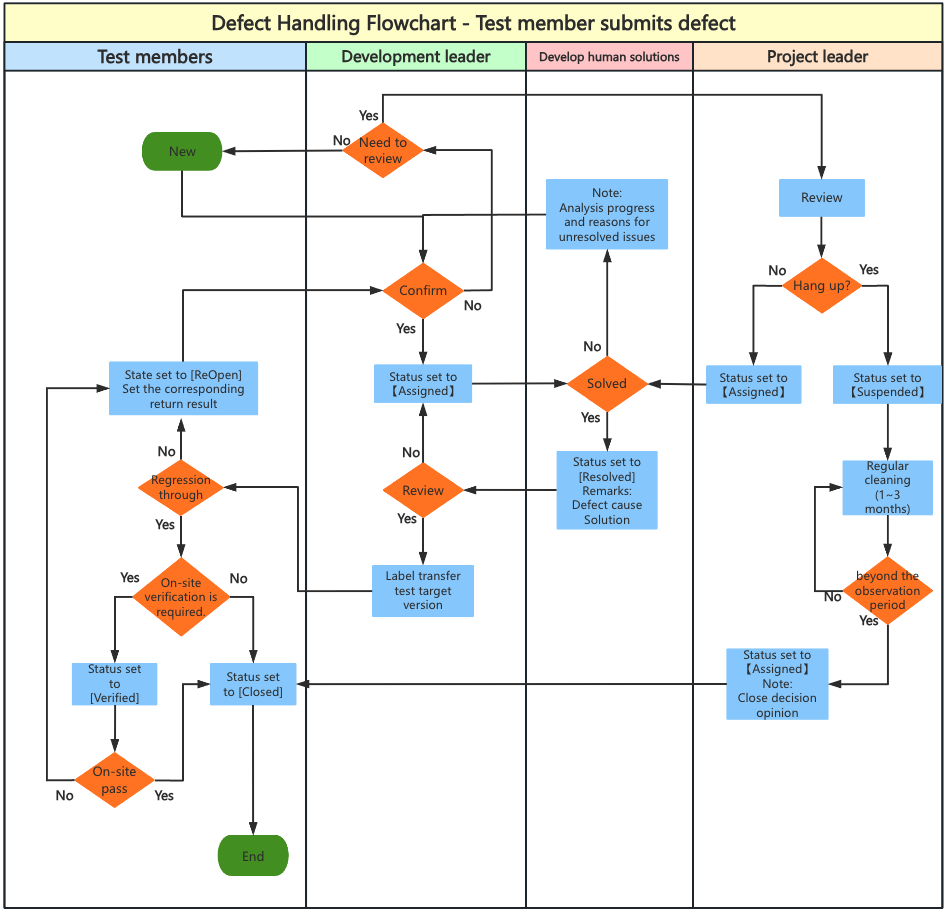
Defect Handling Flowchart +-+ Test member submits defect +-+Cedar
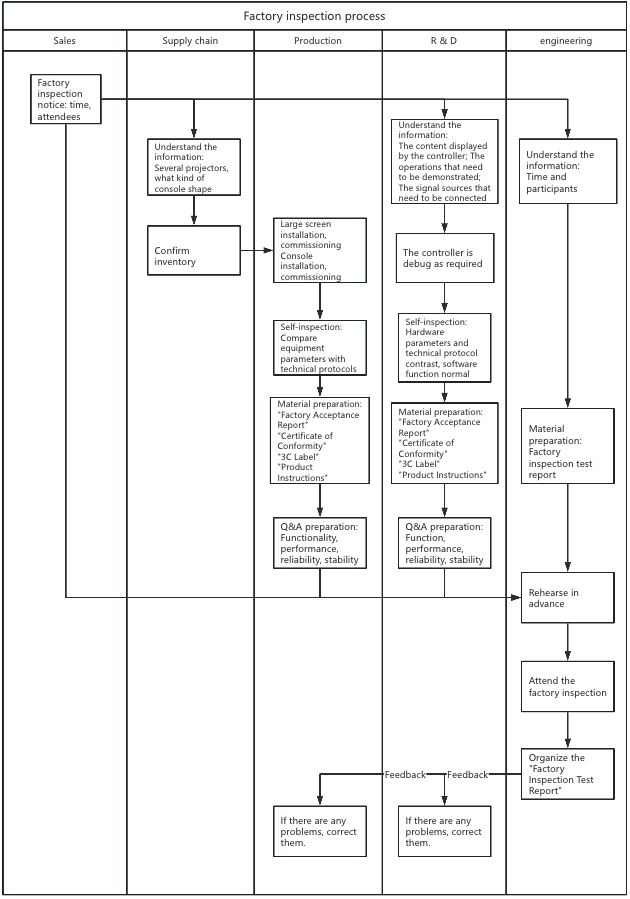
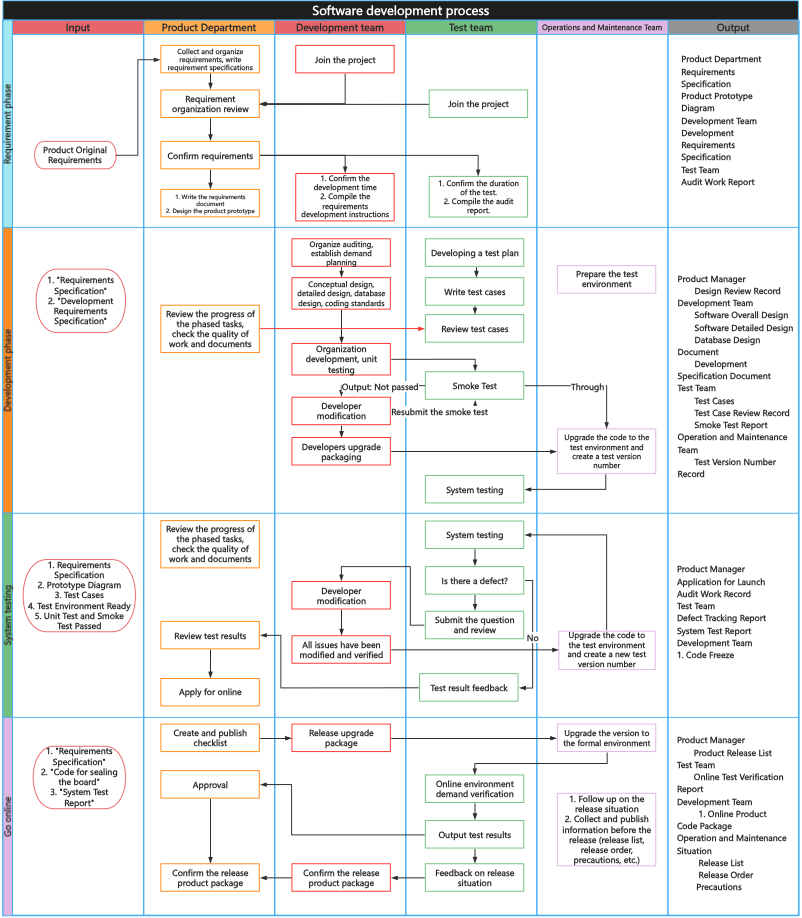
Software development flow chart (Lane chart)
I believe that through the above introduction and teaching, everyone has mastered the production method of the swim lane diagram, and we can sort out the cross-department business process of the enterprise into the swim lane diagram, clarify the responsibilities of each department, discover and solve problems, and constantly optimize the process.