In the field of project management, an efficient and intuitive tool, the PERT chart (Program Evaluation and Review Technique), is increasingly favored by project managers and teams. This article will detail the meaning of the PERT chart, its application in project management, specific examples, and how to use the PERT chart maker to improve project efficiency .
PERT chart, also known as "Program Evaluation and Review Technique", is a tool specifically used for project management, especially for time estimation and analysis of complex projects. It graphically displays the schedule, dependencies and duration of each activity in the project, helping project managers predict the completion time of the project and identify the critical path.
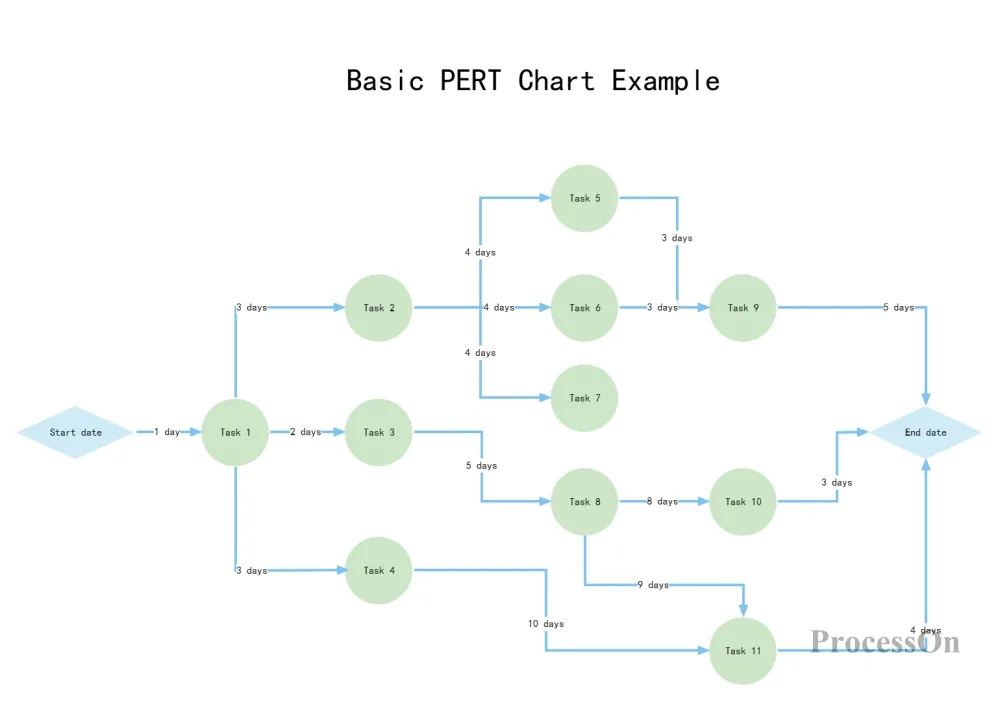
1. Node: represents a key time point or milestone in a project, usually represented by a circle or rectangle and marked with an event number. A node is the start or end point of a project activity and does not consume time or resources.
2. Arrow: An arrow connecting two nodes represents an activity, which indicates a task that needs to be completed. The direction of the arrow indicates the time direction of the activity.
3. Time Estimates: In a PERT chart, each activity will have three time estimates:
Optimistic time (O): The shortest time required to complete a task if everything goes well.
Pessimistic time (P): The maximum time required to complete a task, taking into account all possible delays.
required to complete a task under normal circumstances .
From these time estimates, the expected completion time (expected time) of the activity can be calculated, usually using a specific formula that gives a reasonable time estimate by giving more weight to the most likely time.
Estimated time: TE=(O+4M+P)/6
4. Critical Path:
Definition: The longest path in the PERT chart is called the critical path, which determines the shortest completion time of the project.
Features: Activities on the critical path cannot be delayed, otherwise the completion time of the entire project will be delayed.
Importance: Managing critical path activities is essential to ensuring that projects are completed on time.
PERT chart (Project Evaluation and Review Technique) and Gantt chart are commonly used visualization tools in project management. PERT chart is a directed graph to describe the task network of a project. It can clearly show the dependencies between tasks and help project managers better understand the project structure.
A Gantt chart is a horizontal bar chart that describes project tasks based on a calendar. The horizontal axis represents time, the vertical axis represents tasks, and the horizontal line segments represent the schedule of tasks. With a Gantt chart, project managers can easily track the progress and schedule of tasks.
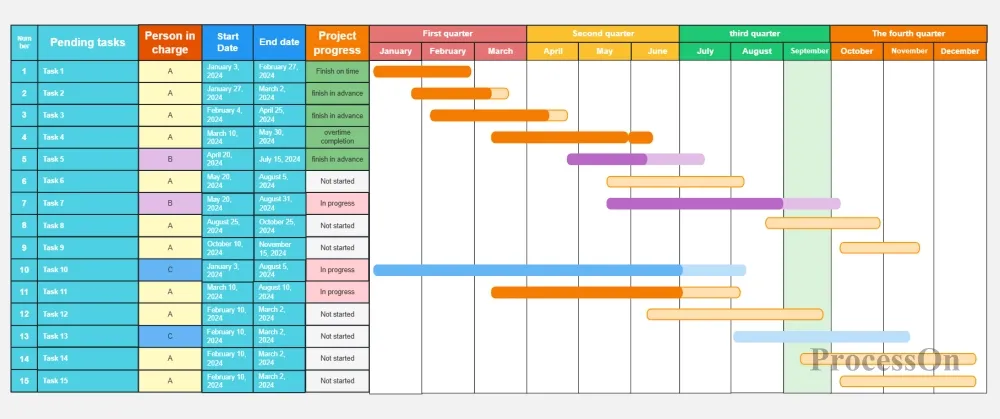
The PERT chart focuses on the dependencies between activities and the critical path analysis. It gives the start time, end time, and required time of each task, and reveals which tasks must be completed before other tasks can be started. In addition, the PERT chart can also analyze the slack time between tasks, that is, how much room for maneuver there is to complete a task without affecting the entire construction period. Tasks with slack time of 0 constitute the critical path to complete the entire project. This makes the PERT chart very suitable for complex projects , especially those that require precise analysis of task dependencies and critical paths. However, the PERT chart cannot reflect the parallel relationship between tasks and is more difficult to understand than the Gantt chart.
The Gantt chart focuses more on time management and progress tracking of tasks. It can intuitively show when the task is scheduled to be carried out, and the comparison between the actual progress and the planned requirements. Gantt charts are simple, eye-catching and easy to compile, and are widely used in corporate management. However, Gantt charts focus mainly on process management (time) and pay less attention to aspects such as cost and resources. In addition, if there are too many relationships in the project, the complicated line chart may increase the difficulty of reading the Gantt chart. Gantt charts are more suitable for projects with clear tasks and simple sequences.
In actual applications, project managers may use both tools to manage projects more effectively based on the characteristics and needs of the project. For example, in the early stages of a project, a PERT chart can be used to analyze task dependencies and critical paths, while during the project execution, a Gantt chart can be used to track the progress and schedule of tasks.
The following example shows how to use the PERT chart for time management and critical path analysis in a hypothetical project.
Assume a software development project with the following activities:
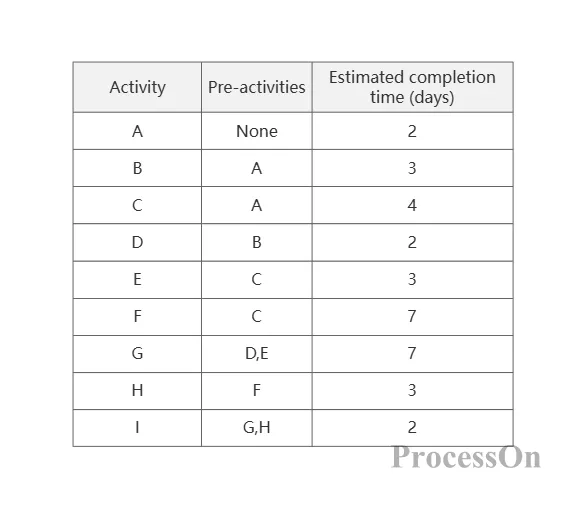
The PERT chart is as follows :
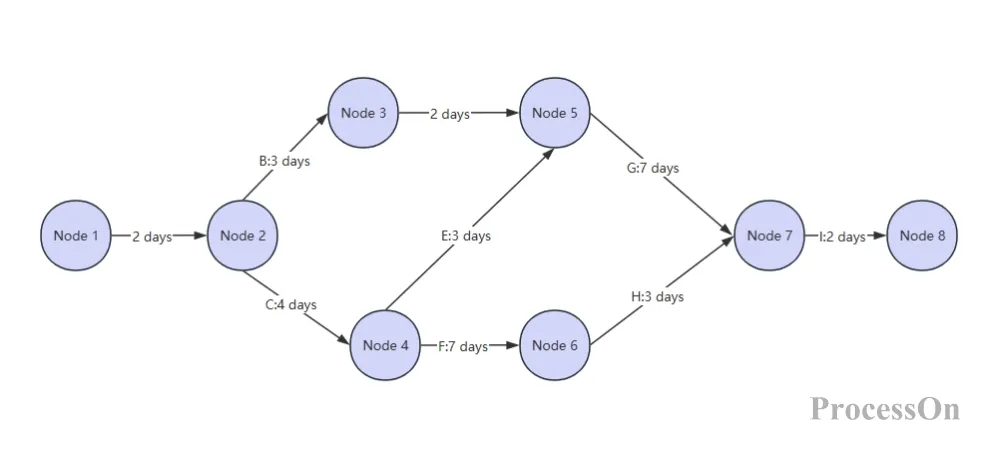
In this example, arrows represent the sequence and dependencies of activities, and nodes represent the start or end points of activities. The project manager assigns time estimates to each activity and calculates the expected time for each activity, thereby identifying the critical path and developing a corresponding schedule.
Calculation Path and Critical Path
Path 1: A→B→D→G→I, time: 2+3+2+7+2=16 days
Path 2: A→C→E→G→I, time: 2+4+3+7+2=18 days
Path 3: A→C→F→H→I, time: 2+4+7+3+2=18 days
In the above example, there are 3 paths in total. Paths 2 and 3 take the longest time, taking 18 days, so paths 2 and 3 are critical paths.
There are many tools for drawing PERT charts, and it is very important to choose a tool that suits your needs. Common tools include Visio, Word, ProcessOn, etc. Users can choose the appropriate PERT chart maker according to their needs. Here we mainly explain how to use ProcessOn to make a PERT chart.
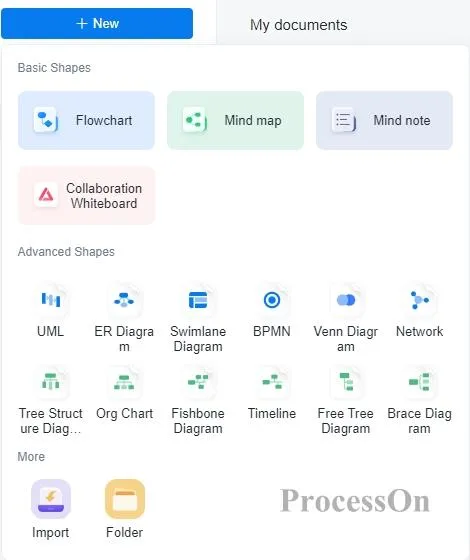
1. Open ProcessOn official website, enter the personal file page, click New to create a flowchart.
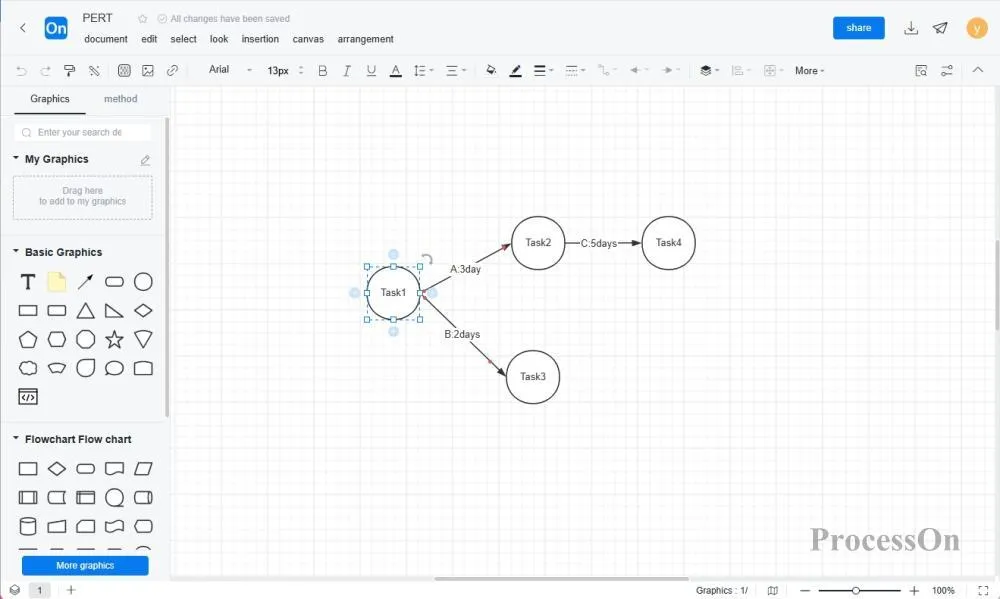
2. Drag the rectangle or circle symbol from the graphics library on the left side of the maker to the canvas, double-click the graphic to add text, and click the "+" on the graphic to create lines between the graphics.
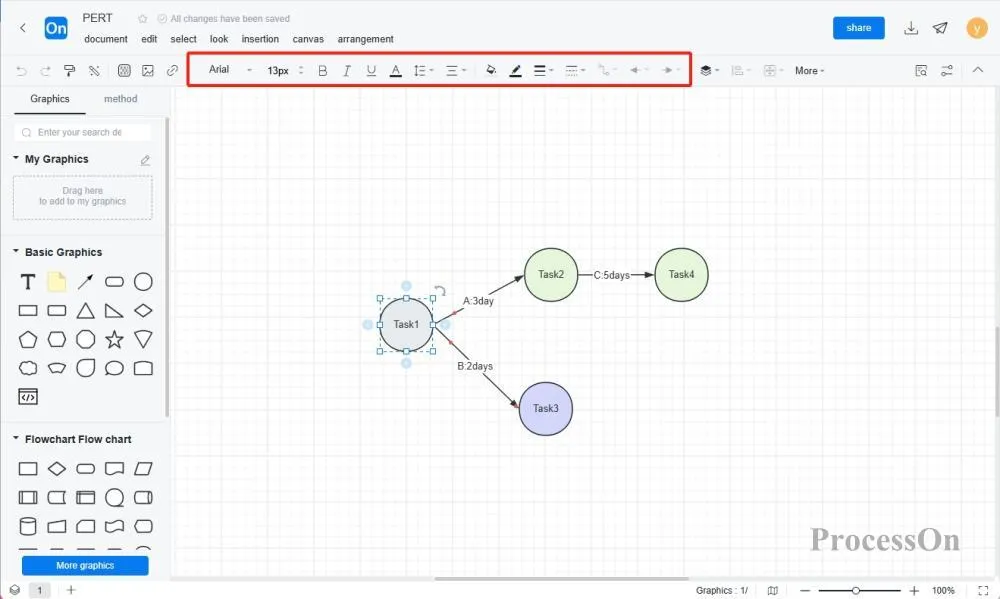
3. Select the graphic and use the top toolbar to set the text style and line style.
ProcessOn can be used for free , and the process of drawing PERT charts is more convenient than Word. At the same time, ProcessOn also supports drawing flowcharts, UML diagrams, network topology diagrams, mind maps and other graphics, and supports team collaboration to jointly view and edit files.
Here are some PERT chart templates in ProcessOn
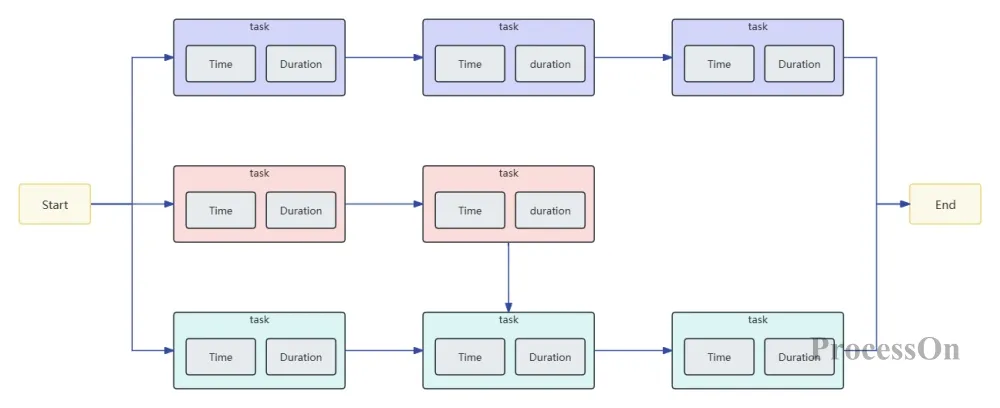
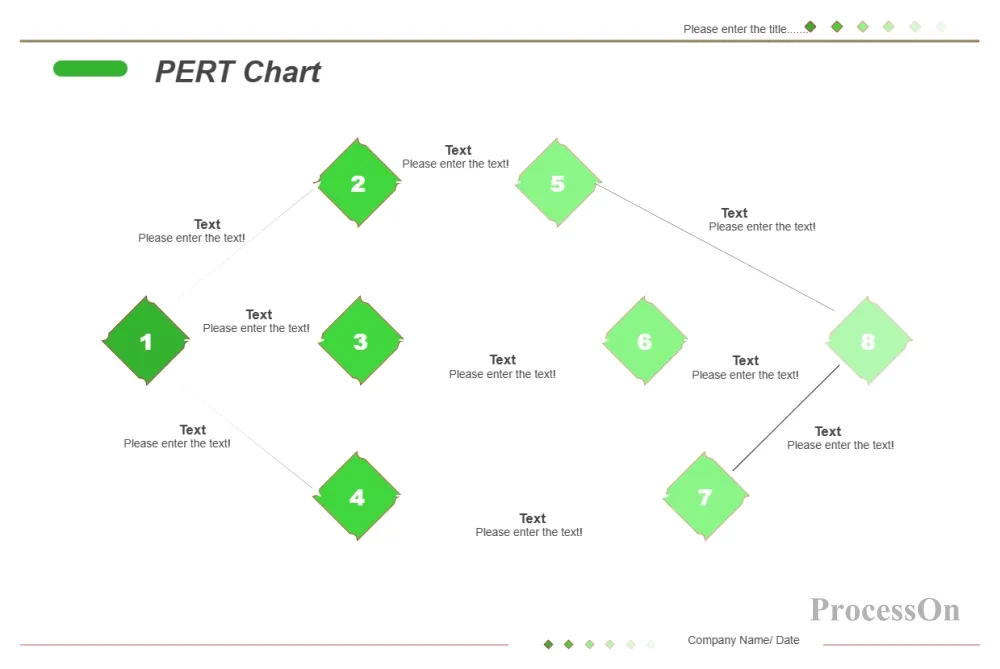
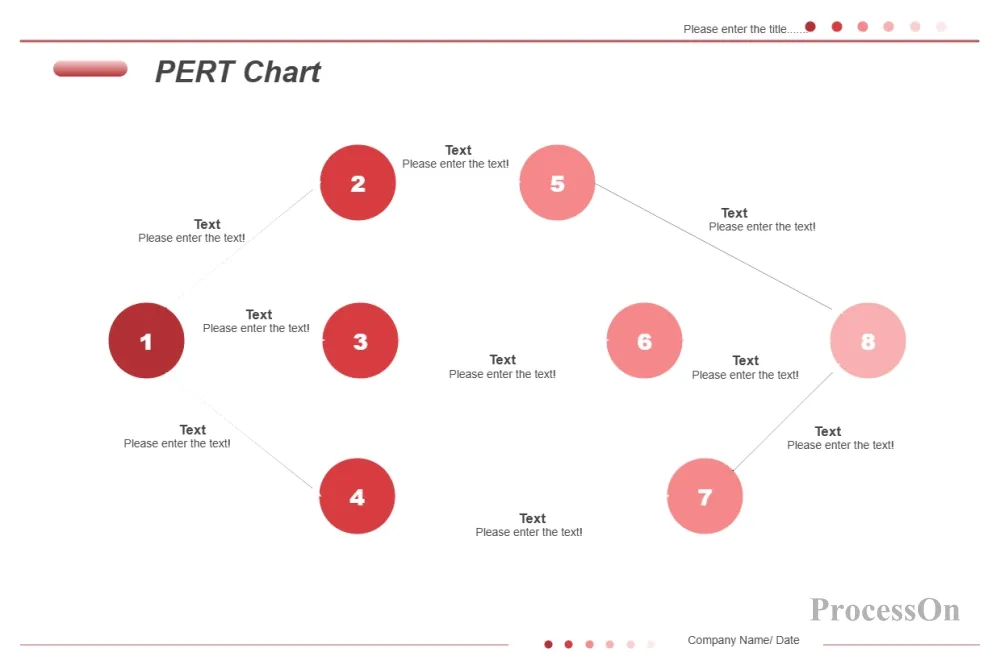
The above is the relevant content of PERT chart. As a powerful tool for project management, PERT chart can help project managers better plan and control project progress, thereby ensuring the smooth progress of the project. Through the introduction of this article, I believe you have a deeper understanding of PERT chart. If you are looking for an efficient project management tool, you might as well try PERT chart and create your project plan with the help of professional PERT chart maker - ProcessOn .