Gantt chart is also called bar chart or bar chart. It was invented during World War I and named after Henry I. Gantt , who developed a complete system of marking progress using bar charts . The Gantt chart has a simple idea, which is to graphically represent the sequence and duration of activities for any particular project through a list of activities and a time scale. It is basically a line chart , with the horizontal axis representing time, the vertical axis representing activities (projects), and the line representing the planned and actual completion of activities over the entire period. It intuitively shows when the task is planned to be carried out and the comparison between the actual progress and the planned requirements. Managers can easily find out what work is left to do on a task (project) and can evaluate the progress of the work. It is a project management tool that every project manager and PMO must master .
In short, the Gantt chart uses bar charts to show the internal relationship between the progress of projects, schedules and other time-related systems over time. Through the Gantt chart, you can get the start and end time of the plan, understand what work is in a period of time, what can be done at the same time , how many tasks there are, and how much needs to be completed .
1. Determine project tasks: You should first clarify your project goals, and then use this as a basis to determine the tasks that need to be completed.
2. Determine the order of tasks: Once you have determined the task list, you need to determine the dependencies between tasks .
3. Estimate the time required for each task: For each task , estimate the time required to complete it as accurately as possible.
4. Create a Gantt chart: With the above information, you can start creating a Gantt chart. Represent time on the horizontal axis and list tasks on the vertical axis.
5. Adjust the Gantt chart : After drawing, make changes and adjustments at any time according to the progress of the project.
Next, we will use ProcessOn flowchart as an example to draw a Gantt chart :
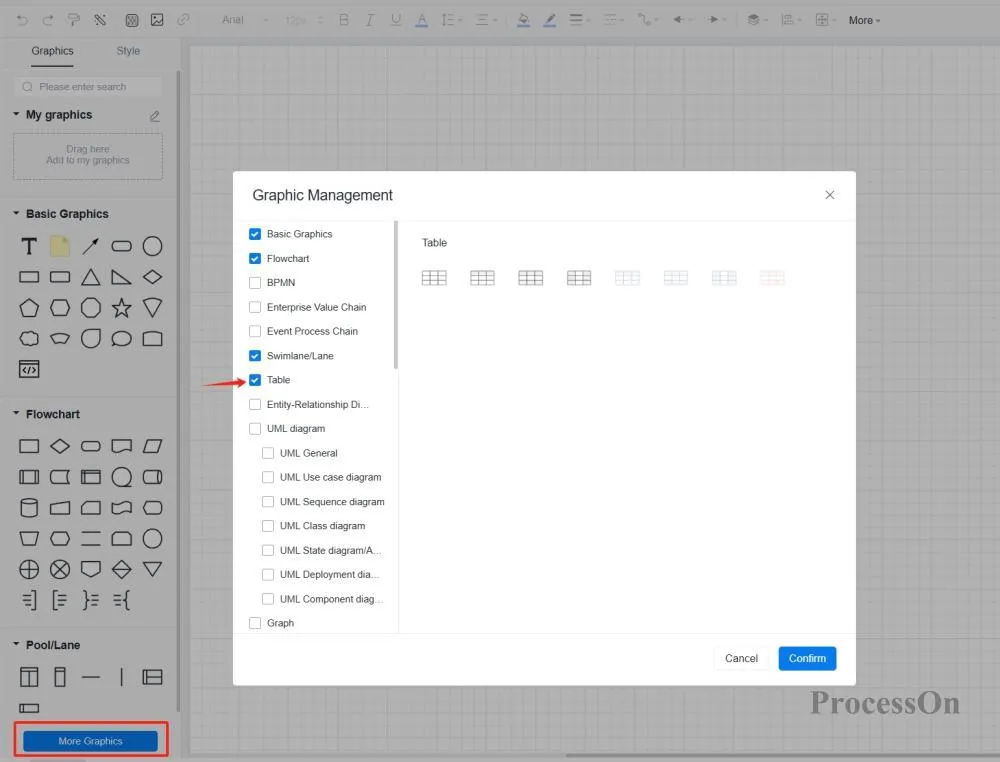
Create a new flowchart, click the [More Graphics] button in the lower left corner of the toolbar , and add the [Table] graphic component to the toolbar.
Method 1: Use the color of the filled table to indicate progress. Suitable for tasks that start on a day/week/month and end on a day/week/month. Generally , the time unit for task completion is consistent with the time unit marked on the table.
Method 2: Use lines or other graphics to indicate progress. This is a commonly used method for making Gantt charts, and the task completion time is highly accurate.
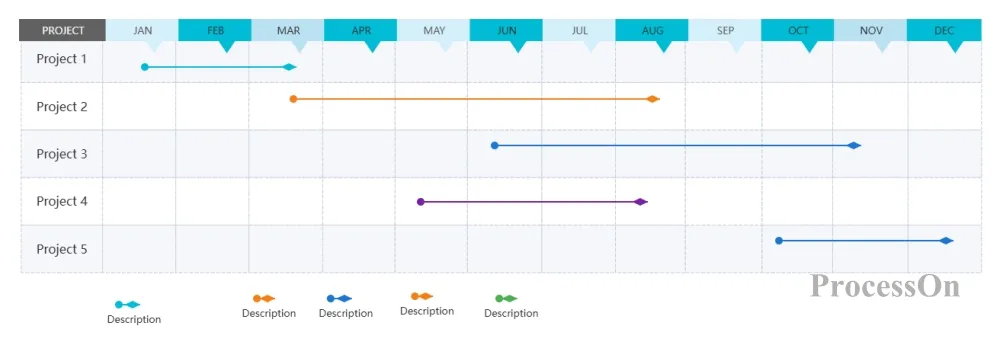
Use lines of different colors and lengths to indicate task progress
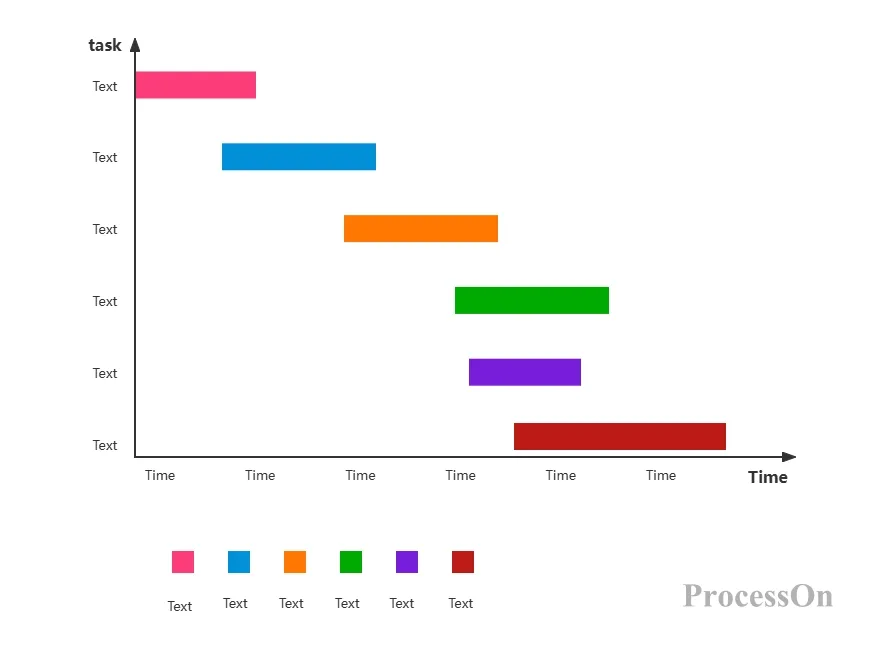
Use different colors and different rounded corners to indicate task progress
It is recommended to fine-tune the annual plan once a month, and color the normal completion with the corresponding color. By marking the current time, you can see which plans are unfinished, which plans are completed ahead of schedule,
and which plans have been completed.
1. Software project development Gantt chart
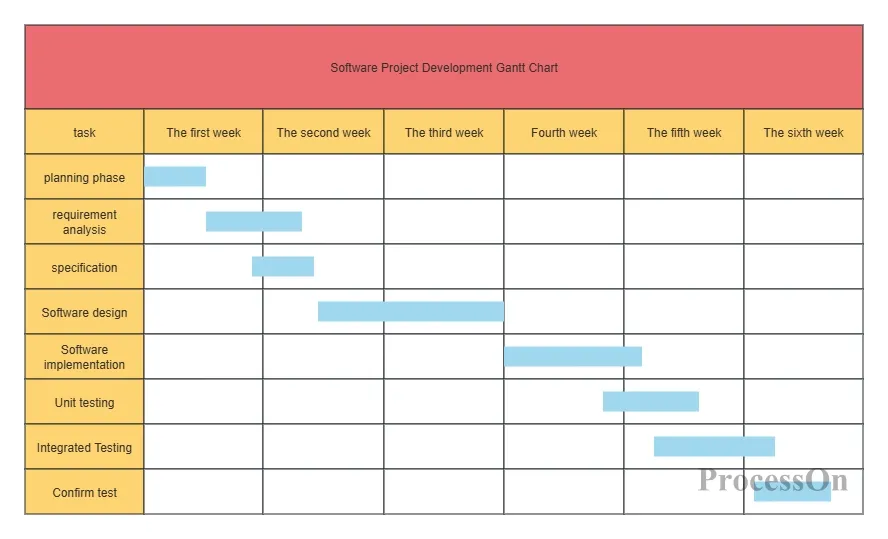
Software Project Development Gantt Chart
2. Minimalist Gantt Chart
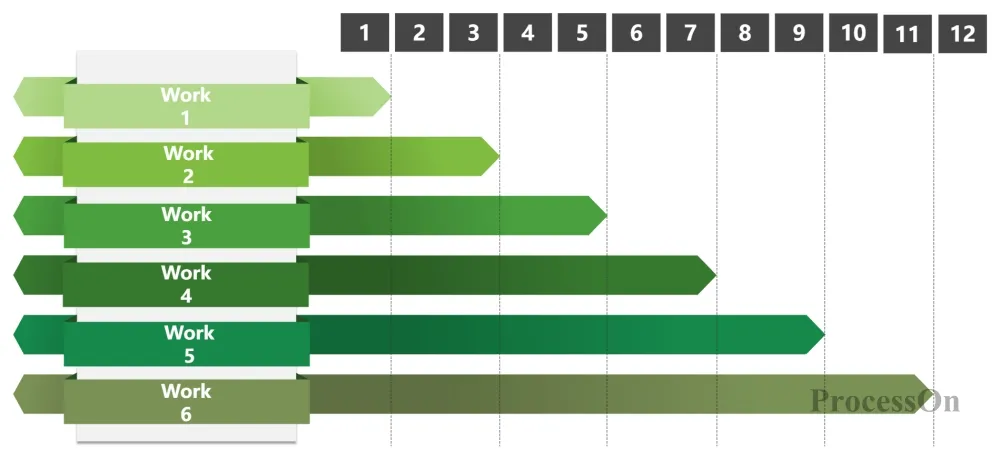
3. Research schedule for graduation thesis
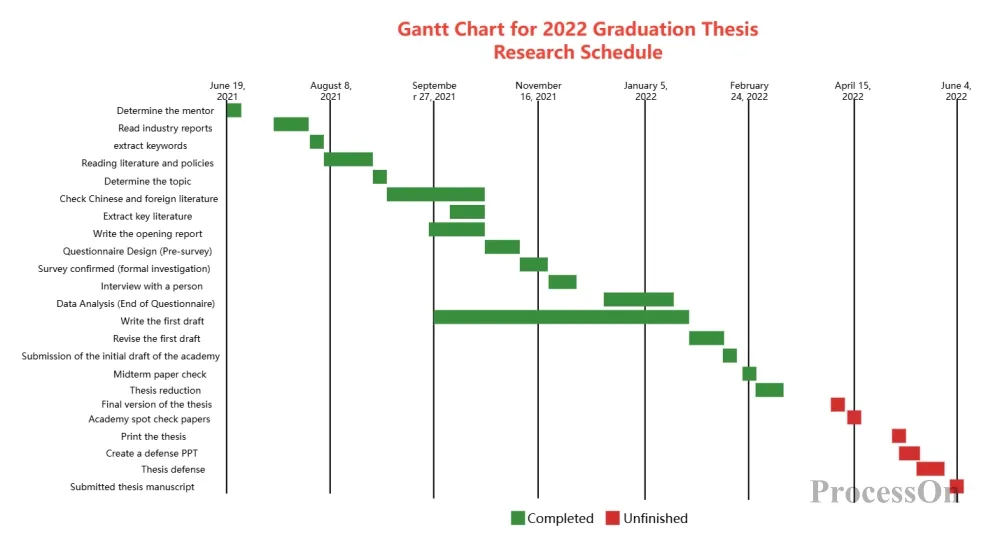
Dissertation Research Schedule
4. Project Week Gantt Chart
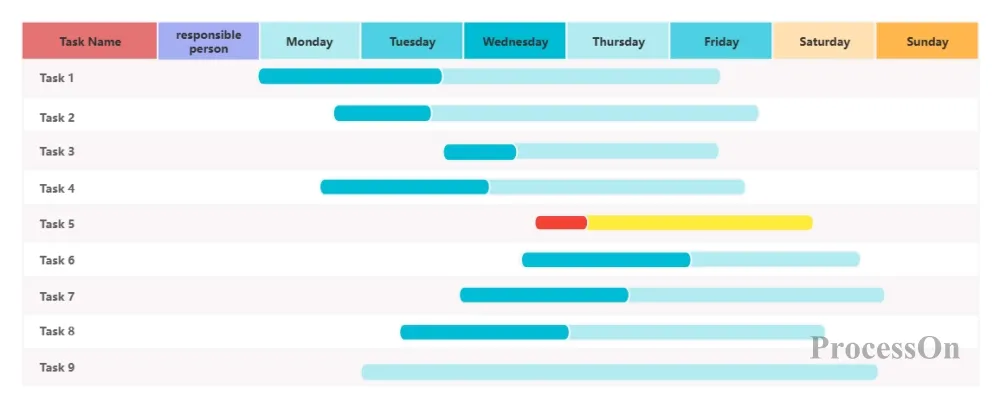
5. Product Development Plan Gantt Chart
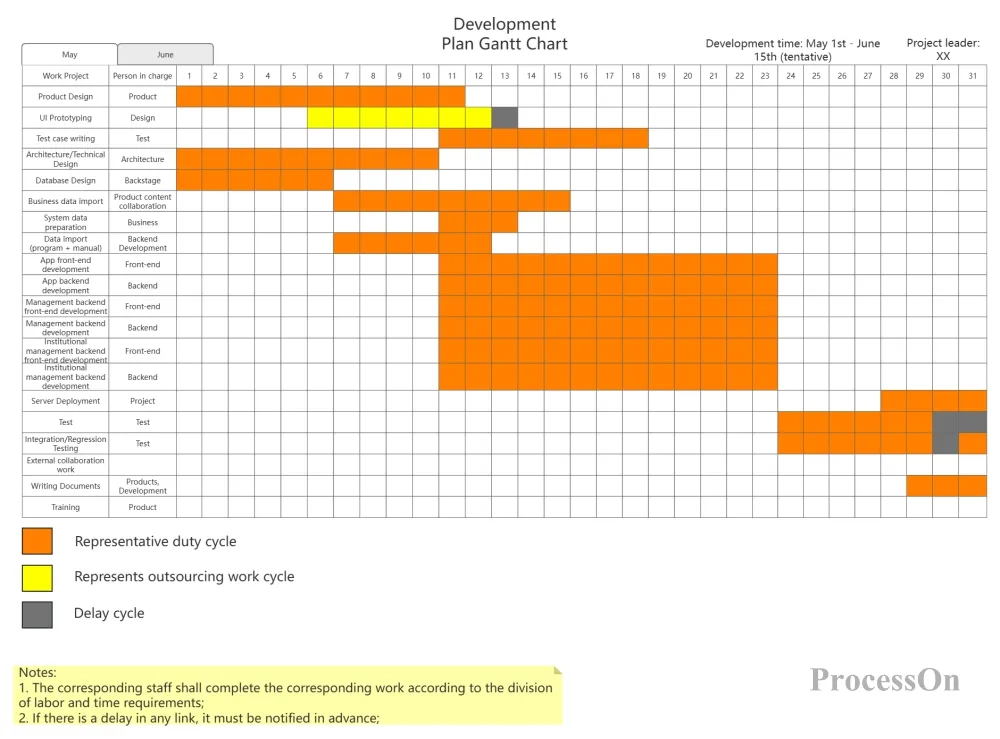
Product Development Plan Gantt Chart
6. Project Gantt Chart
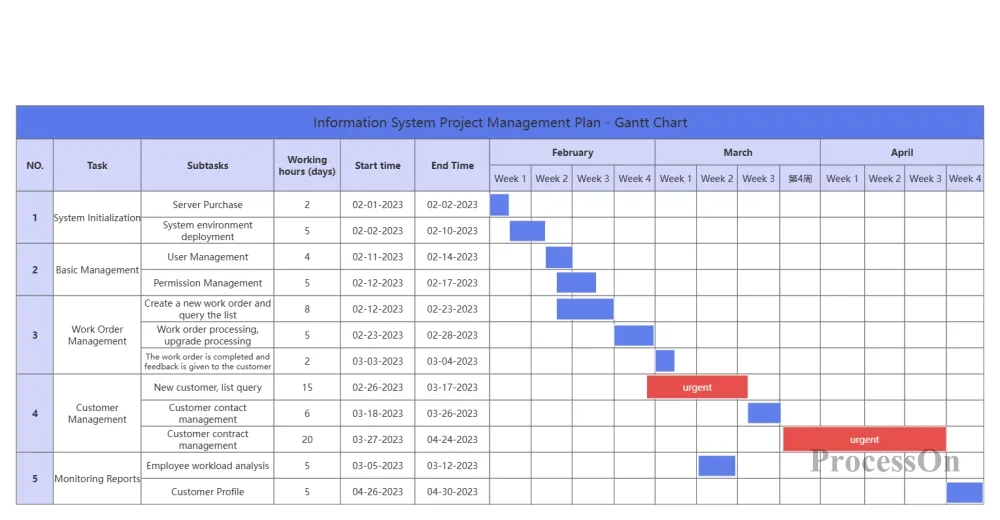
7. Annual plan Gantt chart
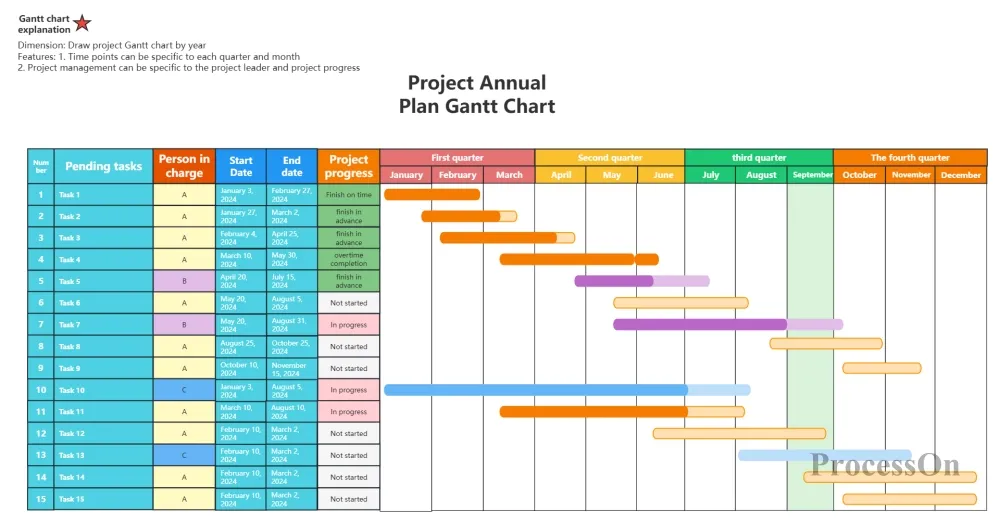
8. Software bonus Gantt chart
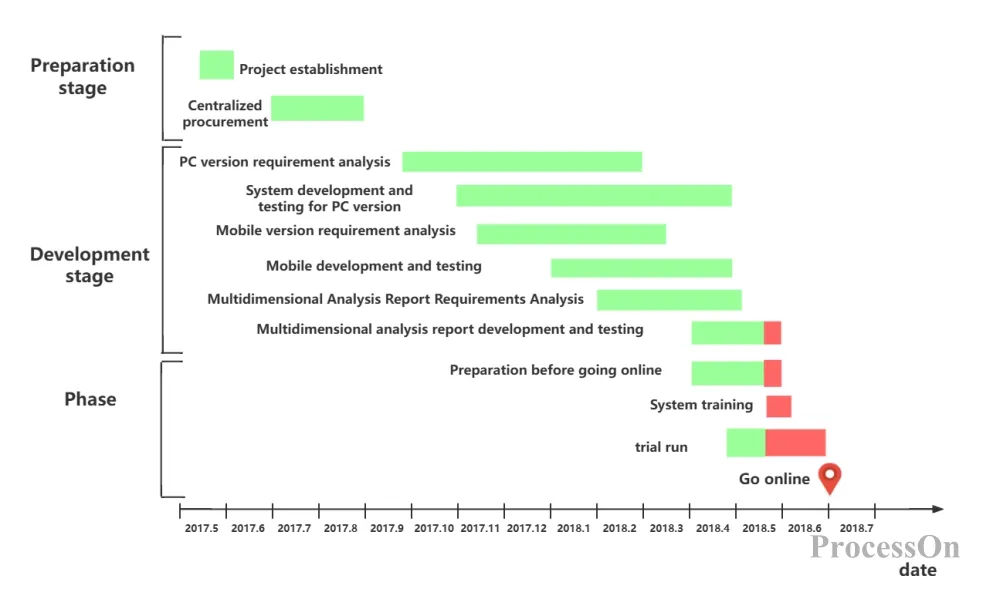
Gantt chart - software testing bonus
Through the Gantt chart tool, project teams can work together better, ensure tasks are completed on time, and adjust strategies in time to deal with unexpected challenges, thereby optimizing the overall project progress. It is not only an indispensable visual aid in project management, but also an important guarantee for ensuring the smooth progress and successful delivery of projects.