As a visual analysis tool, the fishbone diagram has been used by more and more people who realize its importance. It seems simple, but there are actually many key points in operation. A professional fishbone diagram can help us focus on the cause of the problem rather than the symptoms.
Next, we will elaborate on the introduction of the fishbone diagram analysis method, the classification and application of the fishbone diagram, the drawing of the fishbone diagram, the key points of drawing the fishbone diagram, and the selected case templates.
Fishbone analysis, also known as cause-and-effect analysis, was proposed by Japanese management guru Mr. Ishikawa Kaoru in 1953 and is also called "Ishikawa Diagram". Because it looks like a fishbone, it is also called "fishbone diagram". It is an analysis method that looks through phenomena to see the essence and finds the "root cause" of the problem.
A professional fishbone diagram is helpful for us to sort out our ideas and see the essence through phenomena. We use brainstorming to find out the relevant factors, organize them into hierarchical and clear graphics according to their interrelationships, and mark the important factors. This can better help us analyze all possible causes of a problem and clarify the main problems to be solved. Therefore, fishbone diagrams are also called "cause-and-effect diagrams".
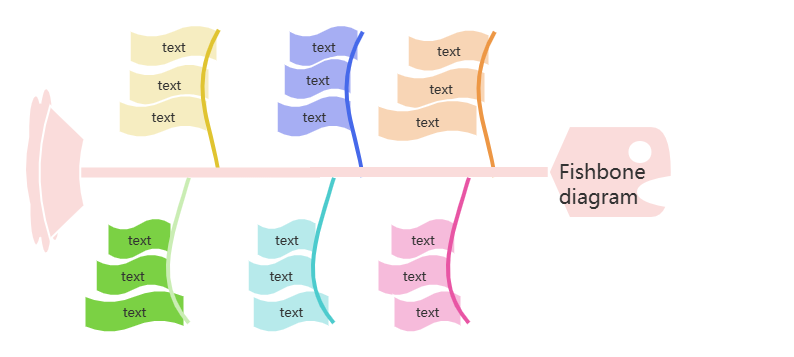
Creative fishbone diagram template
Modern business management education such as MBA and EMBA divides fishbone diagrams into three types: problem-solving type fishbone diagrams, cause-type fishbone diagrams, and countermeasure-type fishbone diagrams. Some people directly divide it into cause-type and countermeasure-type types. Both methods are acceptable.
The application field of fishbone diagram is very wide. Initially, fishbone diagram was widely used in the manufacturing field to improve products. However, as this method of analyzing problems gradually became known to more people, it slowly evolved into a general tool for solving problems in work, study, life, etc., used to organize problems, cause-and-effect analysis, and countermeasures analysis.
Next, I will share the classification of fishbone diagrams and share them with its specific applications.
Mainly used for pre-analysis, to help analysts better recognize all the factors that affect the problem. There is no causal relationship between each factor and a specific value, so the fish head represents the result, and the nodes on the fishbone are the structural items of this result.
The operation of sorting out the problem-type fishbone diagram is mainly carried out in the following steps:
1)Defining the problem
2)Use brainstorming to find all the pieces related to the problem
3)Logically organize the fragments
4) Conduct classification review and use brainstorming to supplement the missing categories or fragments.
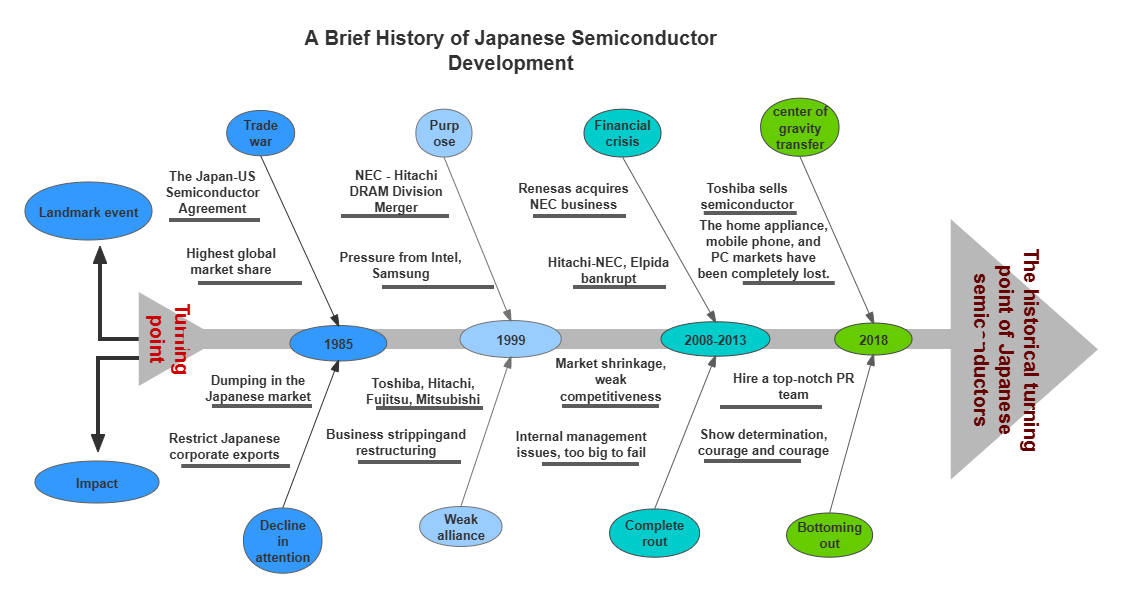

Fishbone diagram - the rise and fall of Japanese semiconductors
Mainly used for post-analysis to help analysts find the root cause behind the facts. The fish head of the cause-type fishbone diagram is usually on the right, and the characteristic value is usually written as "Why..."
The operation of the cause-type fishbone diagram is mainly carried out in the following steps:
1)State the problem with facts at the mid-bone
2)Use the 5 why method to analyze the causes
3) Use the football law to mark the main problems.
Application case: Analysis of the reasons for the decline in product satisfaction.

Decreased product satisfaction
mainly used to list solutions to problems. The fish head of the countermeasure fishbone diagram is usually on the left, and the characteristic value is usually written as "how to improve/improve...".
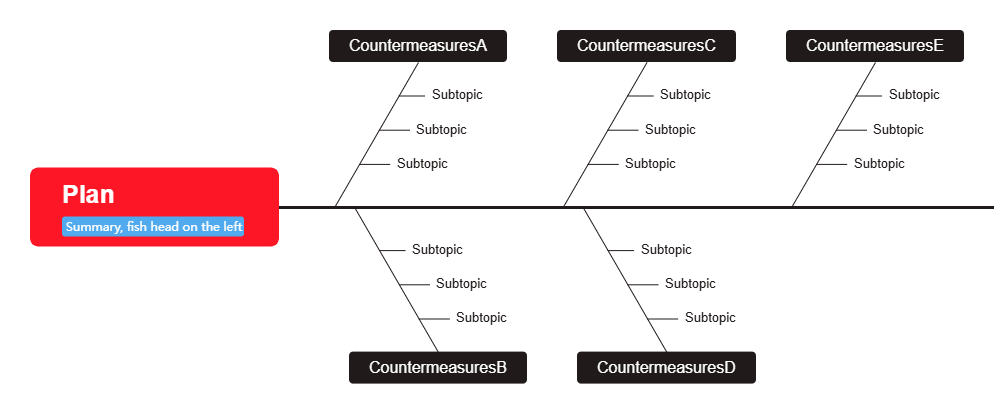
Application case: How to lose weight countermeasure analysis
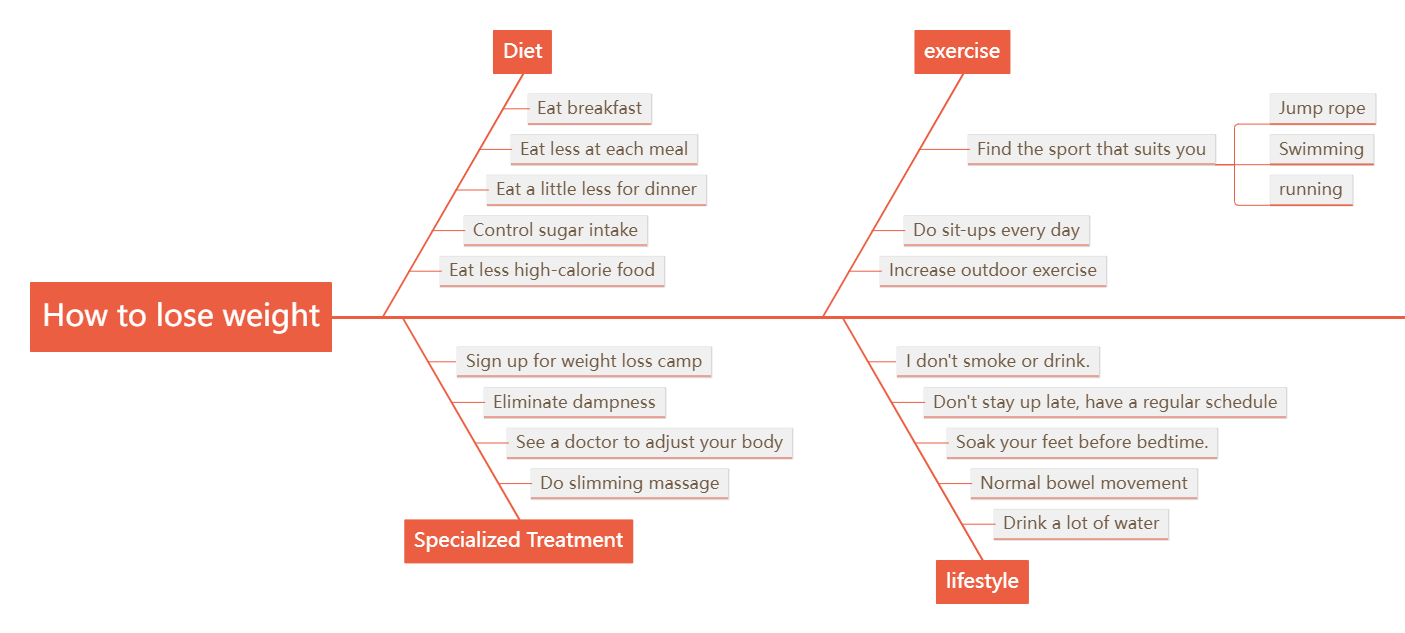
Fishbone diagram of how to lose weight
As the name suggests, the fishbone diagram looks like a fish skeleton, with a thick line connecting the head and tail, like a spine. Fill in the cause or countermeasure at the tail of the fish, the fish head represents the goal, and the spine is all the steps and influencing factors of the process. When you think of a factor, express it with a fishbone, and mark all the relevant items that can be thought of with different fishbones. Then refine it, root each factor, and use fishbone branches to represent each main cause element. After repeated deliberation, a fishbone diagram has a general structure. In this way, it is clear at a glance what are the causes of the problem, how to face and solve it, and what resources need to be mobilized.
After you have a basic understanding of the fishbone diagram analysis method, it is easy to draw a fishbone diagram. Next, I will introduce you to the drawing ideas and methods.
1. Drawing ideas of fishbone diagram
Before drawing a fishbone diagram, we need to first understand the drawing ideas of fishbone diagram, that is, the thinking process, which can be roughly divided into 4 steps:
1) Identify the problem to be solved and write the problem on the fishbone.
2) Think from all angles, identify the various factors, and mark them on the fishbone trunk.
3) Dig deeper into the causes, think more deeply about the specific details, and mark them on the fishbone branches
4) Think about each cause and factor, and find the corresponding solution.
There are many tools for drawing fishbone diagrams. Common Word, Excel, and PPT can make fishbone diagrams. Flowchart mind mapping tools such as draw.io, Lucidchart, and ProcessOn also support making fishbone diagrams. Users can choose the appropriate diagram tool according to their needs. For beginners, it is recommended to use ProcessOn, which is a professional flowchart mind mapping tool that supports online drawing of fishbone diagrams and provides a wealth of fishbone diagram examples and templates.
In ProcessOn , you can draw a fishbone diagram using two graphics: flowcharts and mind maps.
1) Draw a fishbone diagram with a mind map:
It is very simple to draw a fishbone diagram using a mind map. The structure of the mind map provides a fishbone diagram structure , and it is divided into two types: the left fishbone diagram and the right fishbone diagram , which correspond to the countermeasure fishbone diagram and the cause fishbone diagram . When drawing, you can choose the corresponding fishbone structure according to the drawing theme.
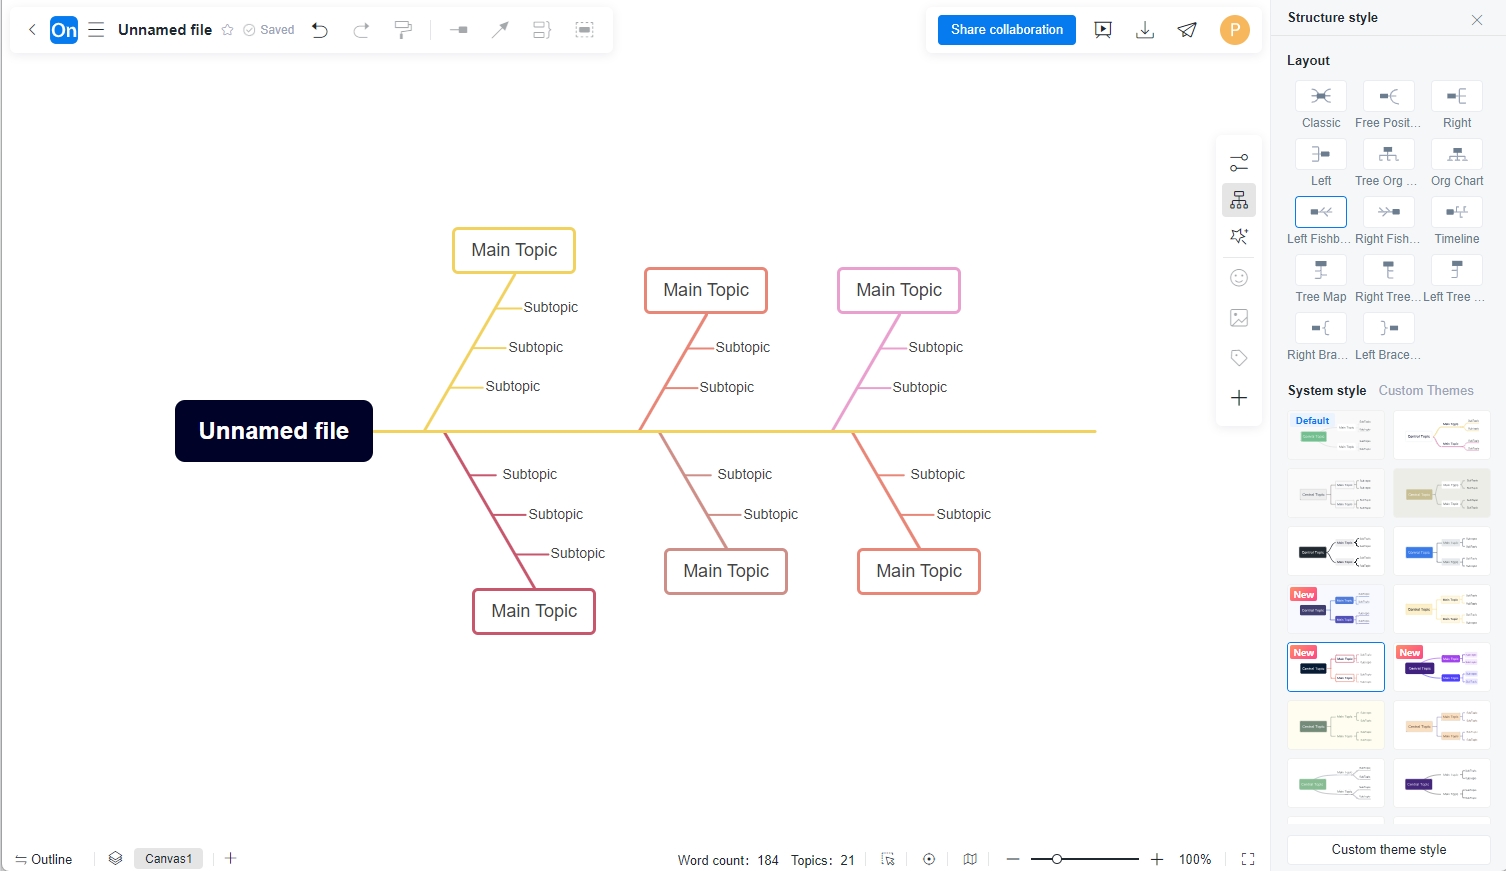
2) Draw a fishbone diagram with a flowchart:
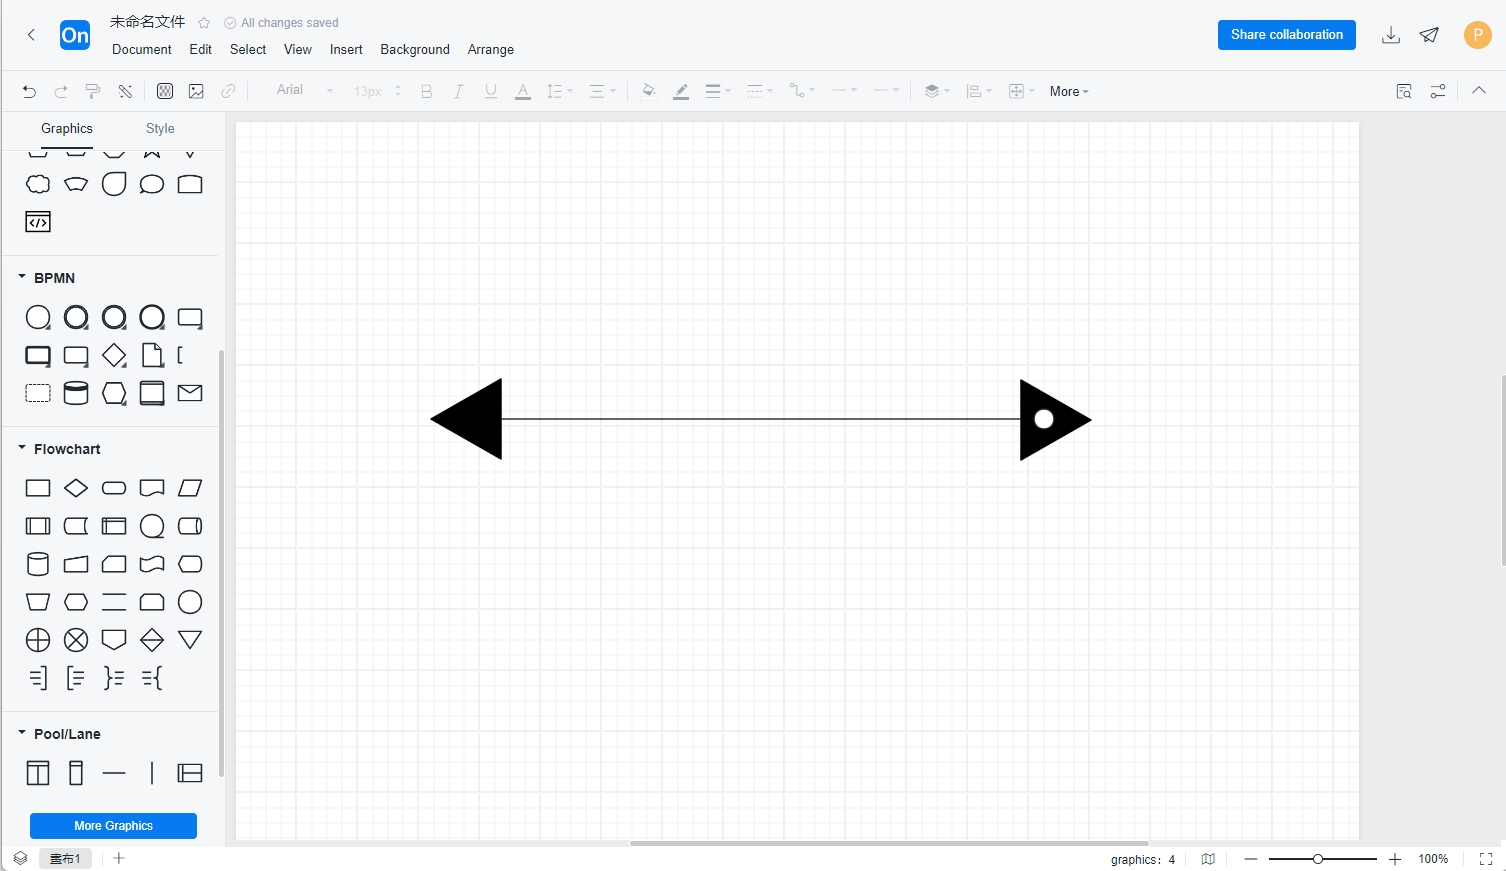
The method of drawing a fishbone diagram using a flowchart is slightly more complicated and time-consuming, but the advantages are also more obvious. You can make bold attempts in color matching and style according to your needs. The following are the specific steps.
Step 1: Create a flow chart. Drag two triangles from the graphic library on the right to the canvas as the fish head and fish tail. Insert a main bone between the fish head and fish tail .
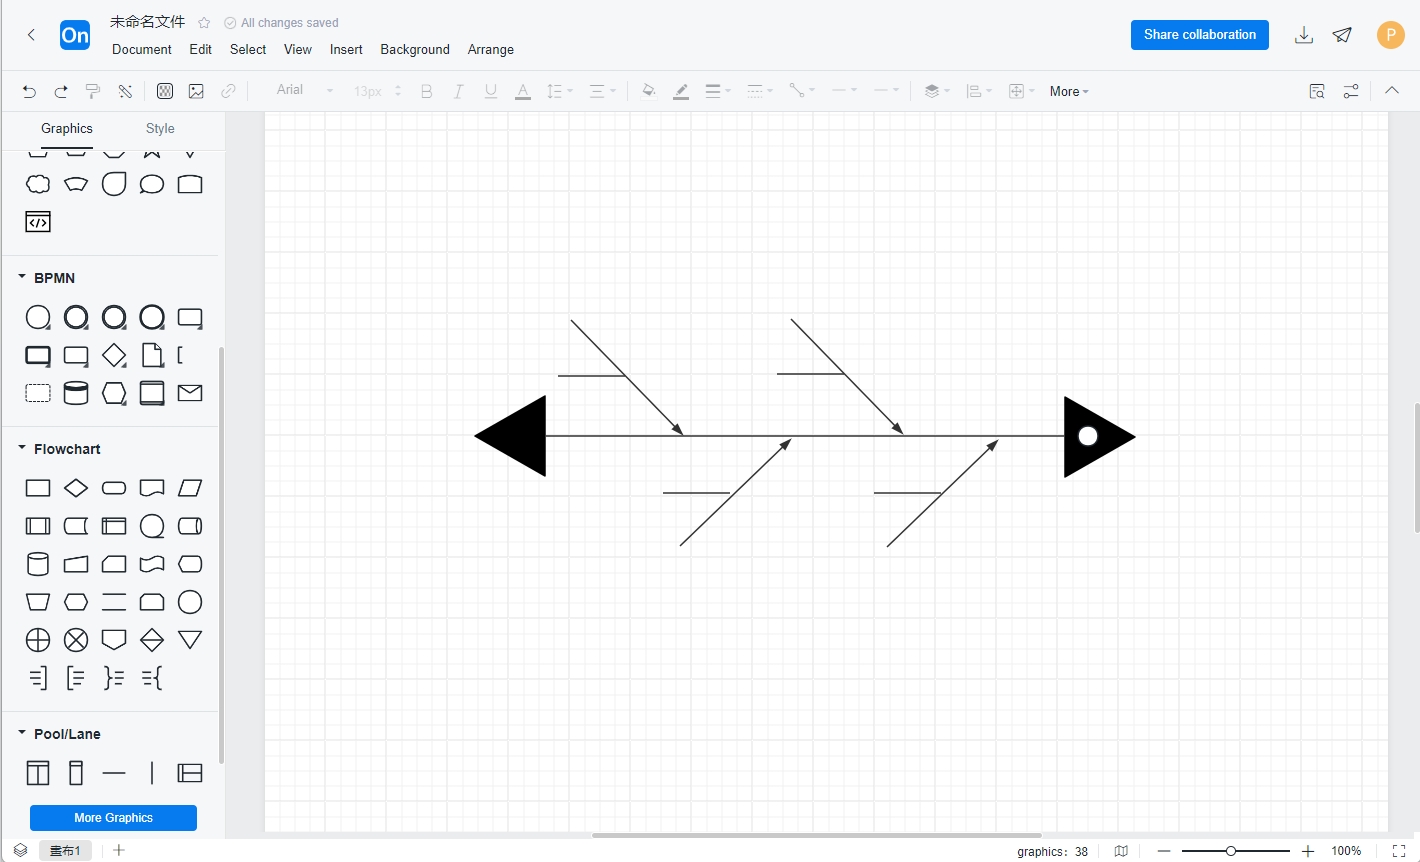
Step 2: Draw arrows pointing to the main bones. Add large bones, medium bones, and small bones respectively
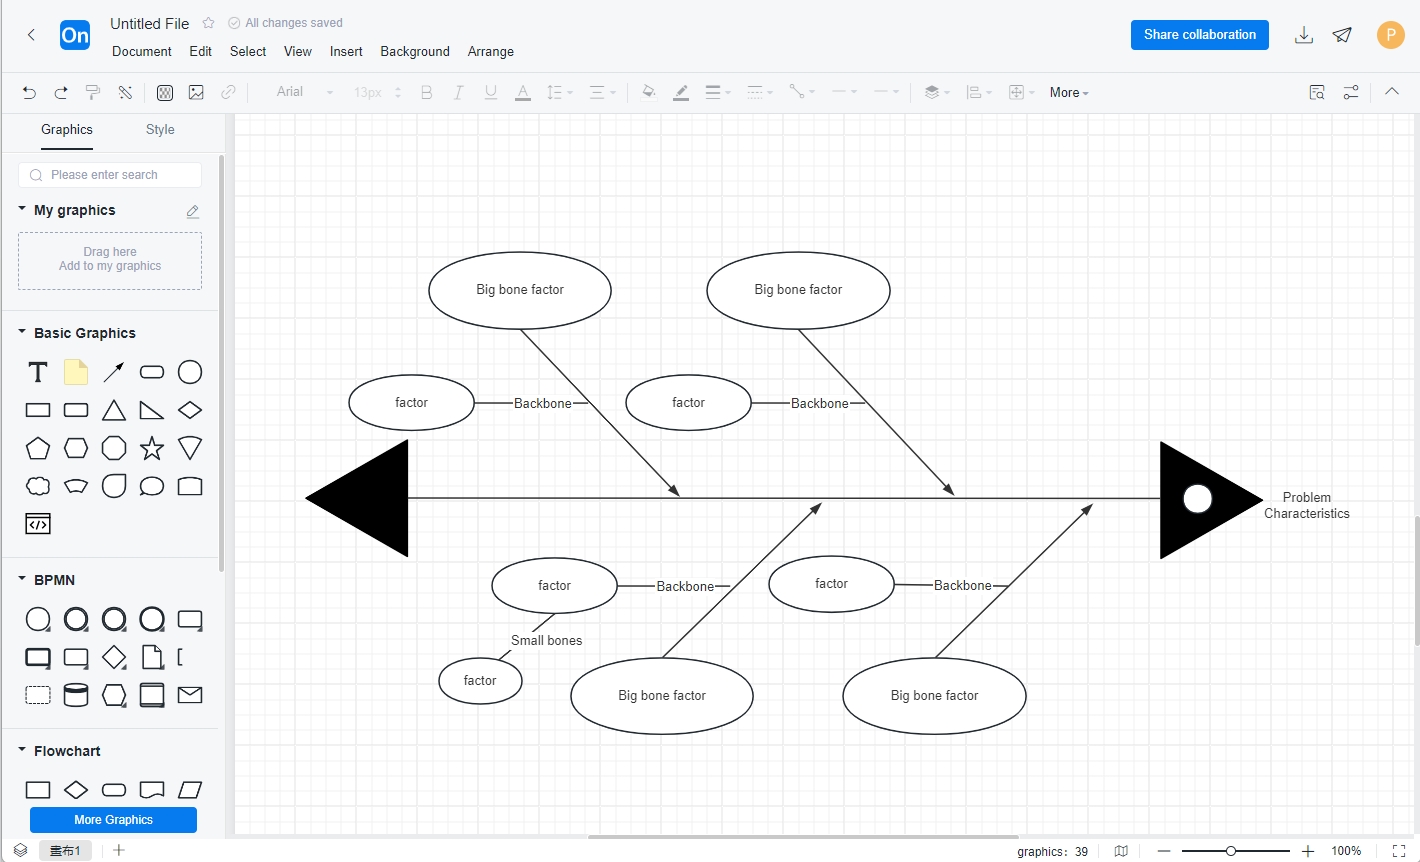
Step 3: Add text to each skeleton . In order to keep the fish bones beautiful, try to keep the bone spacing, length, and text parallel. You can also match colors as needed.
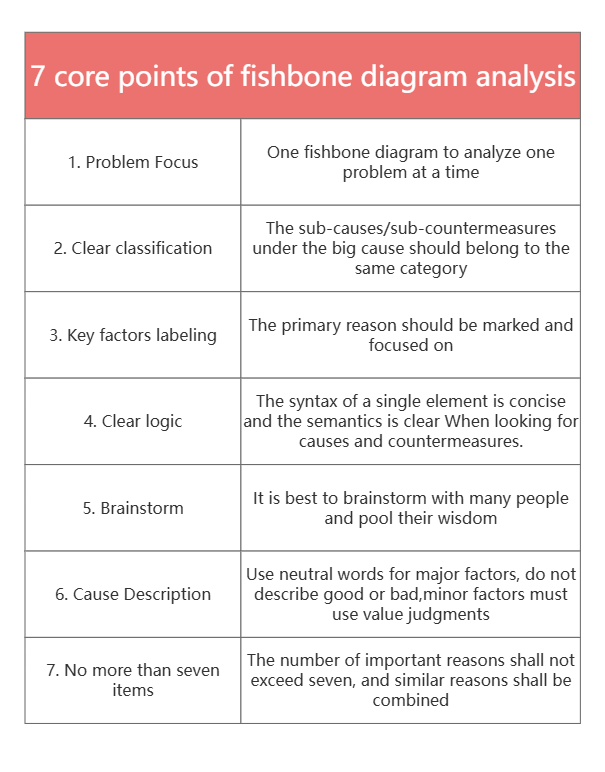
1. Focus on the problem : Solve only one problem at a time. Before making a fishbone diagram, clarify with all team members what the problem is and the goal to be solved. There cannot be multiple goals.
2. Clear classification : The sub-causes under the major factors should belong to the same category. Each major factor classification should be clear and independent of each other. If you don’t have a good factor classification, it is recommended to start from the six elements of "personnel, machines, materials, methods, environment, and measurement". If the problem is obvious, it does not need to be so complicated.
3. Factor annotation : The primary factors should be annotated to focus on them.
4. Clear logic : The words of a single factor are concise and the meaning is clear to avoid ambiguity.
5. Brainstorming : The effect is better when more people participate, and they can think more comprehensively about the causes of the problem.
6. Description of factors : Use neutral words for major factors, and do not judge whether it is good or bad; minor factors must use value judgments.
7. Quantity limit : The major factors of a single problem should not exceed 7, and the minor factors of a single major factor should not exceed 7.
provide you with some good-looking fishbone diagrams in the template library, which can be cloned and used directly. If you want to see more types of fishbone diagrams, you can enter the ProcessOn template library and enter the keyword "fishbone diagram" .
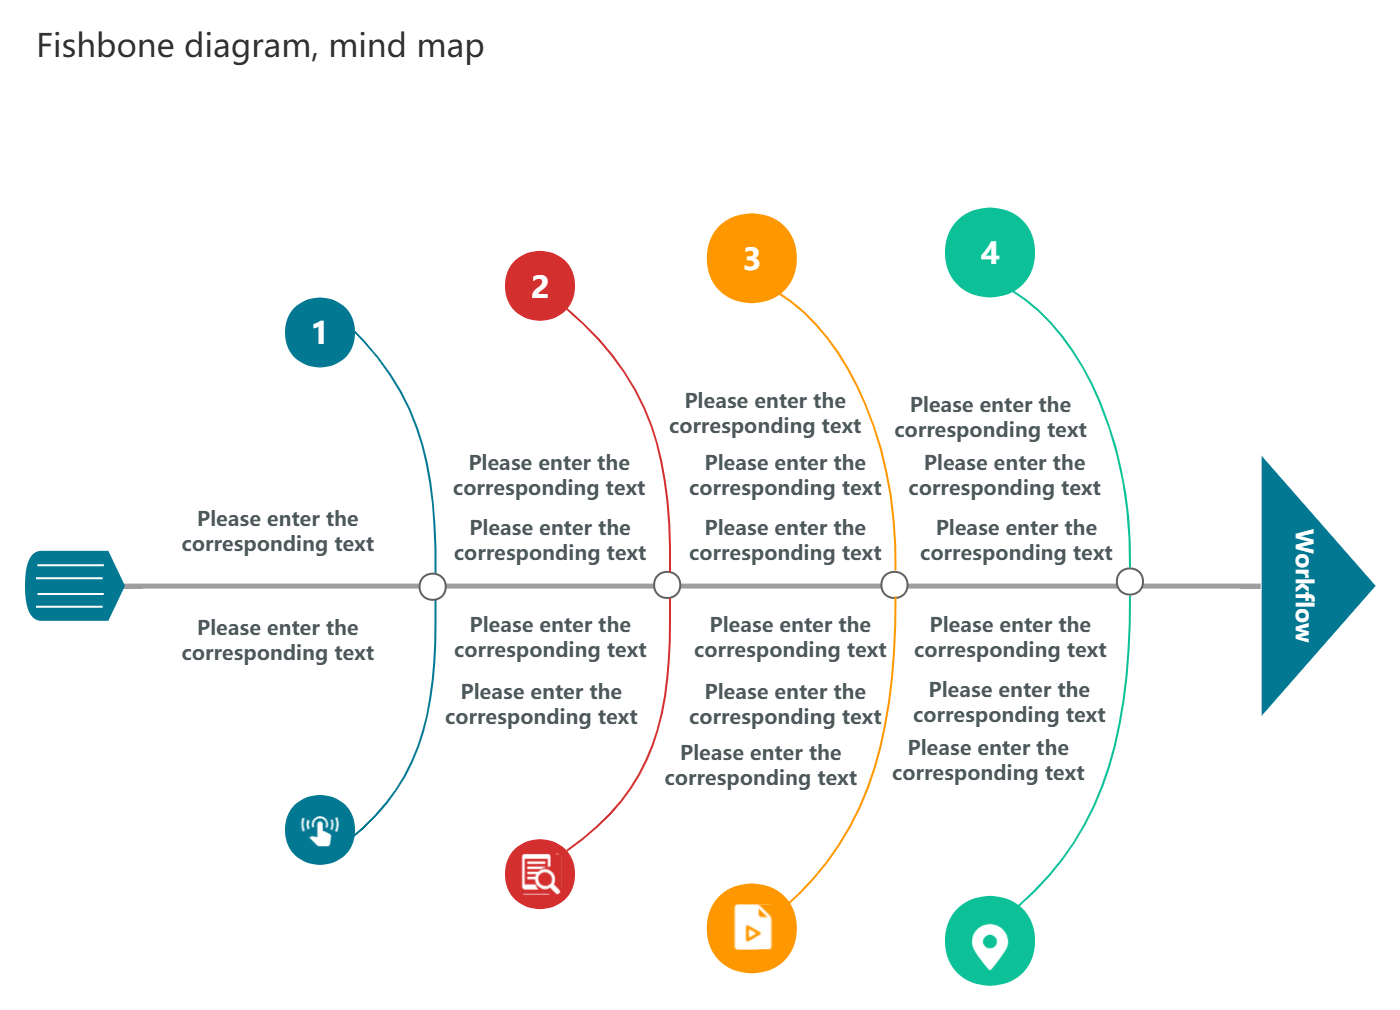
Fishbone diagram template for workflow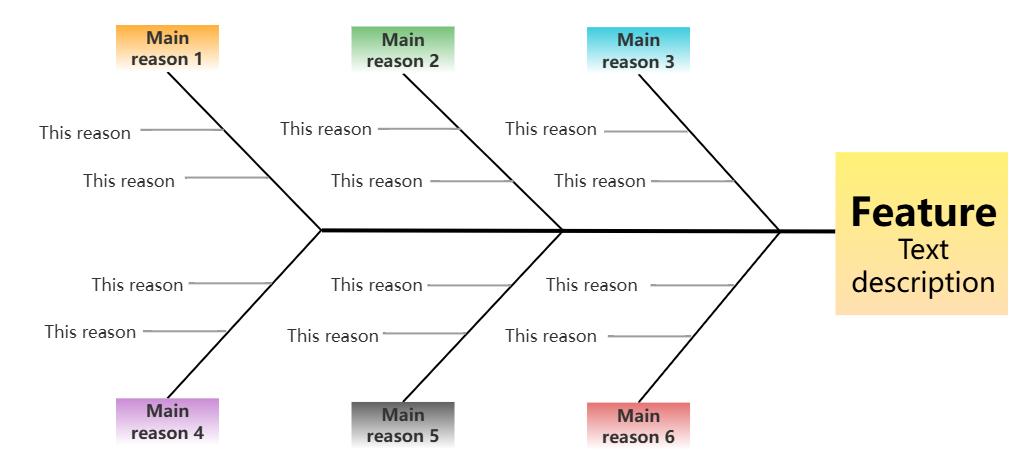
Fishbone diagram for cause analysis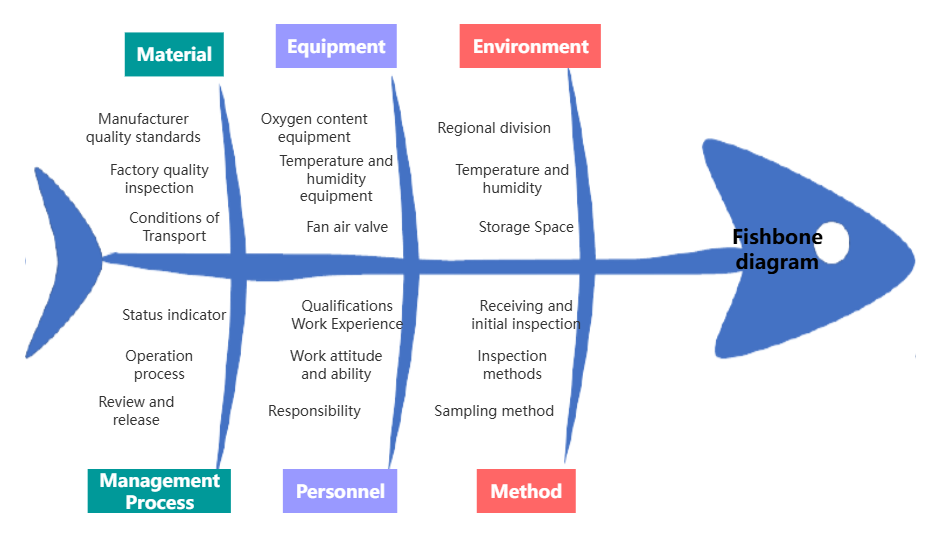
Fishbone Diagram Analysis Model
above is the sharing of the fishbone diagram analysis method. All the above fishbone diagram cases are drawn using ProcessOn.
As a professional and powerful drawing tool, ProcessOn supports online editing of flowcharts, mind maps, organizational charts, UML diagrams, and other graphics. Users can create new content from scratch, or easily edit and modify existing drawing frameworks and case templates. The operation is simple and easy to use.