The swimlane diagram is a type of diagram that is designed to show the processes and participants (process link leaders, work departments, and even information systems) involved in each step of the workflow. When the process of an event involves many different people, departments, or functional areas, it is difficult to track the person in charge of each step. Therefore, an effective way to solve this problem is to use a swimlane diagram to divide the flowchart into columns, so that the process of task transfer can be clearly understood.
As a valuable element in business process models and symbols, swimlanes, combined with standard symbols used in UML diagrams and flowcharts, can more intuitively visualize the division of responsibilities in the process.
The swimlane diagram helps team members better understand complex processes by clearly showing the responsibilities and interactions of different functions or teams throughout the process. The main use scenarios of the swimlane diagram include:
Process visualization: In project management, swimlane diagrams are used to show the various stages of a project from initiation to completion, as well as the responsibilities and tasks of different teams in each stage. Through swimlane diagrams, project managers can clearly see the overall process and progress of the project, making it easier to manage and monitor the project.
Teamwork: Swimlane diagrams can clarify the roles and responsibilities of each team or member in a project, promoting teamwork and communication. Team members can clearly understand their own scope of work and the work of other teams, so they can work together better.

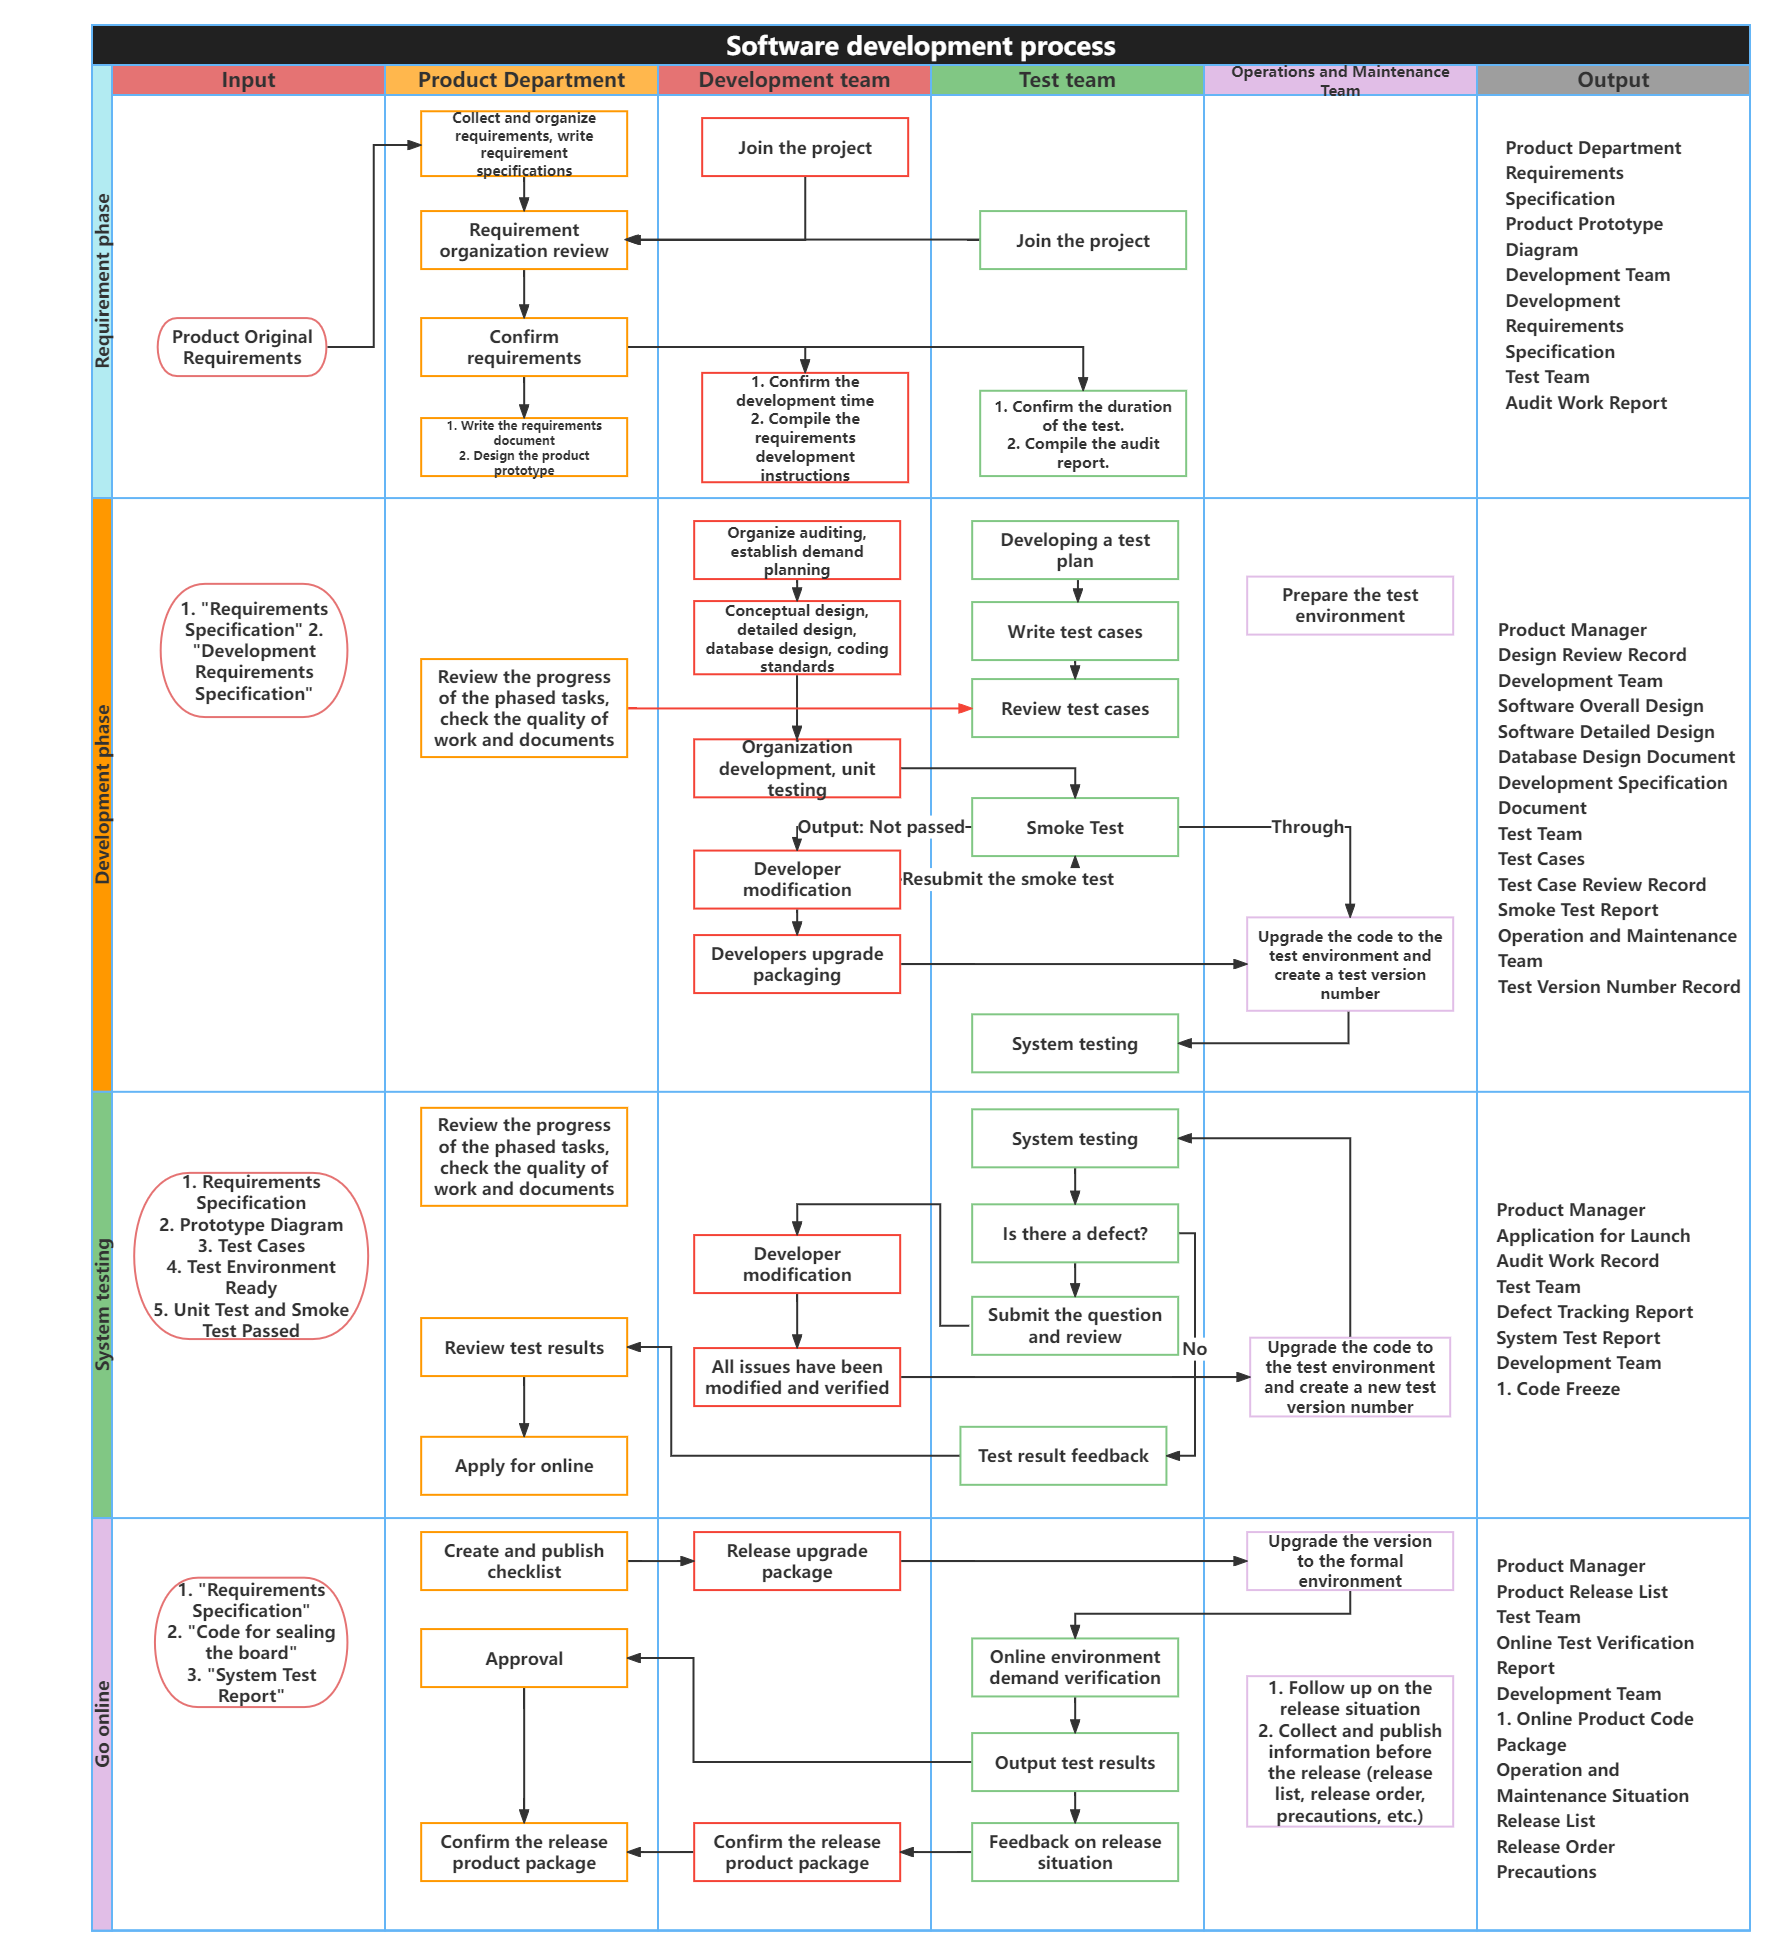
Software development flow chart (Lane chart)
Process optimization: In business process analysis, swimlane diagrams are used to show the various links of the business process and the different departments or functions involved. By analyzing the swimlane diagram, you can find bottlenecks, redundant links or unreasonable aspects in the business process, and then optimize and improve the process.
Cross-departmental collaboration: The swimlane diagram can clearly show the collaborative relationship between different departments in the business process, helping departments to better understand each other's work content and processes, thereby strengthening cross-departmental collaboration and communication.
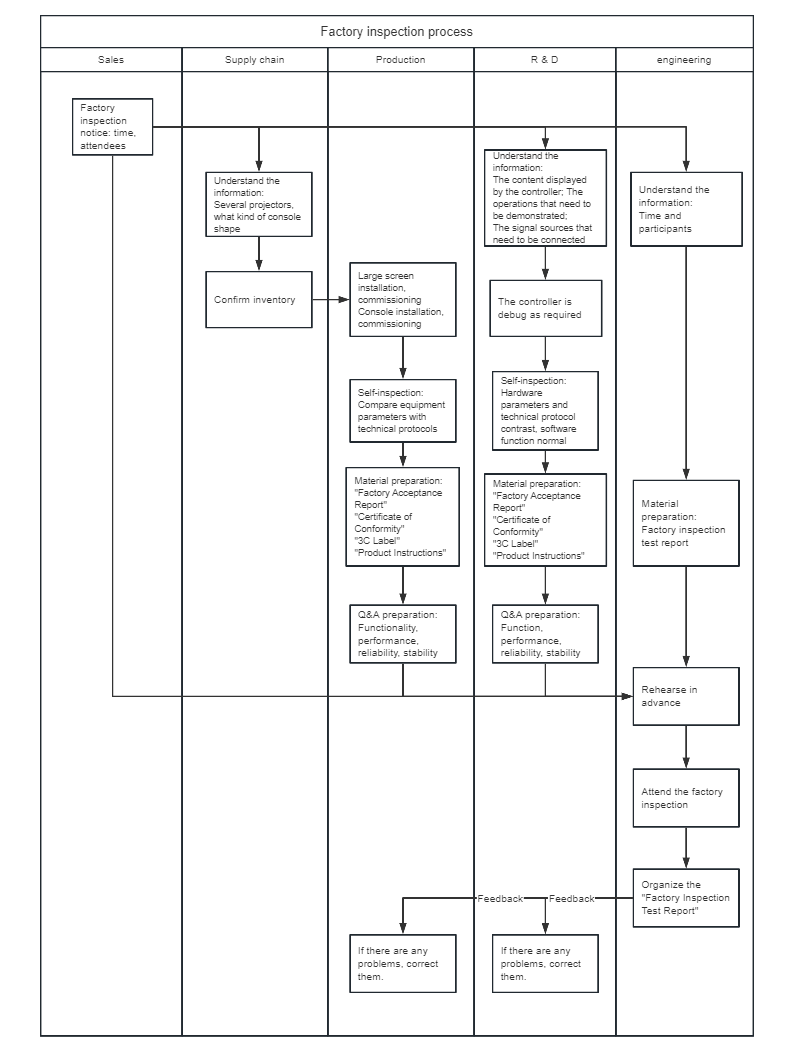
System architecture display: In system design, swimlane diagrams are used to display the overall architecture of the system and the relationship between various components. Through swimlane diagrams, designers can clearly see how the various parts of the system work together, as well as the data flow and control flow between them.
System process description: The swimlane diagram can also be used to describe the system's workflow, including data input, processing, output and other aspects. This helps system developers better understand the system's functions and requirements, so as to carry out more accurate and efficient development work.
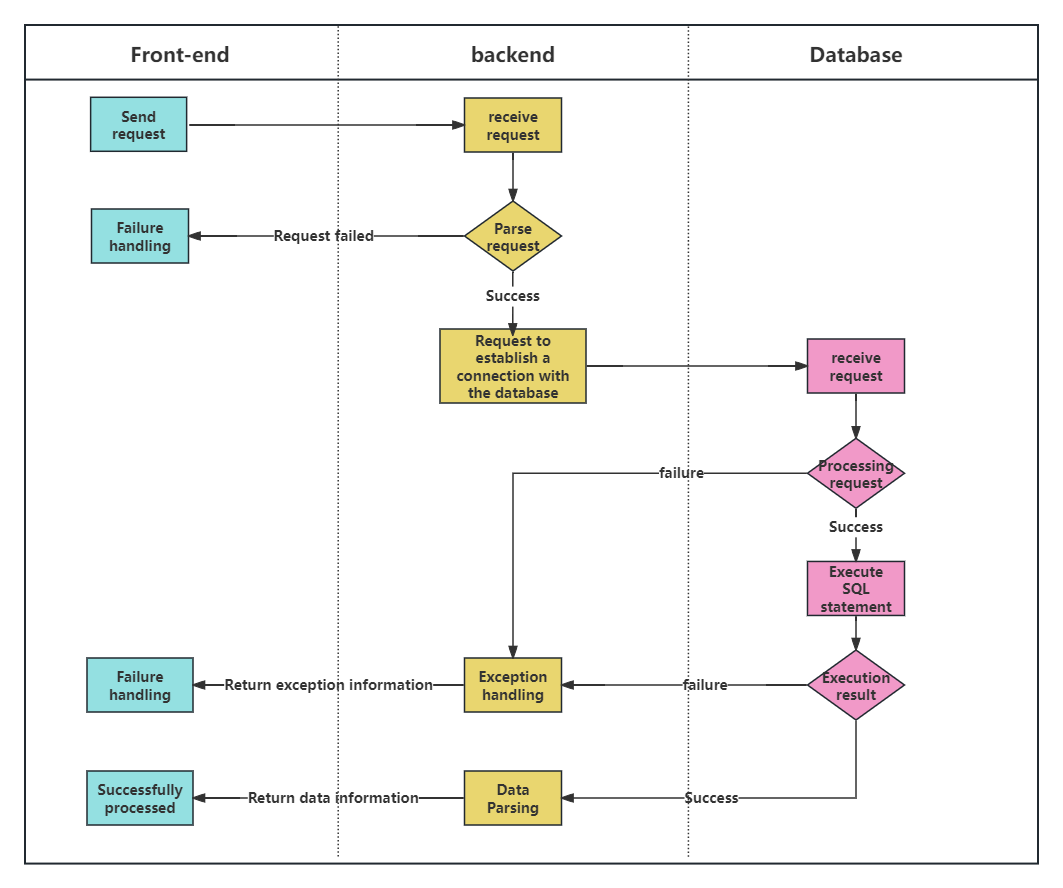
Interface interaction flow chart
1. Pool: The pool is the outer framework of the swimlane diagram. The lanes and processes are all contained in the pool.
2. Lanes: Multiple lanes can be created in a swimming pool.
3. Process: The actual business process.
4. Role (person in charge, department or information system): Differentiate by department or responsibility, and clarify the task that each department/person/information system is responsible for completing. For example: before sales - during sales - after sales.
5. Stage: Differentiate by task stage and clarify the task links that need to be handled at each stage. The stage dimension can be added as needed.
Depending on the direction of the lane layout, it can be divided into vertical lane diagrams and horizontal lane diagrams.
The lanes are placed horizontally on the canvas, which is a horizontal swimlane diagram, emphasizing the process in the swimlane diagram;

The swimlanes are placed perpendicular to the canvas, which is a vertical swimlane diagram, emphasizing the functional groups in the swimlane diagram.

1. The names of roles/functions in the swimlane diagram should take into account personnel changes and use departments/positions instead of employee names directly;
2. The naming rule of the process is to describe it with a verb + noun phrase;
3. Draw a swimlane diagram, first summarize the departments/positions involved and the core activity processes, and then gradually improve the branch processes. When drawing, generally follow the order from top to bottom and from left to right;
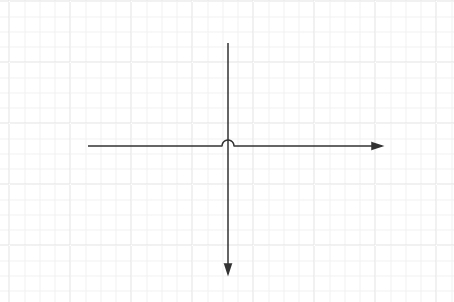
4. Try not to cross the flow lines in the swimlane diagram. If there is a cross, use a cross line to distinguish the flow direction;

5. After completing the swimlane diagram, check the entire process to ensure that the process is reasonable and smooth.
1. First enter ProcessOn On the File page, choose to create a Flowchart or Swimlane Diagram.
2. Select the Pool/Lane graphic category in More Graphics, and the graphic category will appear in the graphic library on the left. Drag the lane into the canvas, select the title bar, and set the number of lanes in the menu bar.
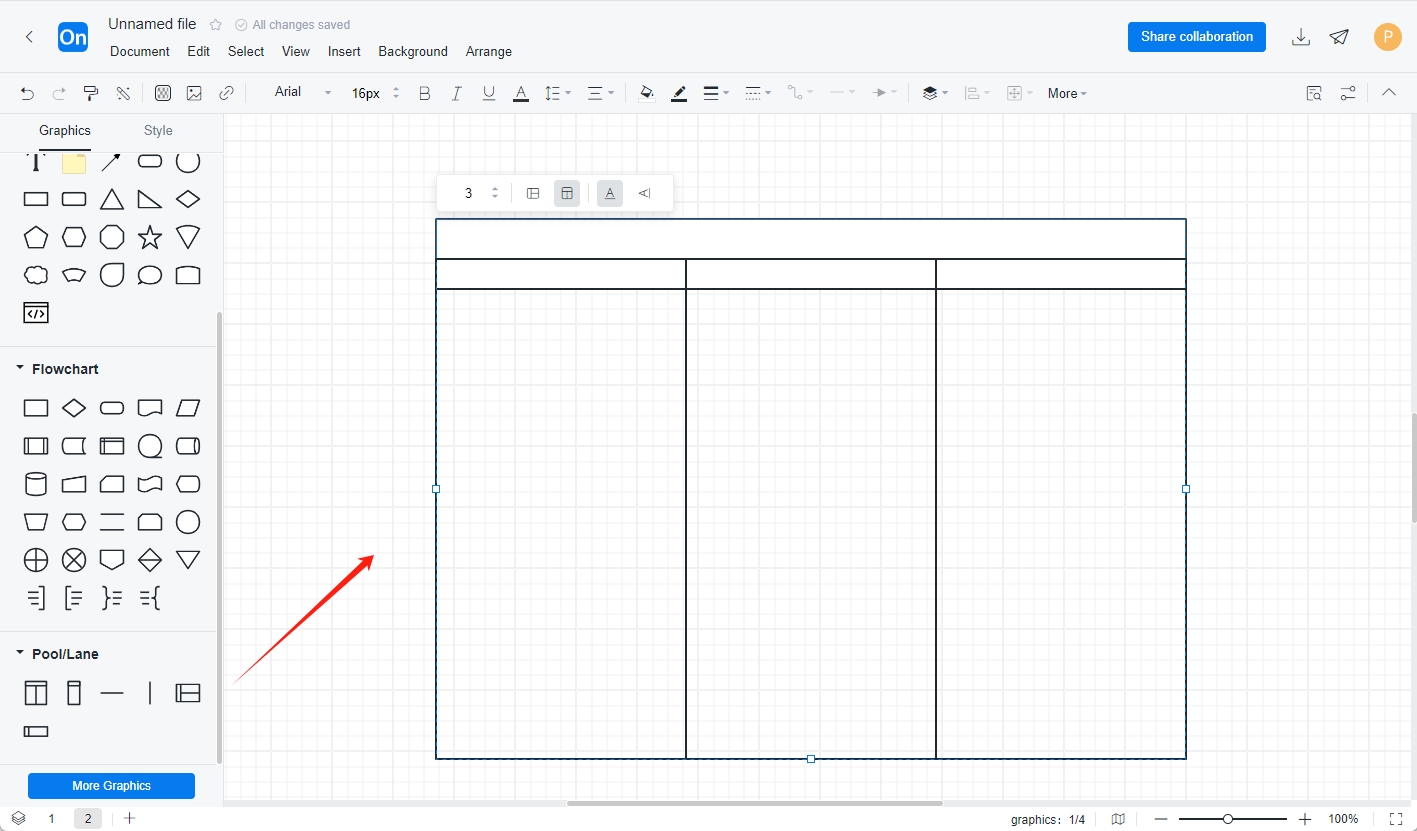
3. Enter the title and role, and then drag the corresponding process elements into the lanes corresponding to the roles according to the flowchart standards. If the process involves different stages, you can drag the separator into the pool, the vertical pool into the horizontal separator, and the horizontal pool into the vertical separator.
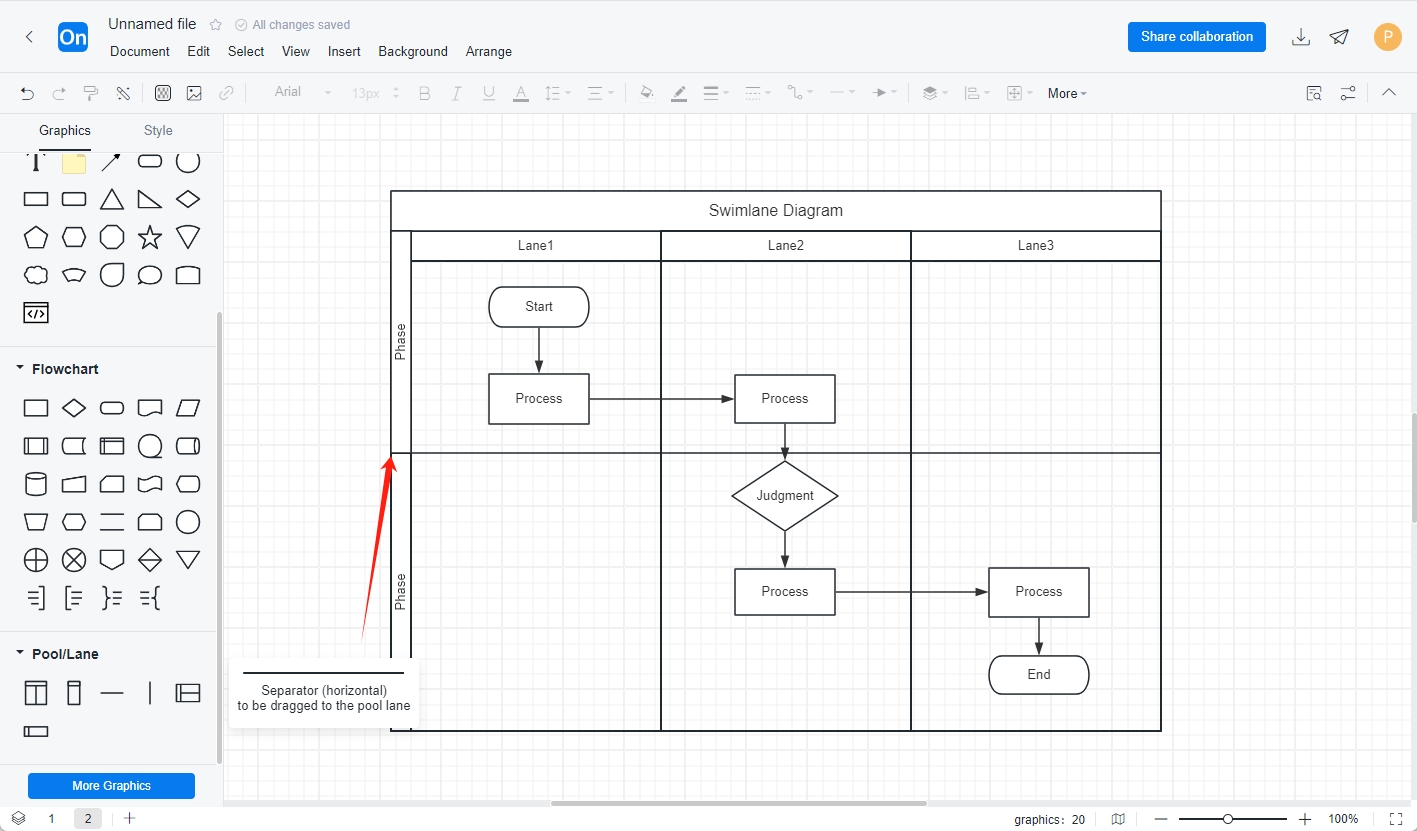
4. If you need to modify the process in the middle after drawing, you can directly drag the lane into the middle of the created lane in the graphics library on the left .
The above is an introduction to the swimlane diagram and how to draw it. The swimlane diagram can be used to identify redundant processes between different departments and reveal repeated or unnecessary steps in the process, which can make work deployment more streamlined and improve work efficiency.