

Before we delve into the secrets of complex business processes and teamwork, we first need an intuitive and efficient tool to reveal the interaction and collaboration between different departments or roles during task execution. This tool should not only clearly outline the responsibilities of each task, but also dynamically display the information flow and logistics in the process, so as to help managers and team members quickly identify potential bottlenecks and improvement points. It is in this context that the swimlane diagram, a graphical tool that combines the essence of flowcharts and organizational charts, came into being.
A swimlane diagram, also known as a cross-functional flowchart , is designed to show the processes and functional departments involved in each step of a workflow. A swimlane flowchart is a special type of diagram that shows the relationship between a business process and the functional blocks responsible for that process. The swimlane flowchart focuses on the logical relationship between value activities and better shows the responsibility of each value activity.
The scenario of swimlane diagram is very clear: the flowchart is the steps to describe an event process. When this process involves many different people, different departments or different functional areas, it is difficult to track the person in charge of each step. An effective way to solve this problem is to divide the flowchart into columns with swimlane diagram, so that the process of task transfer can be clearly understood. Swimlane diagram is widely used in business management, project management, software engineering and other fields. Through swimlane diagram, enterprises can clearly display business processes, optimize workflows, improve work efficiency and team collaboration efficiency. At the same time, swimlane diagram can also be used as a training and communication tool to help team members better understand business processes and their respective roles and responsibilities.
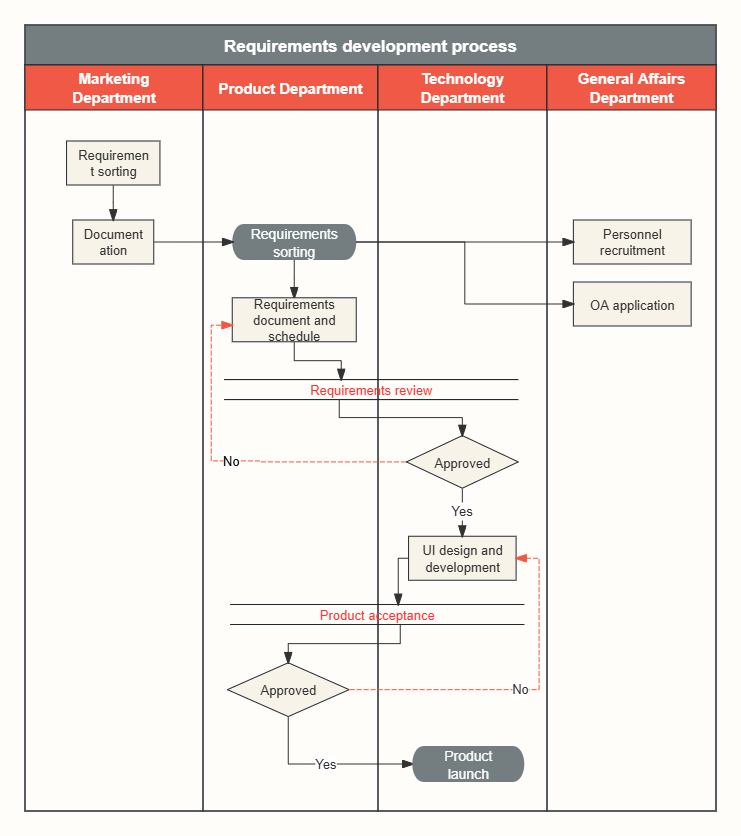
Requirements development process swim lane diagram
This is a swimlane diagram in the department dimension. This cross-functional flowchart shows the relationship between the demand development process and the functional units (departments) responsible for each sub-process. One column represents one functional unit. The shapes representing the steps in the process are placed in the corresponding columns of the functional units responsible for these steps.
In general, the type of swimlane diagram can be determined by three dimensions:
Department dimension: Differentiate by department or responsibility, and clarify the tasks that each department/person is responsible for completing.
Stage dimension: differentiated by task stages.
Activity dimension: At different stages, each activity in the grid should be implemented by a corresponding department.
Below are some examples of swimlane diagrams .
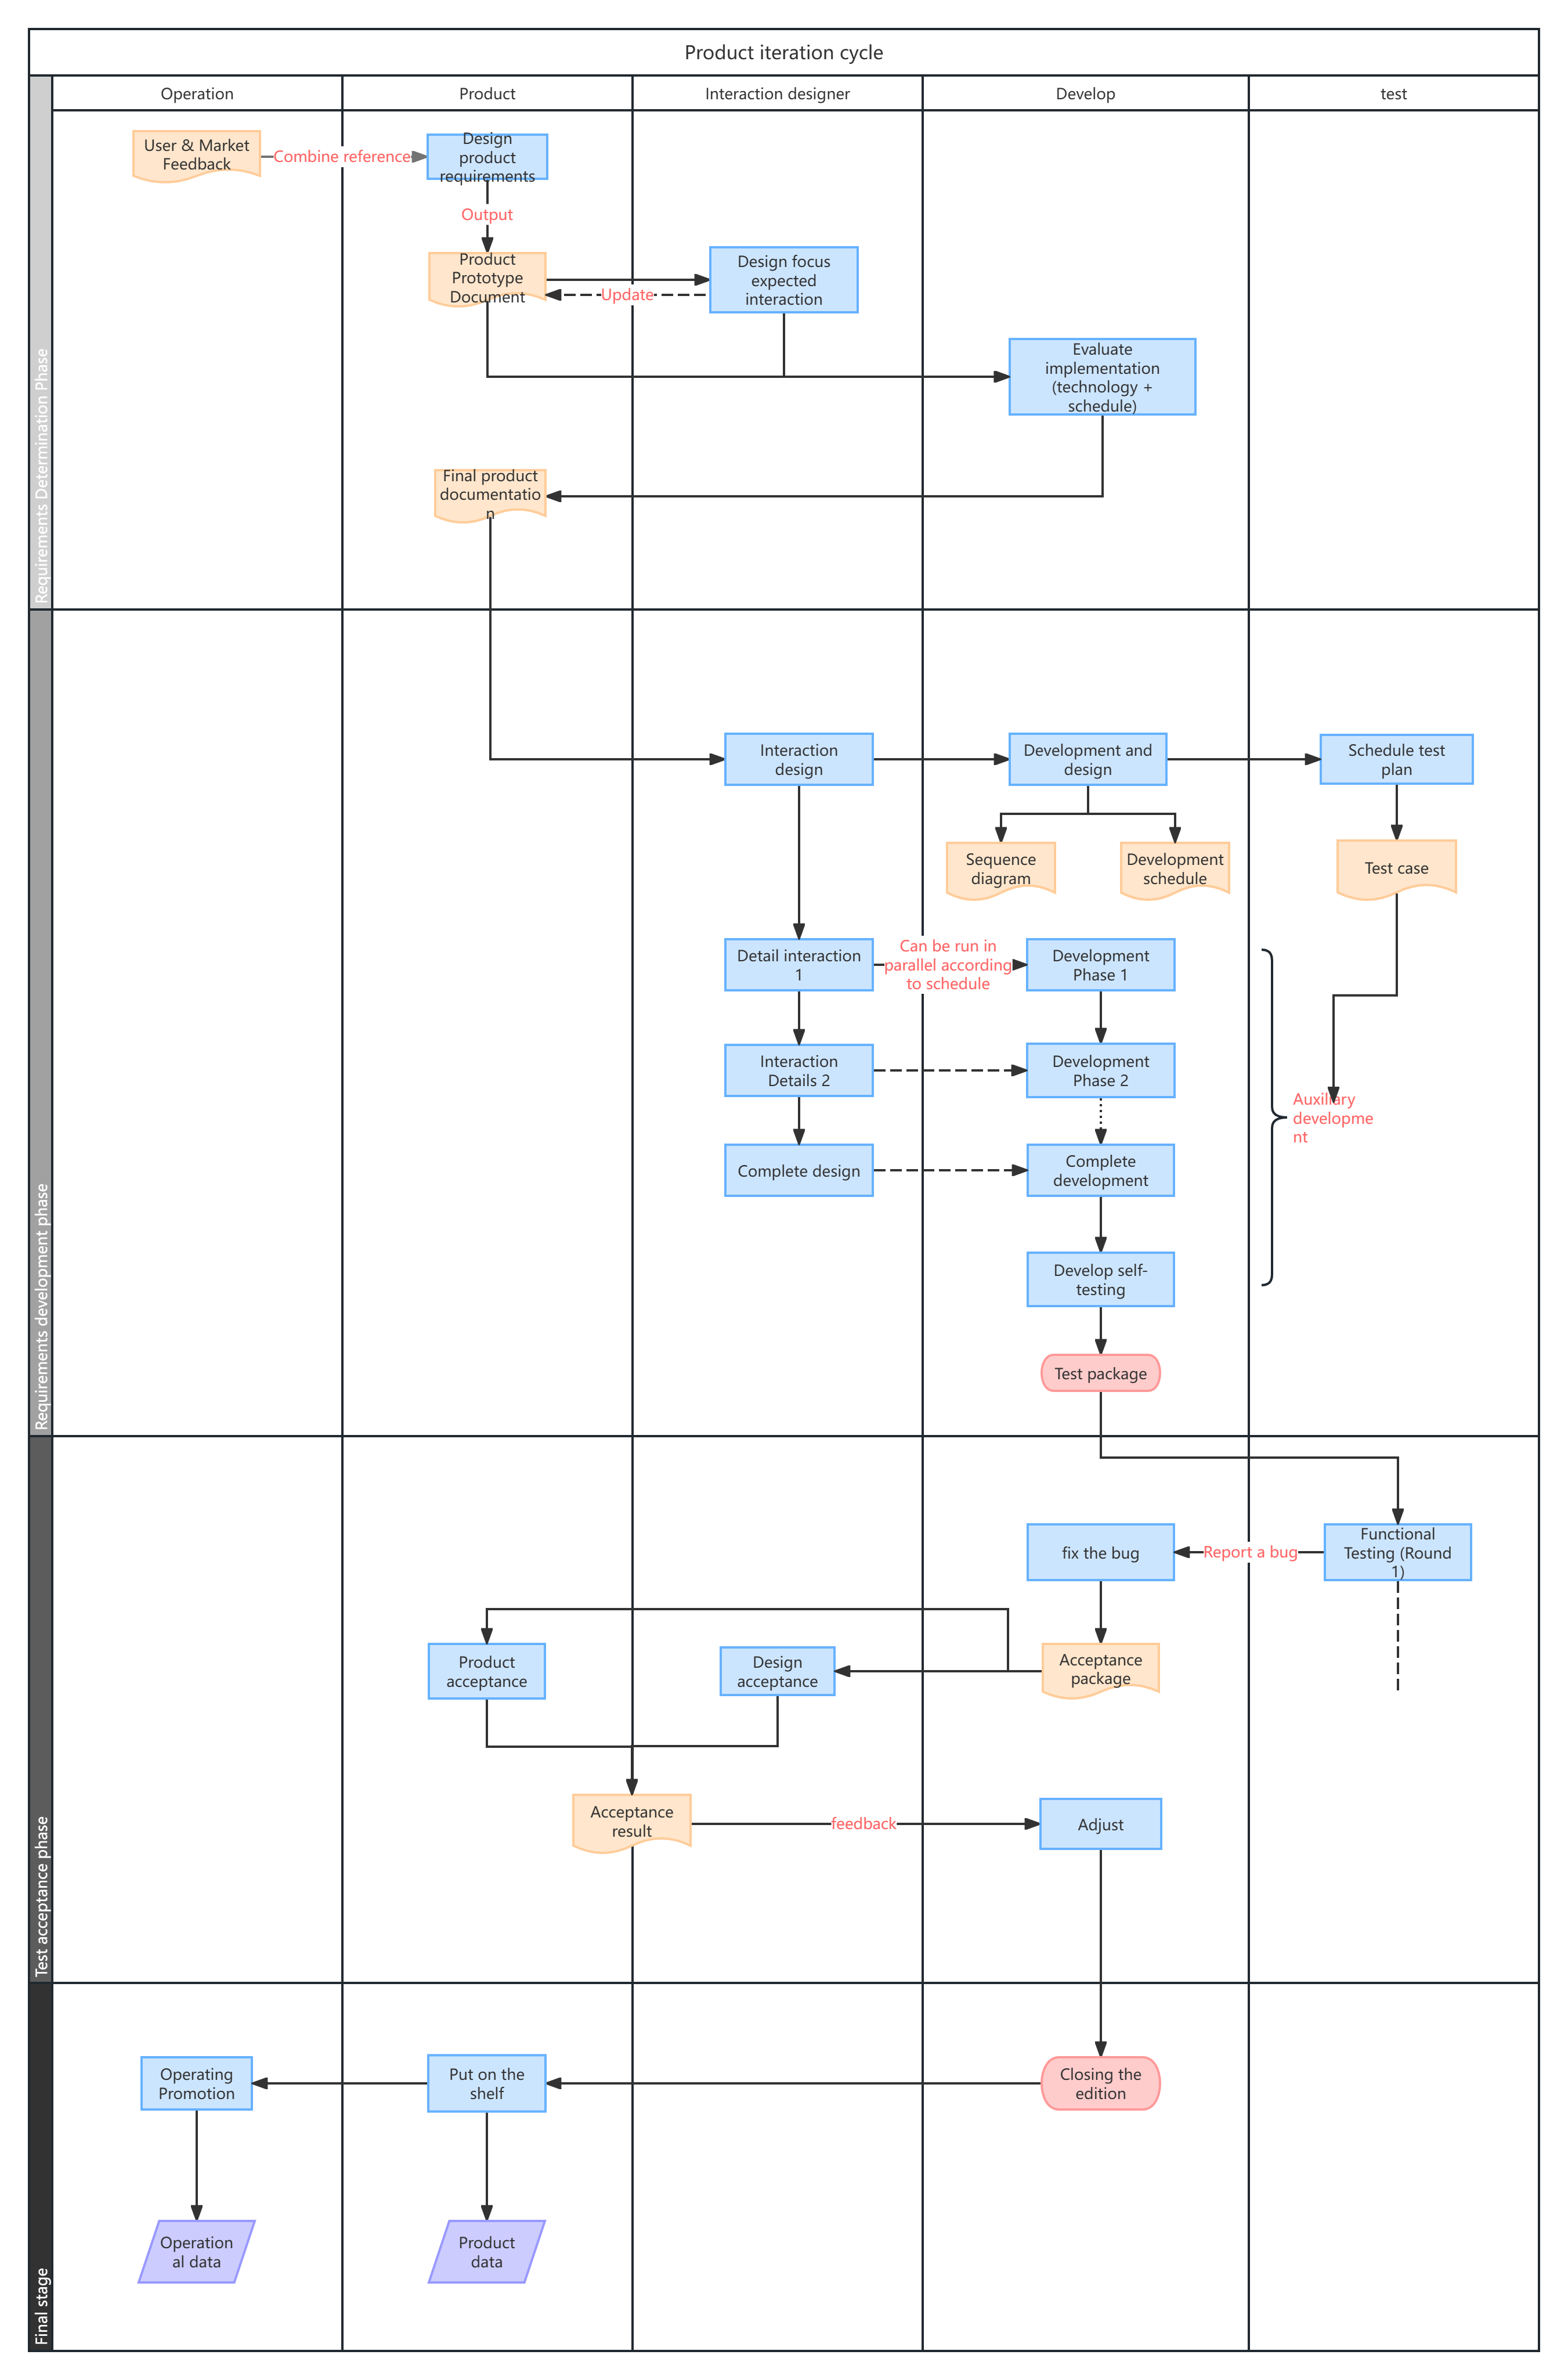
1. Product iteration cycle flow chart
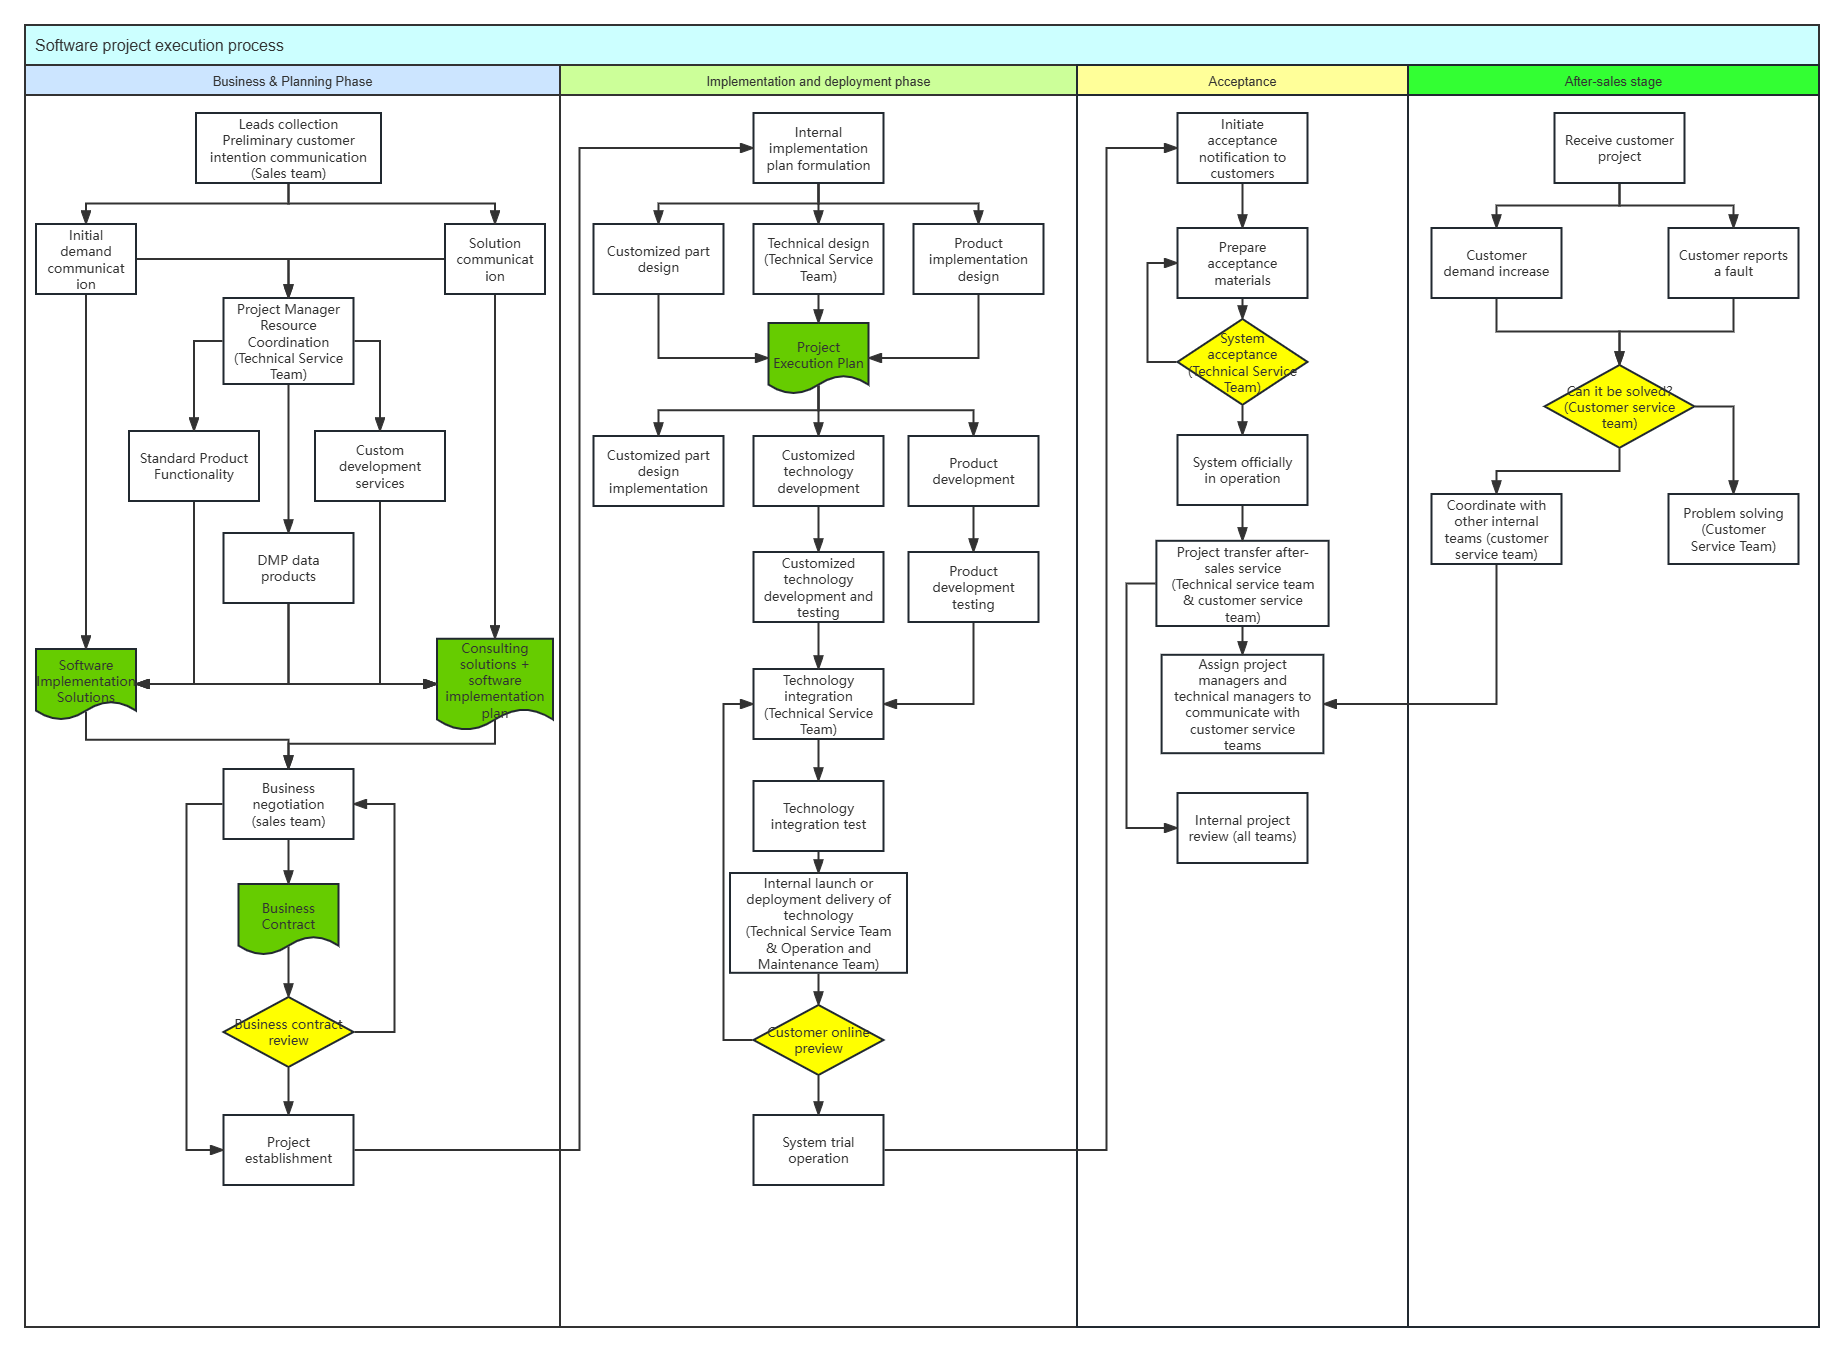
2. Software Project Flowchart
3. Operating System Swim Lane Diagram
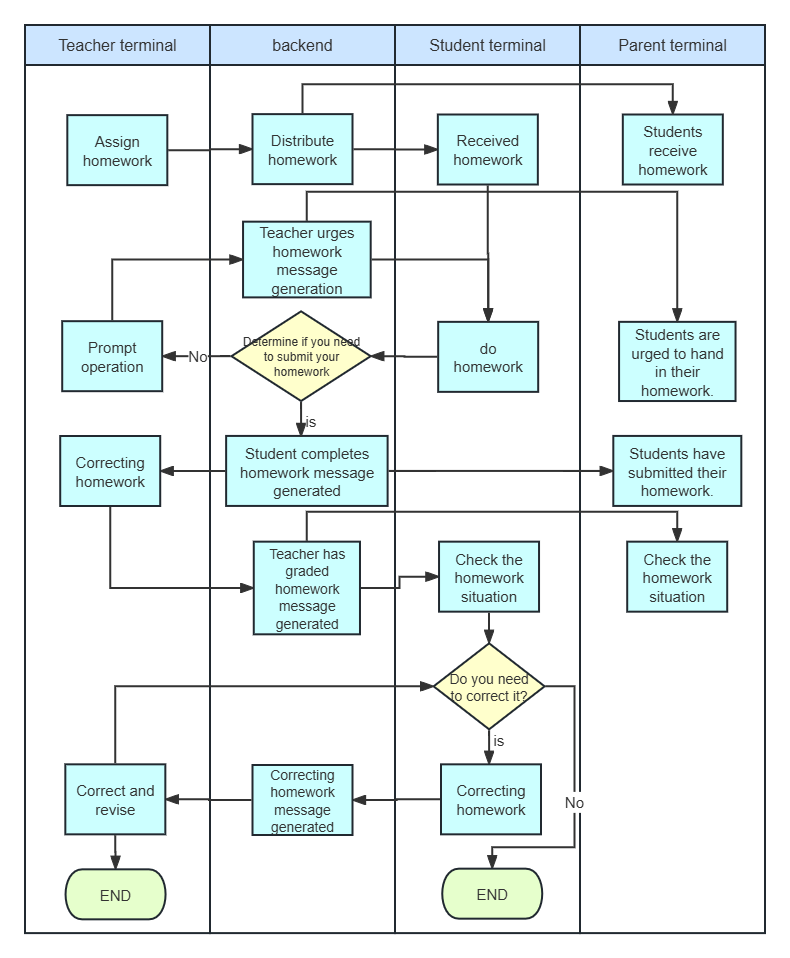
Operating system swim lane diagram
4. Recruitment interview process swimlane diagram
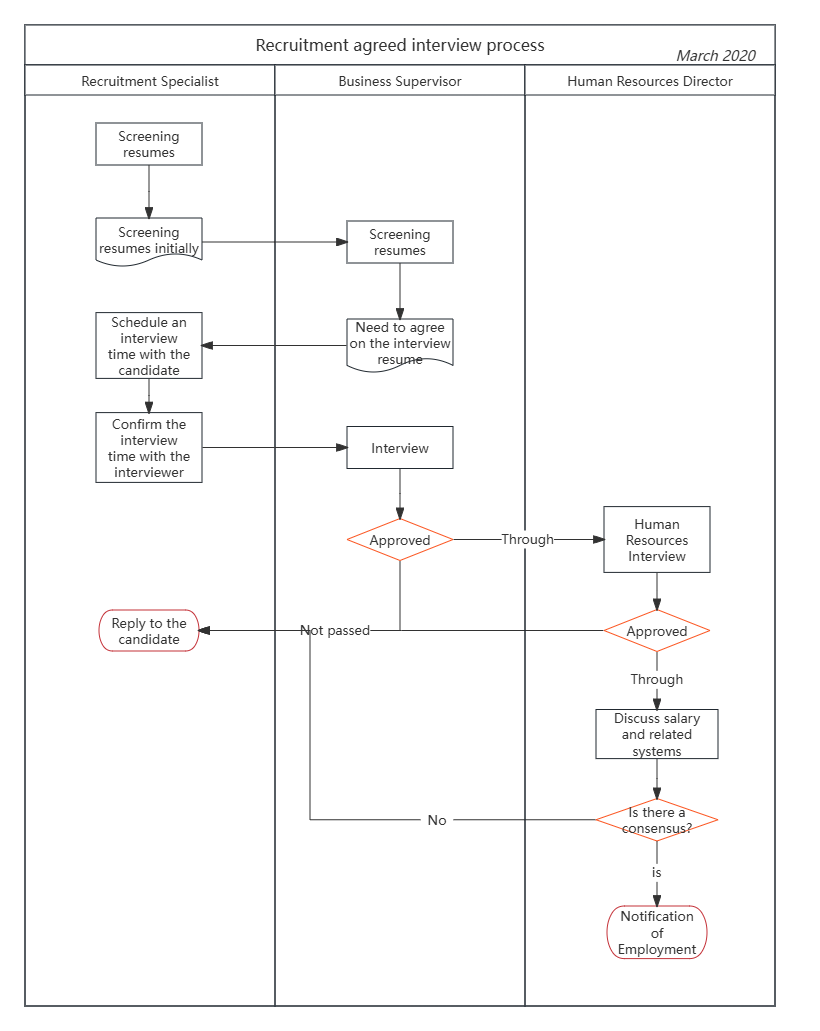
Recruitment appointment interview process
5. Reimbursement process swimlane diagram
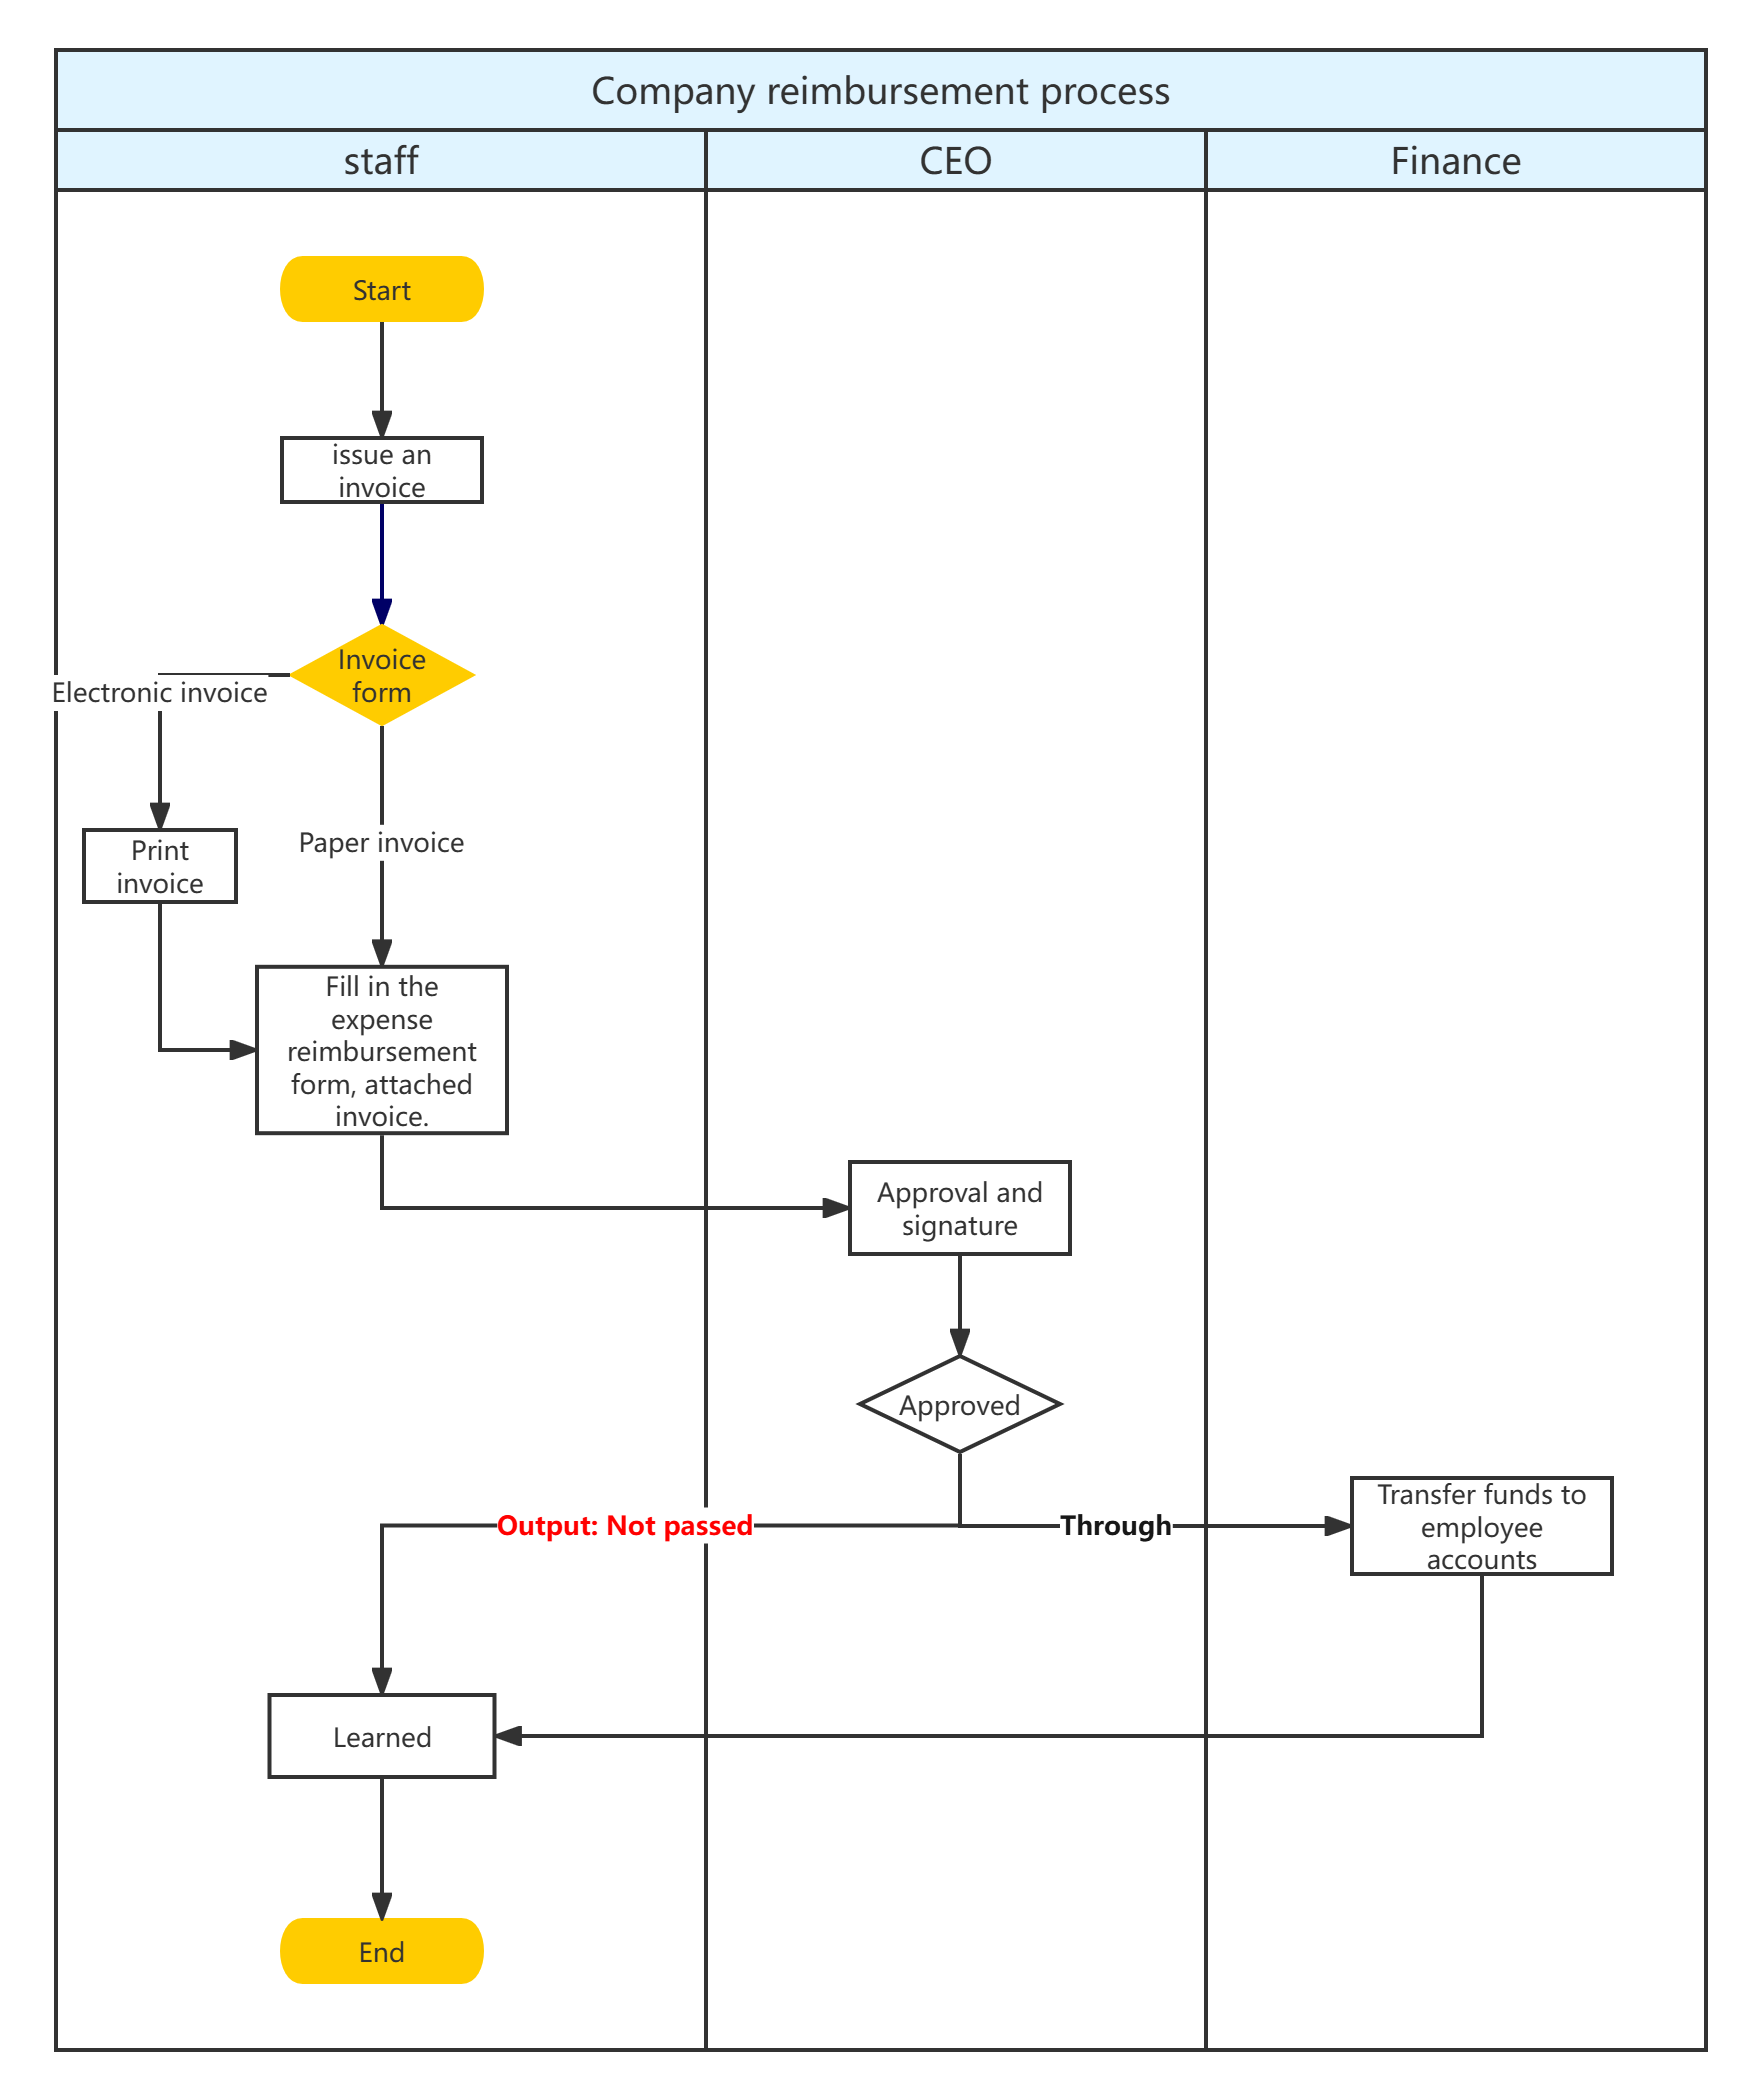
Reimbursement process swimlane diagram
Before drawing, let's make a few things clear:
1. Analyze the key logic of the function. Identify all the people and departments involved; determine the role each person plays, what tasks they undertake, and sort out the relationships between the participants; the tasks to be completed, and the task process.
2. Clarify the path of start and end. In each functional module, where does the process start and where does it end; there is only one start and end.
3. Determine the functional modules and core paths. The core flow must be clear.
4. Optimize the sequence and merge abnormal processes to ensure smooth processes and coordinated work among departments.
5. The merger and split process has a basis. First the complex and then the simple, first the addition and then the subtraction; research related products, mergers and splits are reasonable and well-founded.
How to draw a swimlane diagram:
1. Create a new flowchart
ProcessOn flowchart designer can add pools and lanes for drawing. Regardless of the cross-functional flowchart of any business, the appearance is basically very similar, so users can apply the template with one click.
Steps:
Step 1: Create a new [Flowchart] or [ Swimmlane Chart]
Step 2: Rename the file
2. Drag and drop using swimlane graphics
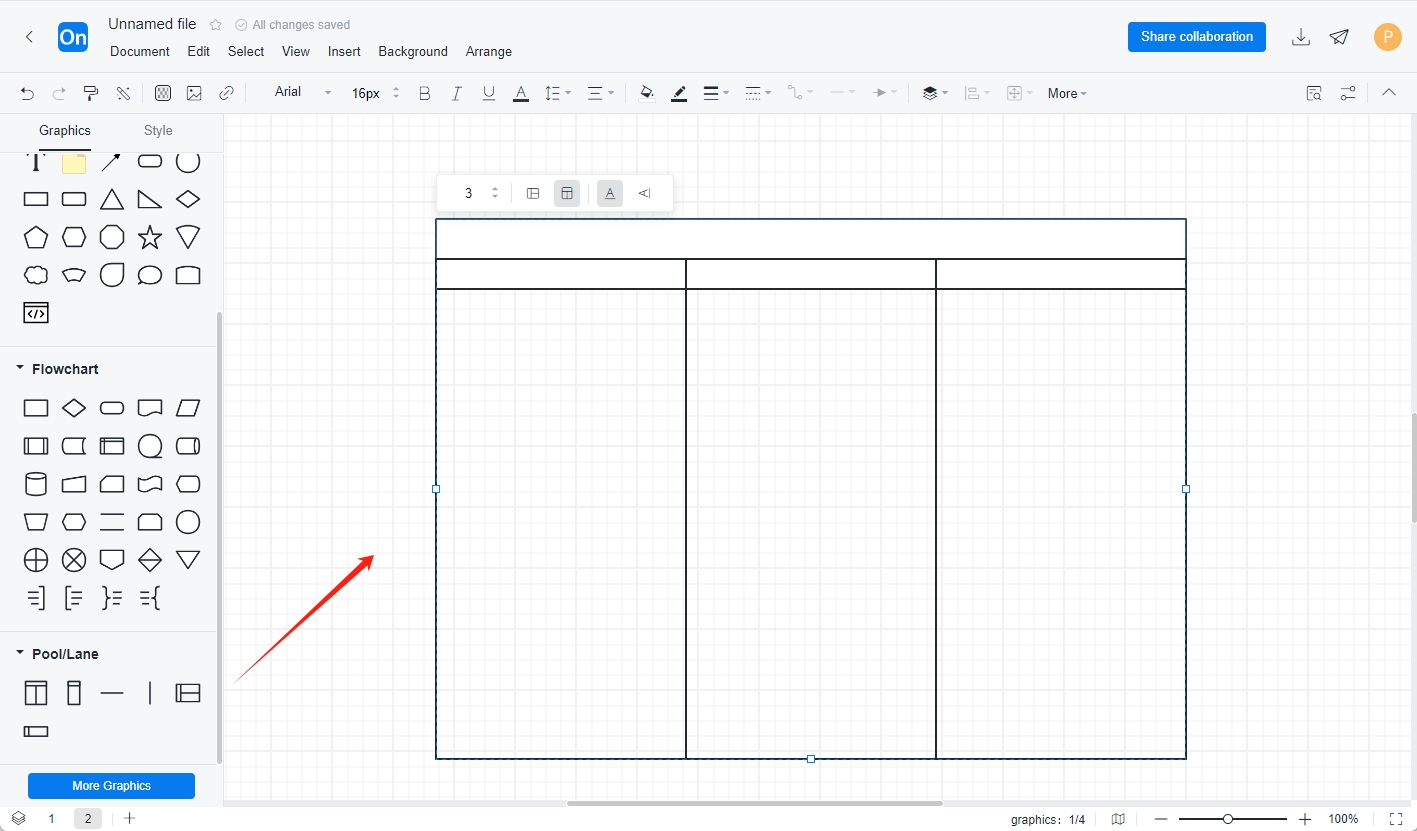
Steps:
Step 1: Drag the pool (1, 5 graphics) or lane ( 2, 6 graphics) from the left toolbar [Pool/Lane] to the editing area
Step 2: Select the title bar and set the number of lanes in the menu bar. You can also drag the pool first, then drag the lanes, and the lanes will automatically merge into the pool when you drag them into the pool.
3. Add graphics
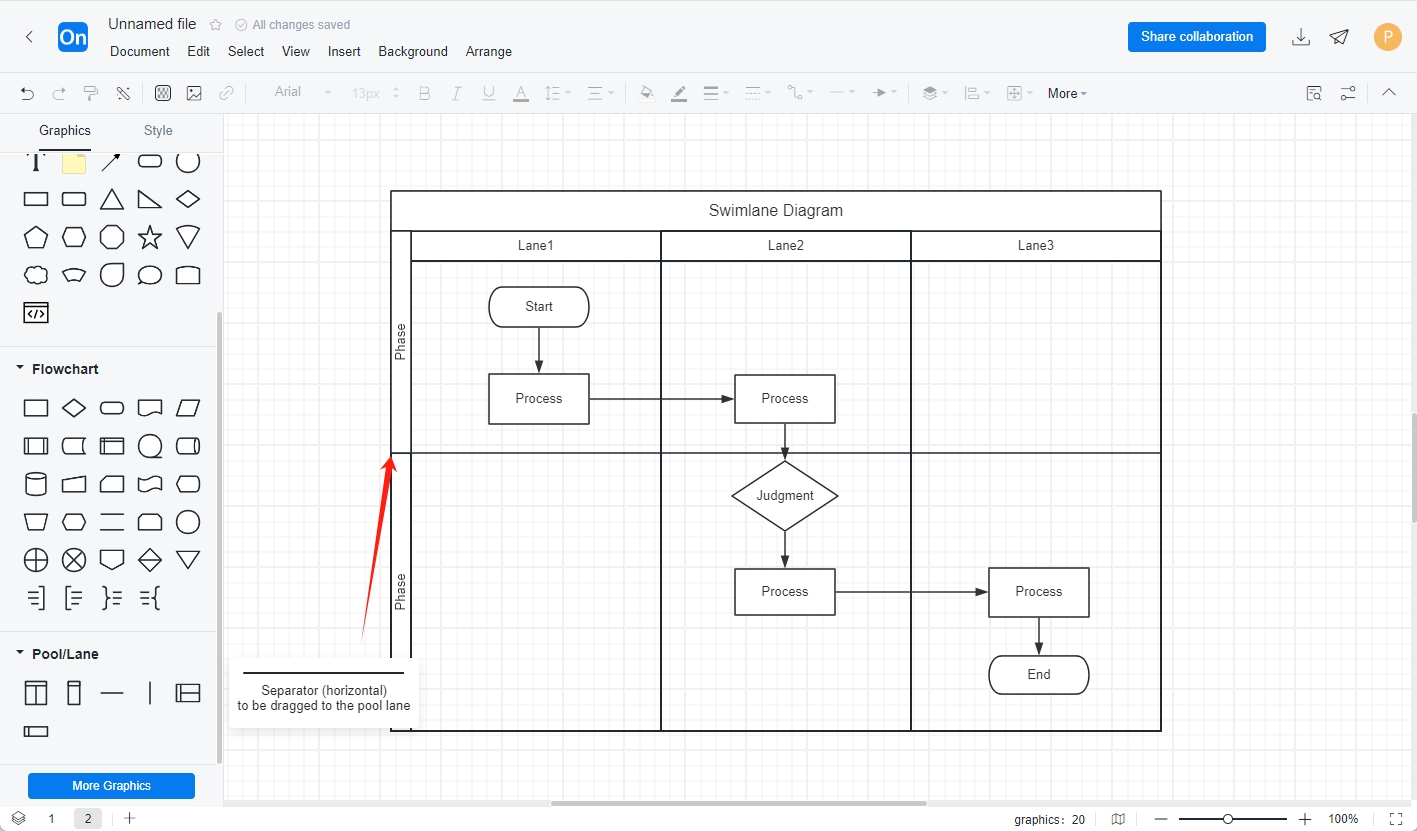
Steps:
Step 1: Add process elements to each lane . If the process involves different stages, add separators (3, 4 graphics) to the pool and determine how many areas to divide it into according to needs.
Step 2: Ensure that responsibilities are assigned to individuals and processes are smooth. You can also fill in colors in each area to make cross-functional tasks and processes clearer.
Note: According to the different directions of the lanes, the lane diagram can be divided into vertical lane diagram and horizontal lane diagram. In the vertical lane diagram, the lanes are placed perpendicular to the canvas; while in the horizontal lane diagram, the lanes are placed horizontally to the canvas. In actual drawing, there is not much difference between the two layout methods. You can choose to use vertical or horizontal cross-functional flowcharts to display any cross-functional process according to personal preference or specific needs.
Vertical layout places more emphasis on functional units, while horizontal layout emphasizes process. The choice of layout is often driven by personal interest rather than strict requirements or guidelines.
The swimlane diagram is an important bridge for cross-departmental communication. It helps break down departmental barriers, promote information sharing and collaboration . Mastering and making good use of this tool will bring you a more efficient life and work experience .
Humankind has accumulated wealth for thousands of years, and all the knowledge, insights, wisdom and art are like gifts specially prepared for you. ProcessOn is a product that combines thinking, efficiency, collaboration and safety. It is the embodiment of human wisdom and serves any person or team who wants to be efficient .