

Product managers or project managers often need to deal with business process diagrams in their daily work. It can help us sort out the business, express requirements efficiently, and avoid useless work.
Today, we will help you quickly get started with business process diagrams from five aspects: basic introduction, classification, business process sorting steps, common scenarios and drawing methods.
Business process diagram is a diagram that describes the business relationships, work sequences, and management information flows between various units and personnel within a management system. It uses some specified symbols and lines to represent the processing of a specific business, helping analysts to find unreasonable flows in the business process.
A business flow diagram is a data for managers to conduct system analysis. It is also a tool for system analysts and business operators to communicate about business. System analysts can use business flow diagrams to draw up the computer processing part. Business flow diagrams can be divided into basic business flow diagrams and cross-functional flow diagrams.
Basic business process diagram is used to describe the process of a single role when handling a certain matter. Its components are: tasks, roles, information, and exceptions.
Tasks: what to do and what is the goal of the user to execute the process.
Roles: what kind of role executes this process.
Information: how this process is executed from the beginning to the end.
Exceptions: problems that arise.
Case: Sales business process diagram

Sales business workflow diagram-Go to edit
A cross-functional flowchart describes the process when multiple roles handle a certain matter at the same time. It is generally drawn from three dimensions: Department dimension: differentiate through departments/responsible persons, and clarify the task links that each department/responsible person is responsible for completing.
Stage dimension: distinguish by task stage, and clarify the task links that need to be handled at each stage.
Activity dimension: There will be different activities corresponding to different task stages handled by different departments/responsible persons.
In general, the vertical axis of a cross-functional business process diagram represents the department dimension, the horizontal axis represents the stage dimension, and the grid formed by the intersection of the vertical axis and the horizontal axis represents the activity dimension. Swimlane diagrams are generally used to draw cross-functional business process diagrams.
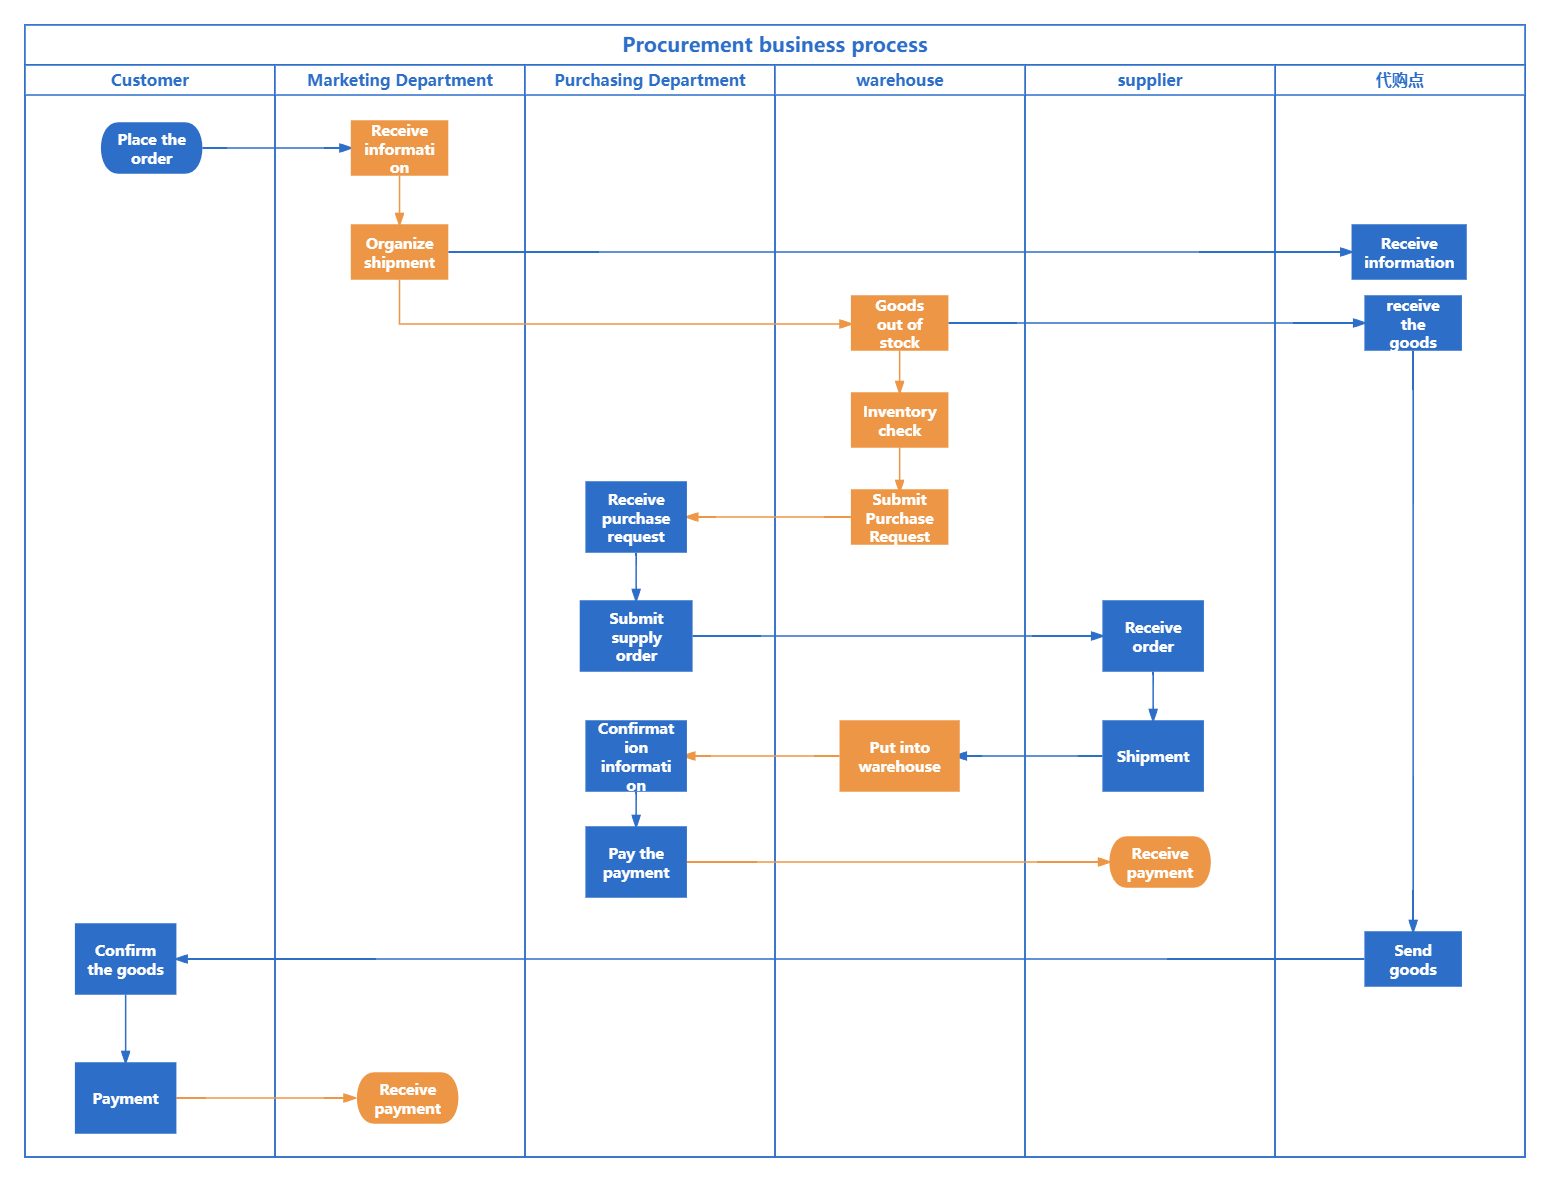
Procurement business process-Go to edit
A business process diagram is a diagram that describes the order in which each participating role completes which tasks during the business execution process. A standard business process diagram can be drawn according to the five steps of role, task, order, exception, and improvement and adjustment.
1. Roles, roles involved in business streamlining.
The execution of a business is completed by one or more roles. To clarify the business execution process, we must first know which roles are involved in the business, and then we can break down the tasks and order of each role one by one. A role can be a group, an abstract position, or a system.
2. Tasks, the tasks undertaken by each role.
Task nodes are the most important content of business process diagrams. In order to allow business-related personnel to quickly understand, tasks must be concise and accurate. When encountering complex tasks, the specific content of the tasks must be refined and the key points of the tasks must be extracted. The "subject-object structure" can be used to describe the tasks.
3. Sequence, that is, clarify the order of the processes.
In order for a business process diagram to truly and accurately restore the business execution process, the order of task execution must be clear. According to the business concept, the forward process that is successfully completed is called the main process, and the process for handling special situations that arise during the main process is the branch process. The branch process is attached to the main process and is a supplement to the main process. Therefore, when drawing a business process diagram, it is necessary to draw the main process first and then supplement the branch process.
Exception, supplement branch process.
The main process only describes the forward process for successfully achieving business goals, and only when the branch process for handling abnormal situations is completed can it be a complete business process diagram.
5. Improve and adjust the flow chart.
After the flowchart is drawn, it is necessary to improve and adjust the diagram to ensure that the final effect is more standardized, easier to read and understand. A professional business process diagram can logically express the tasks undertaken by each role, helping us to sort out the business and allocate work. At the same time, when confirming requirements with the business department and discussing solutions with R&D, the other party can quickly understand the business logic and rules from the diagram, reducing the cost of demand synchronization.
Business process diagrams are widely used in various industries and are often encountered in daily life, such as procurement, product design, shopping mall activities, etc. Here are a few examples to help everyone become familiar with business process diagrams.

Demand business process diagram-Go to edit
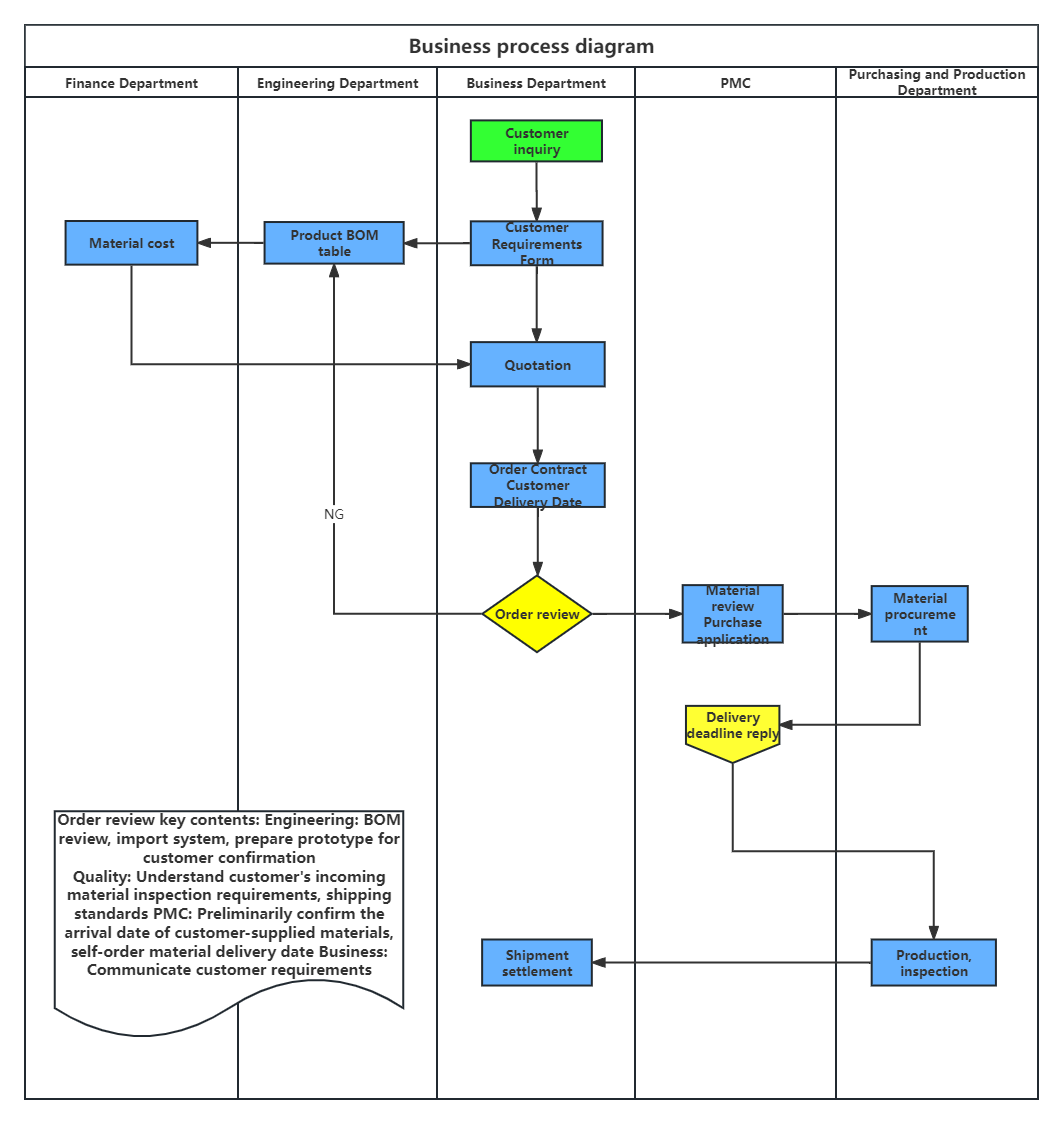
Business process diagram-Go to edit
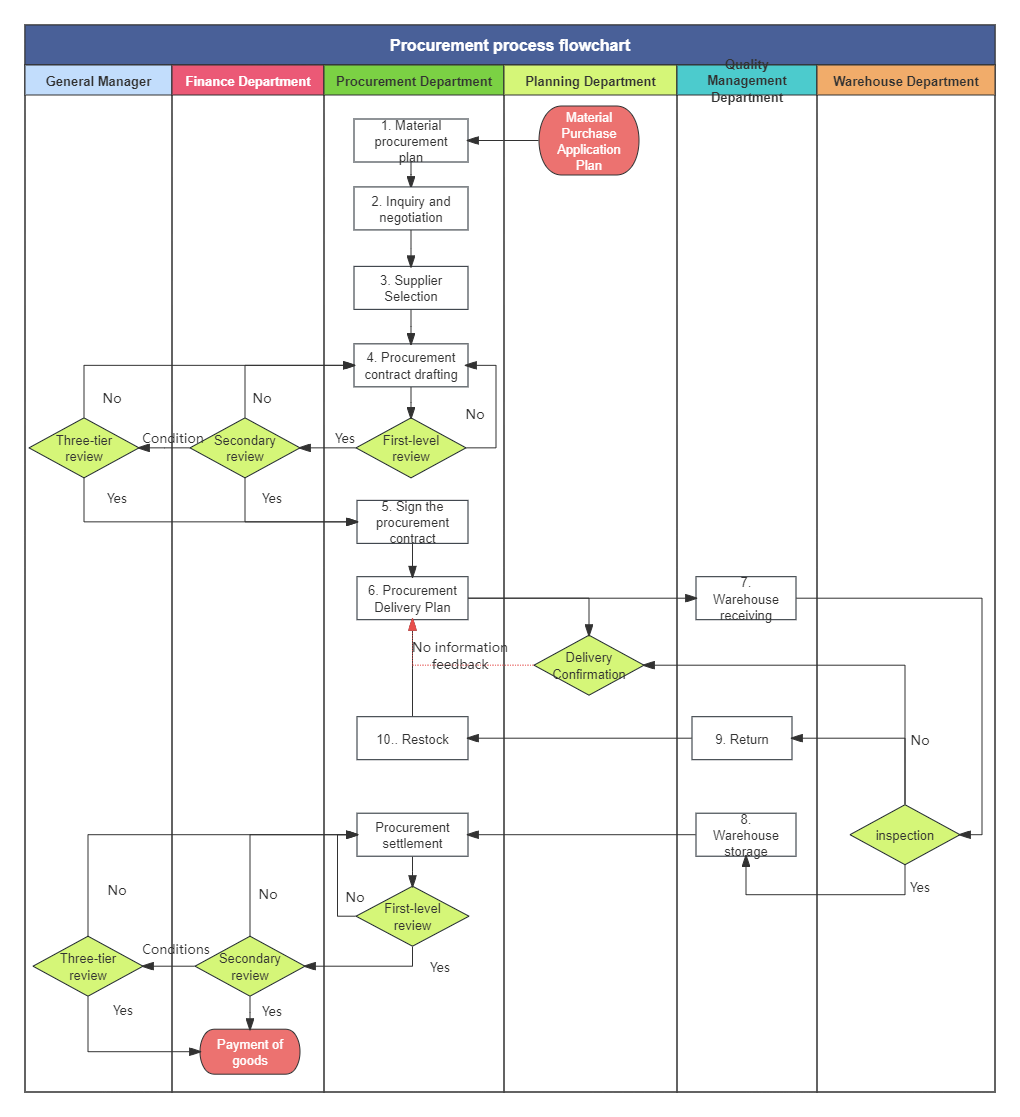
Procurement process flowchart-Go to edit
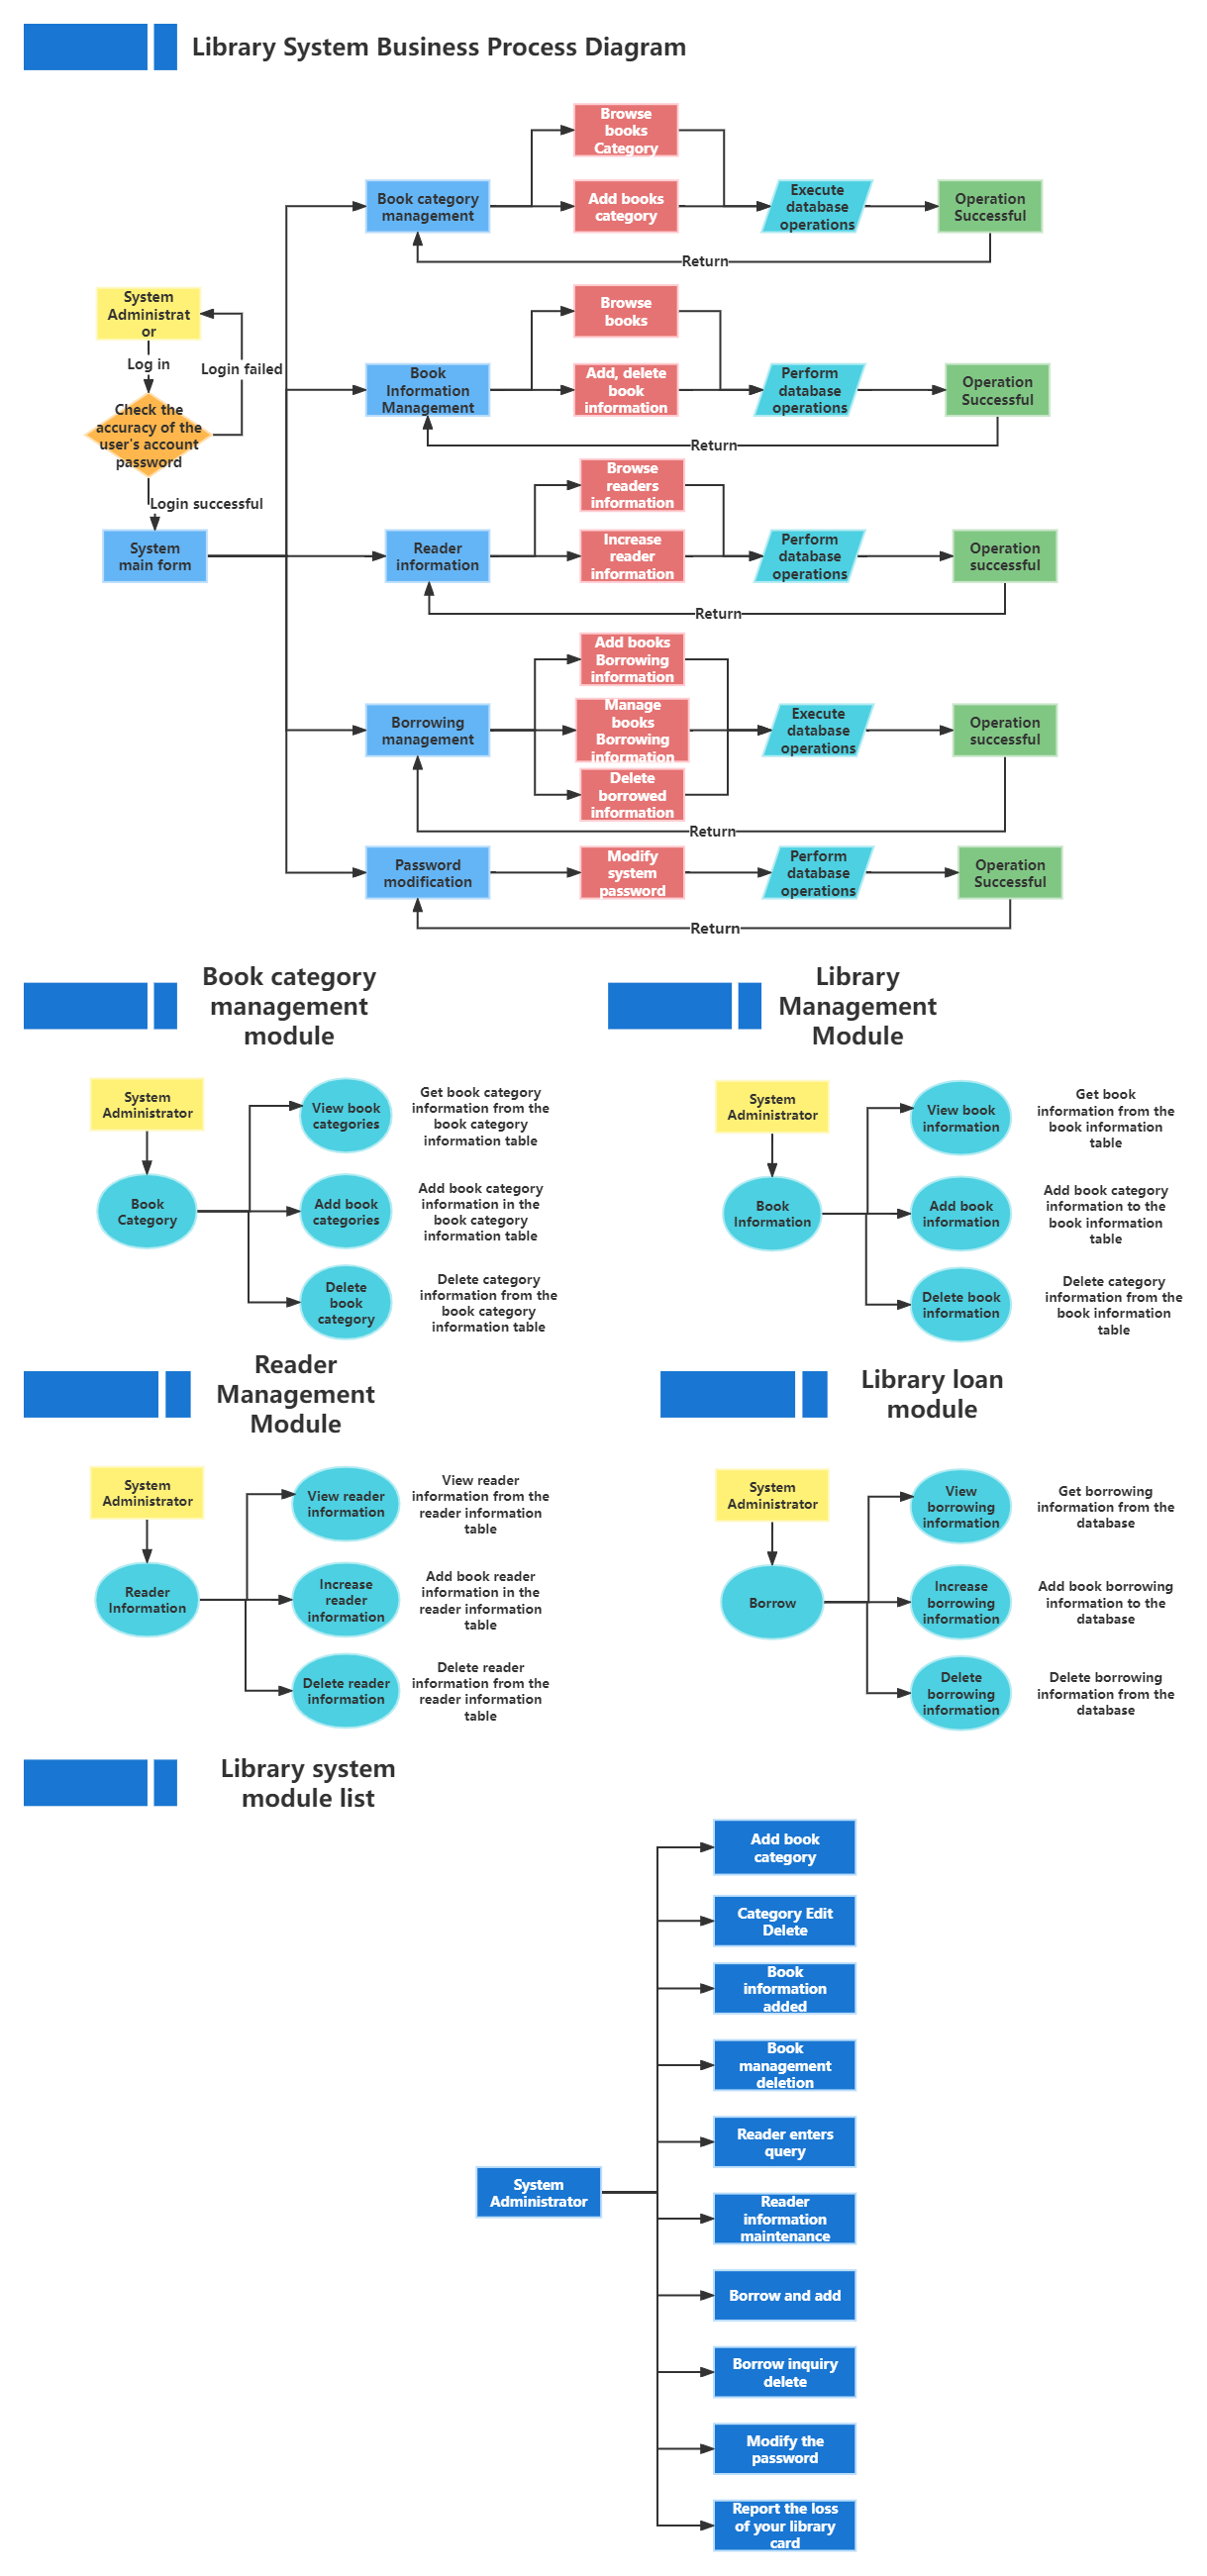
Library system business flow chart-Go to edit
After understanding the basic information of business process diagram, learning the five-step method of drawing business process diagram and studying some other users' cases, drawing business process diagram becomes very simple. Taking drawing as an example, let's show you how to draw a business process diagram using ProcessOn.
Operation method:
Step 1: Register and log in to ProcessOn, select [New] - [Flowchart]
Step 2: Drag a swimming pool to the canvas, add lanes by clicking Add, and then select the required graphics from the graphics library on the left and drag them into the lanes.
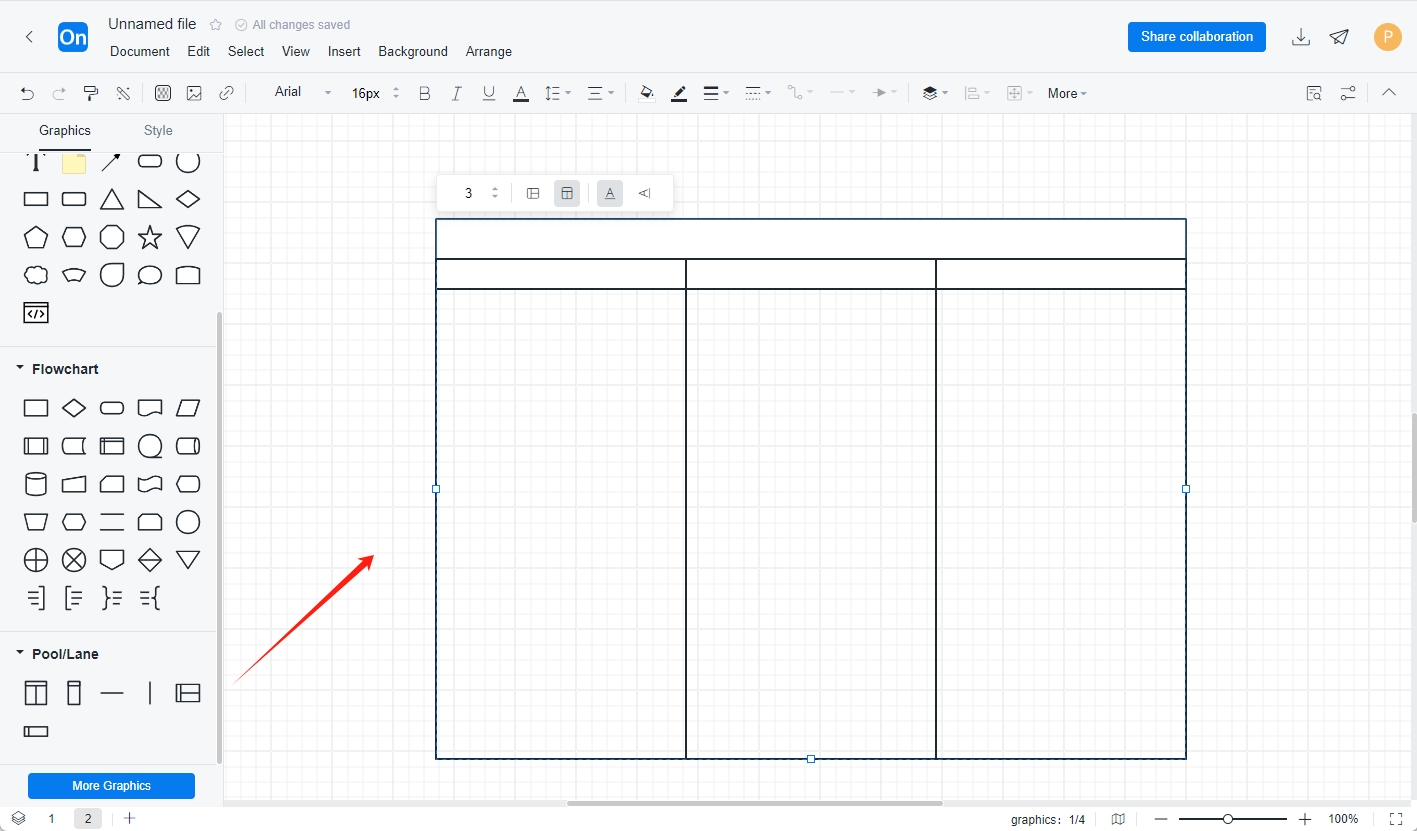
Step 3: Add content, adjust and check the overall layout and logic.

To draw a good business process diagram, you need to practice more, apply more, and combine theory with practice. I hope that everyone can use business process diagrams as standardized as possible on the premise of describing business logic and rules. If you want to learn more about the practical cases of business process diagrams, ProcessOn template library has many high-quality templates. You can search for relevant content by entering keywords.
ProcessOn supports online editing of flowcharts, mind maps, Gantt charts, prototypes, UML, network topology diagrams, etc. Users can create new content from scratch, or easily edit and modify existing drawing frameworks and case templates. The operation is simple and easy to use.